Discovering Bottom Squark Co-annihilation at ILC
Abstract
We study the potential of International Linear Collider (ILC) at GeV to probe new dark matter motivated scenario where the bottom squark (sbottom) is the next to lightest supersymmetric particle. For this scenario, which is virtually impossible for the LHC to test, the ILC has a potential to cover a large fraction of the parameter space. The challenge is due to a very low energy of jets, below 20-30 GeV, which pushes the jet clustering and flavour tagging algorithms to their limits. The process of sbottom pair production was studied within the SiD detector concept. We demonstrate that ILC offers a unique opportunity to test the SUSY parameter space motivated by the sbottom neutralino co-annihilation scenario in cases when the sbottom production is kinematically accessible. The study was done with the full SiD simulation and reconstruction chain including all Standard Model and beam backgrounds.
pacs:
14.80.Cp,12.60.JvI Introduction
Among the best candidates for a theory beyond the Standard Model (SM), Supersymmetry (SUSY) Golfand and Likhtman (1971); Ramond (1971); Neveu and Schwarz (1971); Volkov and Akulov (1973); Wess and Zumino (1974); Haag et al. (1975) remains a very compelling theory even after 30 years without an experimental confirmation. SUSY is very attractive because it successfully solves principal theoretical and experimental problems of the SM. Supersymmetric theories provide a natural solution to the gauge hierarchy problem of the SM and incorporate the unification of gauge coupling constants. Furthermore, the lightest supersymmetric particle (LSP) is stable if the R-parity is conserved and can serve as a good cold dark matter (CDM) candidate. Besides, SUSY has all ingredients to provide a solution to the baryogenesis problem via the intermediate scale leptogenesis Fukugita and Yanagida (1986) or via the electroweak baryogenesis Giudice (1992); Carena et al. (1997).
The very existence of CDM is a crucial argument in favour of SUSY, and, at the same time, an important SUSY constraint. The most direct evidence for CDM in the Universe comes from observations of galactic rotation curves. Binding of galaxies in clusters, matching observations of large scale structure with simulations, gravitational microlensing, baryonic density of the Universe as determined by Big Bang nucleosynthesis, observations of supernovae in distant galaxies, as well as measurements of anisotropies in the cosmic microwave background radiation (CMB) can also be considered as strong confirmations of CDM (for reviews see e.g. Freedman and Turner (2003); Lahanas et al. (2003)). In particular, the analysis of the Wilkinson Microwave Anisotropy Probe (WMAP) and galaxy survey data puts the most stringent constraint on the ratio of the dark matter density to the critical density Spergel et al. (2007):
| (1) |
where is the normalized Hubble constant.
In most of the parameter space of SUSY models, the value of is well above the WMAP bound. In particular, in case of well explored minimal supergravity (mSUGRA) model Chamseddine et al. (1982); Barbieri et al. (1982); Ohta (1983); Hall et al. (1983), which is defined by universal soft SUSY breaking scalar masses (), gaugino masses () and A-terms () at GUT scale, the CDM is the lightest neutralino . Neutralino should annihilate or co-annihilate with other SUSY particles at the Early Universe time intensively enough to lower down to experimentally acceptable level. This happens in the following special regions of SUSY parameter space:
-
1.
The bulk annihilation region at low values of and , where neutralino pair annihilation occurs at a large rate via -channel slepton exchange.
- 2.
-
3.
The hyperbolic branch/focus point (HB/FP) region Chan et al. (1998); Feng et al. (2000); Baer et al. (1996, 1995) at large near the boundary of the Radiative Electroweak Symmetry Breaking (REWSB) excluded region where the superpotential Higgsino mass term becomes small and the neutralinos have a significant higgsino component, facilitating their annihilations into and pairs.
-
4.
The -annihilation funnel, which occurs at very large values of Drees and Nojiri (1993); Baer and Brhlik (1996, 1998); Baer et al. (2001); Ellis et al. (2001); Roszkowski et al. (2001). In this case, one has . An exact equality in the mass relation is not necessary, since the width can be quite large ( GeV); one can thus achieve a large annihilation cross section even if is several values of width away from resonance. The heavy scalar Higgs also contributes to the annihilation cross section.
In addition, for a particularly large values there exists a region of neutralino top-squark (stop) co-annihilation and, at low values, a light Higgs annihilation funnel region.
In all these regions the processes of neutralino (co-)annihilation have a high enough rate to suppress the value of to the experimentally acceptable level.
One should note that each particular DM motivated region of SUSY parameter space defines a specific collider phenomenology. It is also worth to mention that some of those regions are problematic for the LHC and the ILC would play a crucial role in exploring them or even in discovering Supersymmetry in these regions. The representative example of such a region is the HB/FP region which, as it was shown, can be efficiently covered only by the 1 TeV ILC colliderBaer et al. (2003a, b, 2004).
In this paper we study the sbottom-neutralino co-annihilation (SBC) scenario and its ILC phenomenology. In the SBC scenario, as follows below, the typical sbottom-neutralino relative mass difference is below . This parameter space is inaccessible neither at Tevatron nor at the LHC. It is interesting to notice that Tevatron would be in a better position than the LHC to study light sbottom scenario which requires very low -jet threshold and would be sensitive to kinematically allowed parameter space with Baer et al. (1999); Demina et al. (2000). Therefore the SBC scenario which we study here is new for the collider phenomenology. Also, as we show below, the SBC scenario has not been studied in detail from the theoretical point of view.
The rest of the paper is organized as follows. In Section II we discuss in detail the SBC scenario and, in particular, the GUT scale boundary conditions providing SBC at the Electroweak Scale. In Section III we present the signal and background studies at the detector level and work out a strategy for observation of the signal. Conclusions are drawn in Section IV.
II Sbottom co-annihilation scenario
As we mentioned above, one of the important mechanisms of neutralino relic density suppression occurs when the next-to-lightest supersymmetric particle (NLSP), is close in mass to the neutralino. In this case, the neutralino relic density is not only suppressed by the neutralino-neutralino annihilation, but also by co-annihilation with the NLSP.
In the traditionally well-explored mSUGRA model only stau or stop co-anninhilation can take place to suppress the CDM relic density down to the experimentally allowed region.
On the other hand in the various models motivated by SUSY GUTs one can expect different kinds of deviation from universal boundary conditions which would predict qualitatively different phenomenology still consistent with the present experimental data (see e.g. Baer et al. (2008) and references therein).
In such models some new co-annihilation scenarios can take place. In particular, in Pallis (2004); Profumo (2003) it was noticed that under certain relation of scalar masses the sbottom-neutralino relative mass difference can become below of about and provide effective SBC suppression of the relic density down to the experimentally acceptable level. The papers Pallis (2004); Profumo (2003) concluded that in case of minimal sfermion non-universality (mSFNU) defined by , , , , parameter space the SBC scenario could be realised, where the left-right squark and sfermion mass parameters at the GUT scale extend the universal mSUGRA parameter.
It was found that the ratio
below of about 0.5 could provide a SBC scenario.
In this section we take a closer look at the results of Pallis (2004); Profumo (2003) where conditions for SBC were derived using simplistic one-loop Renormalisation Group Equations (RGEs). In our paper we use mass spectra calculation from ISAJET v7.79 package Paige et al. (2003) where the complete two-loop RGEs for the gauge couplings, Yukawa couplings and soft breaking terms are implemented. Another reason for checking of the SBC scenario was applying a different approach in comparison with Pallis (2004); Profumo (2003), where the exact unification was imposed at the GUT scale and RGEs were run just once from this scale. In the ISAJET the RGEs are solved iteratively, running from the weak scale to the high scale and back, while Yukawa couplings are not fixed at the GUT scale. After each iteration the SUSY masses are recalculated, and the renormalization group improved one-loop corrected Higgs potential is calculated and minimized. This way of mass calculation is widely accepted to be the most accurate one.
We have performed an exhaustive scan of the SUSY parameter space defined by
| (2) |
where we went beyond the minimal sfermion non-universality (mSFNU) scenario, defined in Pallis (2004); Profumo (2003), and split into two parameters and while keeping as defined previously.
a) (red/dark),
b) (pink/grey),
c) (light-green/very light grey),
d) (dark-green/light grey).
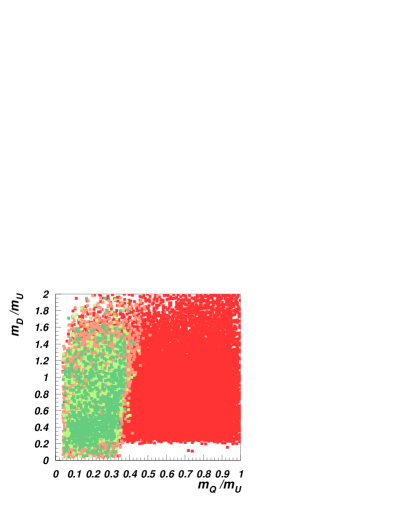
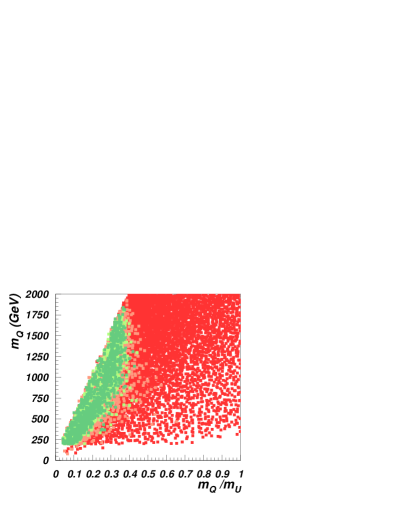
Our first results are shown in Figure 1, which presents the results of the scan in the SUSY parameter space defined by (2) shown in vs. (left) and vs. (right) planes respectively with the following color code for
:
a) (red/dark),
b) (pink/grey),
c) (light-green/very light grey),
d) (dark-green/light grey).
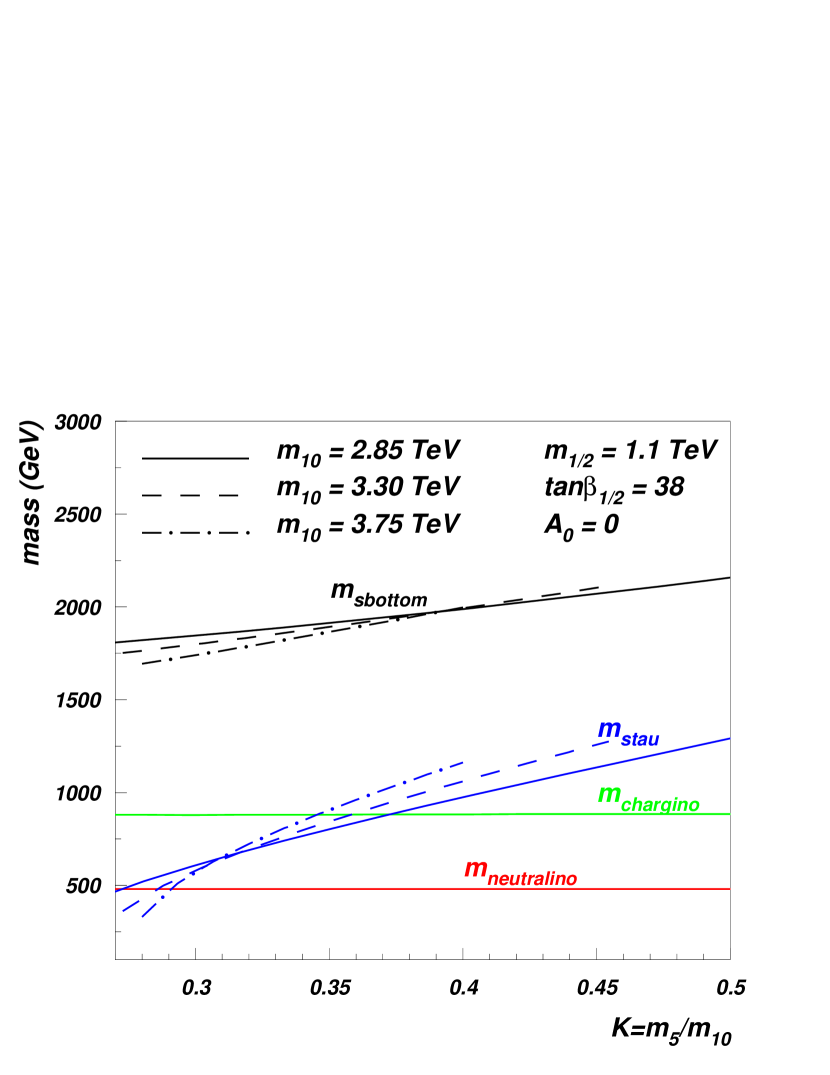
One can see that the SBC scenario cannot be realized in the mSFNU scenario adopting a more realistic approach which we used in our study. As indicated in Figure 1, the neutralino-sbottom mass split which is required by the SBC scenario, defines a non-universal condition which eventually cannot be realized in the mSFNU scenario with . We have also found that in the mSFNU region for the SBC scenario from Pallis (2004); Profumo (2003), actually, the stau co-annihilation takes place when the ISAJET approach is used for the mass spectrum calculation. We illustrate this in Figure 2 which presents sbottom and stau masses versus for the mSFNU benchmark points from the mass spectra in Profumo (2003) for which was calculated using ISAJET v7.79. One can see that in the nSFNU case the stau-neutralino mass split becomes small for sufficiently small , providing a stau-coannihilation mechanism of CDM suppression while sbottom is quite far from being NLSP.
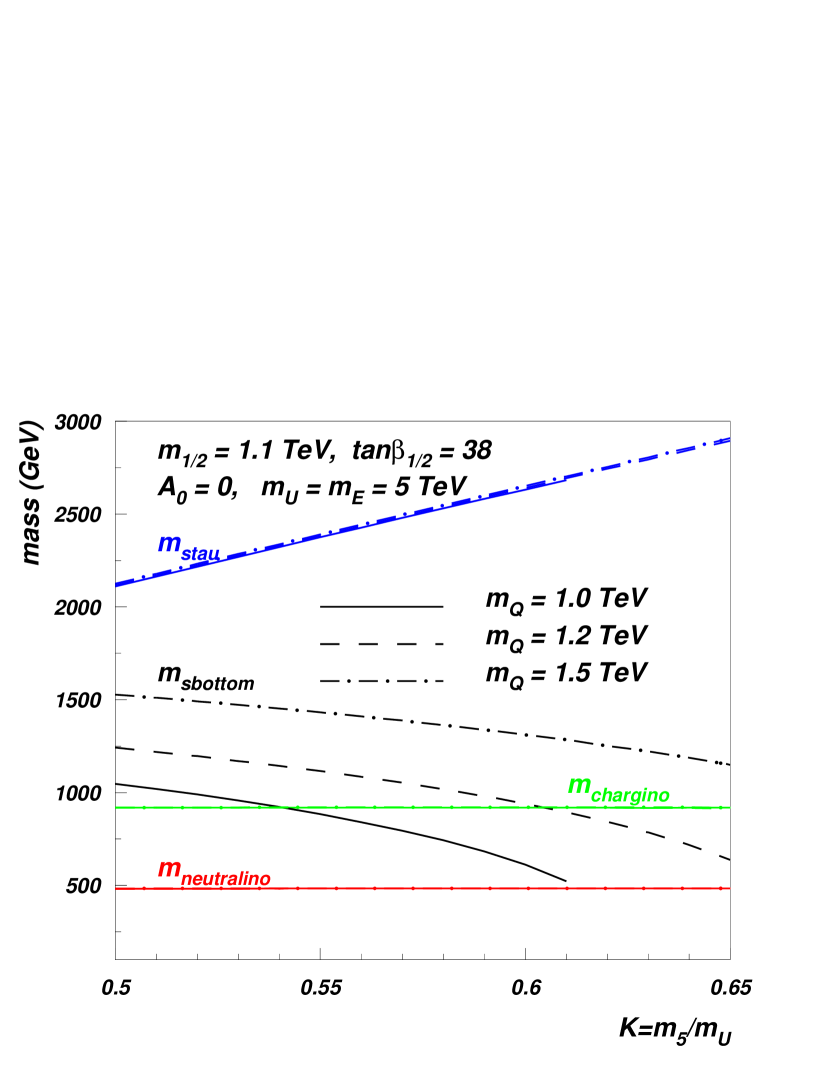
We have also found that if one departs from the mSFNU scenario and consider as an additional independent parameter as we did in our scan, there are solutions for the SBC scenario. For sufficiently small values of as shown in Figure 3 the bottom squark becomes NLSP with a mass quite close to the neutralino mass which provides the sbottom-neutralino co-annihilation suppression of CDM. Hereafter we refer to this scenario as next-to-minimal sfermion mass non-universality (nmSFNU).
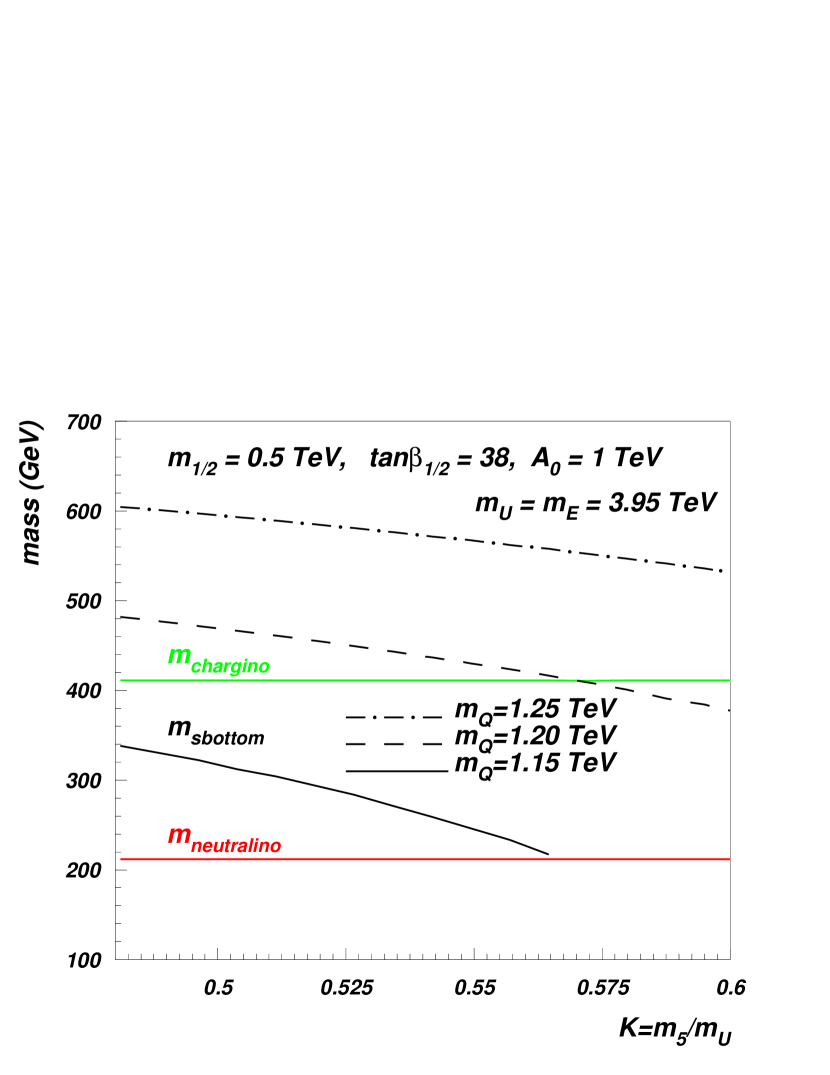
Finally, in Figure 4 (top) we present a mass spectra for the nmSFNU scenario for the benchmark point ( TeV, , TeV and TeV) relevant to the 500 GeV ILC which will be able to produce sbottom with mass below 250 GeV with about 10% relative mass split with neutralino. For a sufficiently small parameter (of the order of 1 TeV) the SBC scenario takes place. In Figure 4 (bottom) we present the respective behaviour of versus which reaches constraints when .

We would like to stress that deviations from mSMNU which, as we have discussed, provide a sbottom co-annihilation scenario would be an indicator of non-trivial D-term contributions to soft scalar masses, which in its turn could give a hint about the gauge group content at very high energies as noticed in Kolda and Martin (1996). As we will show below, the ILC has a promising potential to cover parameter space motivated by the SBC scenario thus shedding light on the gauge group properties at the GUT scale.
III Sbottom production at the ILC
III.1 The ILC and the SiD Detector Concept
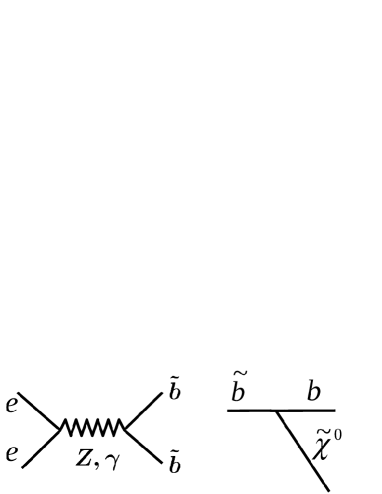
The ILC is a future electron-positron collider designed to collide particles at the centre of mass energy of 500 GeV. At the ILC sbottom pairs can be produced via s-channel photon or -boson exchange followed by sbottom decay into and b-quark, see Figure 5. In the scenario described above such events will result in two soft b-jets, which are generally not acoplanar nor acolinear, and a missing energy.
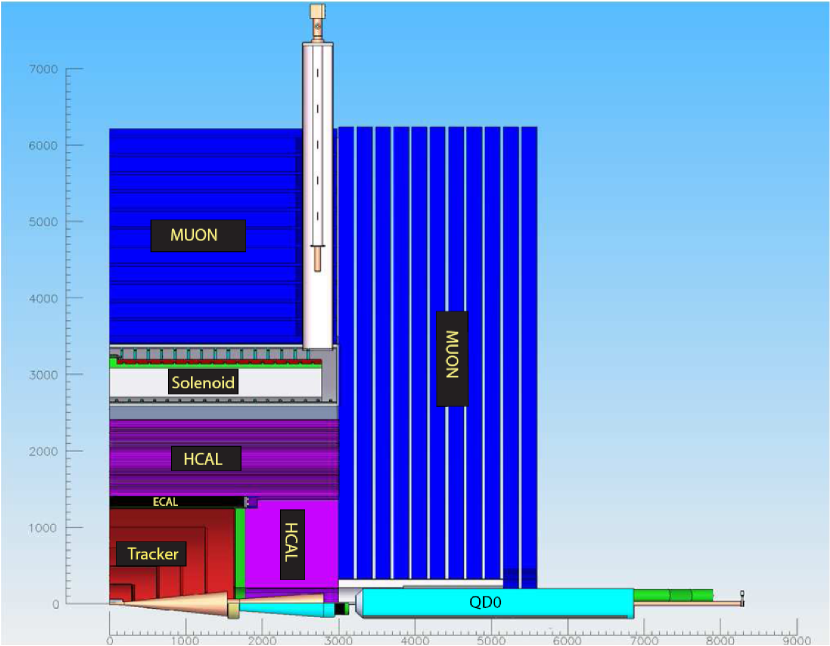
The sensitivity to the sbottom production was studied in the framework of the Silicon Detector (SiD) concept using full detector simulation and event reconstruction. SiD is a detector concept SiD Collaboration (2009) designed for precision measurements of a wide range of possible new phenomena at the ILC. It is based on a silicon pixel vertex detector, silicon tracking, silicon-tungsten electromagnetic calorimetry, and a highly segmented hadronic calorimetry. Particle Flow Algorithm (PFA) approach SiD Collaboration (2009) is an important strategy driving the basic philosophy and layout of the detector. SiD also incorporates a 5 T solenoid, iron flux return and a muon identification system. A schematic view of SiD quadrant is shown in Figure 6.
III.2 Signal and Background Rates and Properties
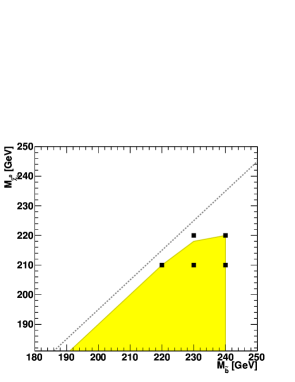
In this study the CalcHEP package Pukhov (2004) was employed to generate SUSY signal events. The events were converted to the Les Houches format Boos et al. (2001), passed to Pythia Sjostrand et al. (2006) for their fragmentation and particle decays and consequently to the SiD full simulation and reconstruction chain SiD Collaboration (2009). Several points in the MSSM parameter space were chosen close to the kinematic limit in order to investigate the discovery potential. These points correspond to various masses of the bottom squark and neutralino: (230, 210); (240, 210); (230,220); (240,220); (220,210), all in GeV. For each signal point 200k events were generated, also accounting for the ISR, FSR and Beamstrahlung (BS) processes.
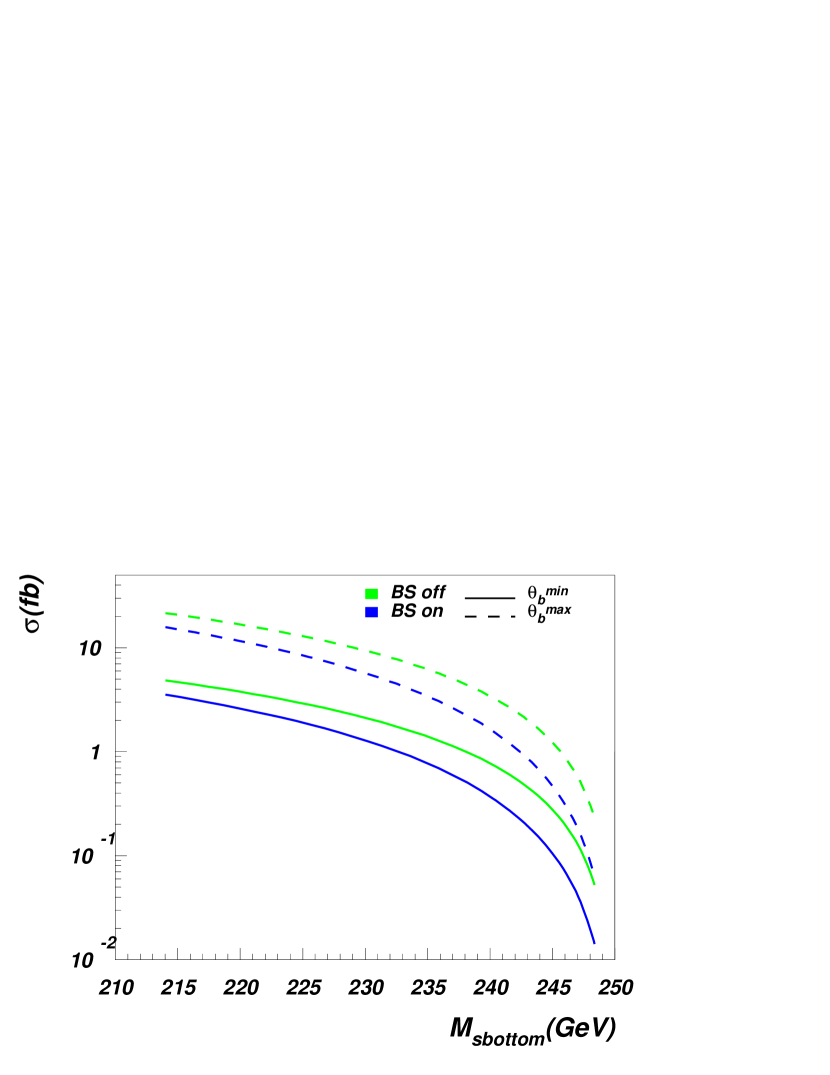
The cross section of sbottom pair production depends strongly on how close the sbottom mass is to the ILC kinematical limit, see Figure 7 for GeV, diving quickly down for masses approaching 250 GeV. The mass of the lightest bottom squark mass, , and the mixing angle of the lightest and heaviest bottom squarks, , completely determine the cross section of pair production of lightest bottom squarks. For the fixed mass, the cross section can vary by factor of about 5, depending on the value of . The solid line in Figure 7 corresponds to the case of the minimal cross section, which takes place at , while the dashed line corresponds to the case of the maximal cross section which takes place at . The line grey levels (light/dark) in Figure 7 present the effect of Beamstrahlung radiation (on/off), which decreases the cross section by about 20%. The signal cross section is about fb for GeV bottom squark mass for (solid dark line, Figure 7) and about factor of 5 larger for (dashed dark line, Figure 7). In our analysis we use signal cross section , therefore conservatively estimating the ILC potential to probe the SBC scenario.
While the signal is at a few fb level, the main background, which originates essentially from quasi-real photons emitted by electron and positron at very low scattering angles, , is about 4.5 pb at 500 GeV ILC. Another significant background of similar topological properties is the di-jet background from which has about 2.7 pb production cross section as well as , where represents other quarks misidentified as . One of the powerful variables, which could suppress such dominant backgrounds, is the b-jet separation variable , where and is the difference of jet azimuthal angles and rapidities, respectively. In the case of backgrounds with two back-to-back b-jets while in the case of signal, which has also two neutralinos in the final state together with two b-jets, can be well below . This is illustrated in Figure 8.
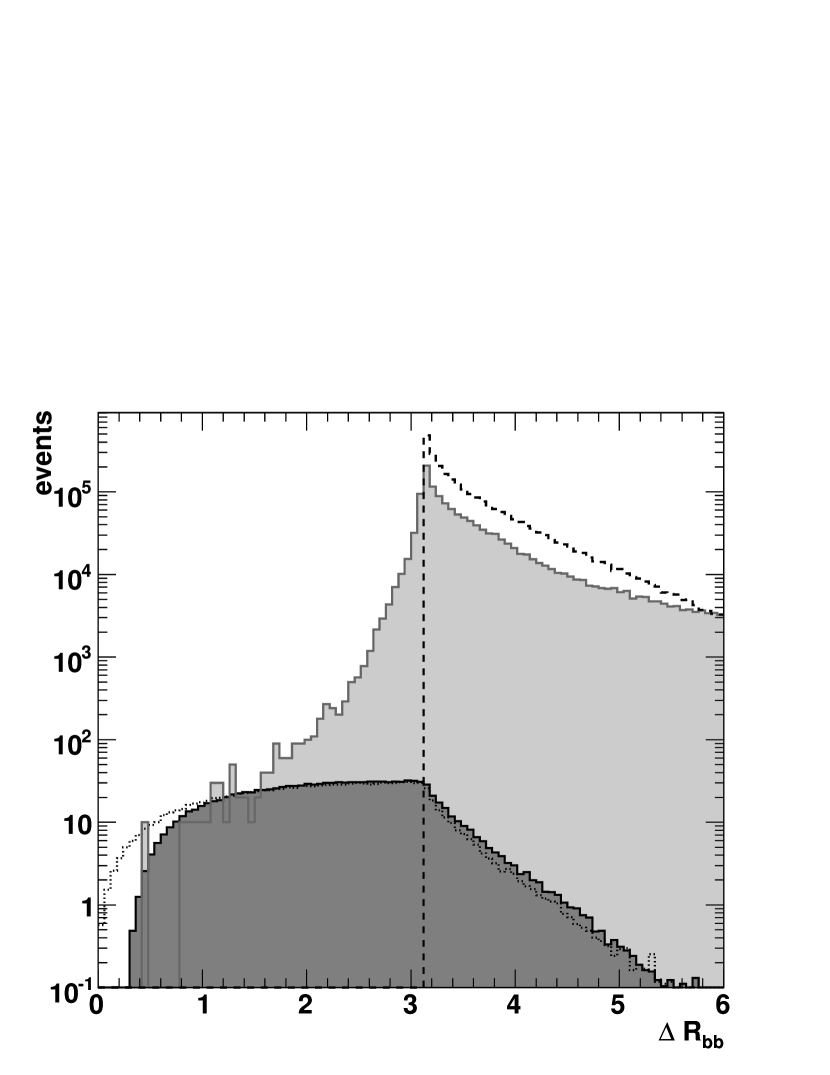
Though the parton level distribution for signal versus background looks very promising and suggests to eliminate the and backgrounds completely by setting cut, the situation is not that optimistic at the full detector simulation level: distribution from and processes can ”leak” into region due to detector resolution and event reconstruction effects. The realistic distribution after the full detector simulation is shown as filled histograms in Figure 8.
Complete sets of unbiased Standard Model processes at 500 GeV were generated using the Whizard Monte Carlo program Kilian et al. (2007) with a total statistics of about 7M events. All 0, 2, 4 and 6 fermion final states were generated, see SiD Collaboration (2009); SiD for details. PYTHIA Sjostrand et al. (2006) was used for final state QED and QCD parton showering, fragmentation and decay to provide final-state observable particles. Included in this sample are backgrounds arising from interactions between virtual and beamstrahlung photons. Both signal and background samples are considered un-polarised. The detector simulation is based on Geant 4 toolkit Agostinelli et al. (2003); Allison et al. (2006). A thin layer of Linear Collider specific code, SLIC sli , provides access to the Monte Carlo events, the detector geometry and the output of the detector hits.
III.3 Analysis and Results
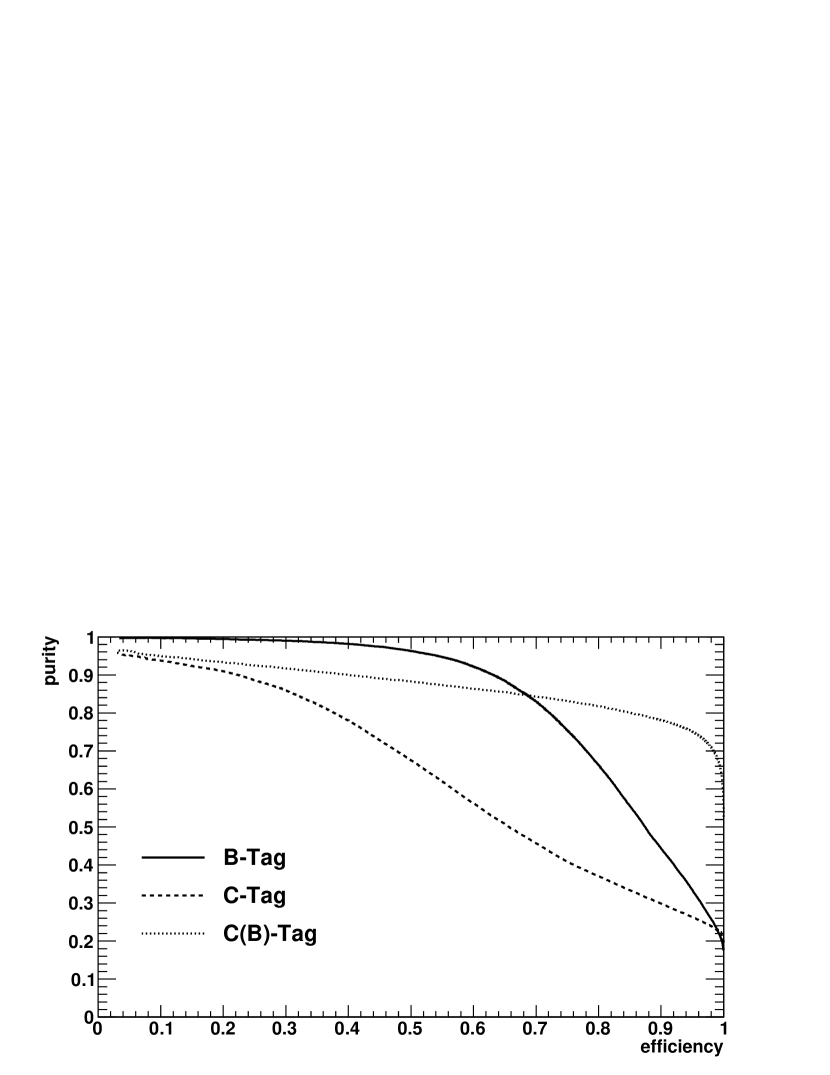
The vertexing package used for the jet flavour tagging in this analysis was developed by the LCFI collaboration Bailey et al. (2009). The main algorithm of the package, the topological vertex finder ZVTOP, reconstructs vertices in arbitrary multi-prong topologies. It combines relevant variables in neural networks which are then separately trained on samples of b-, c- and light quarks. The most discriminating variables are the corrected vertex mass, the joint probability, the secondary vertex probability, the impact parameter significance of the most significant track and number of vertices in the event. The joint probability is defined as the probability for all tracks in a jet to be compatible with hypothesis that they originate at the primary vertex. The performance of the LCFI package optimised for the SiD detector is shown in Figure 9 which shows the flavour tagging purity as a function of efficiency for the provided three tags.
The SiD specific optimisation was performed by building new neural networks and training them using di-jet samples which passed through the full SiD simulation and reconstruction.
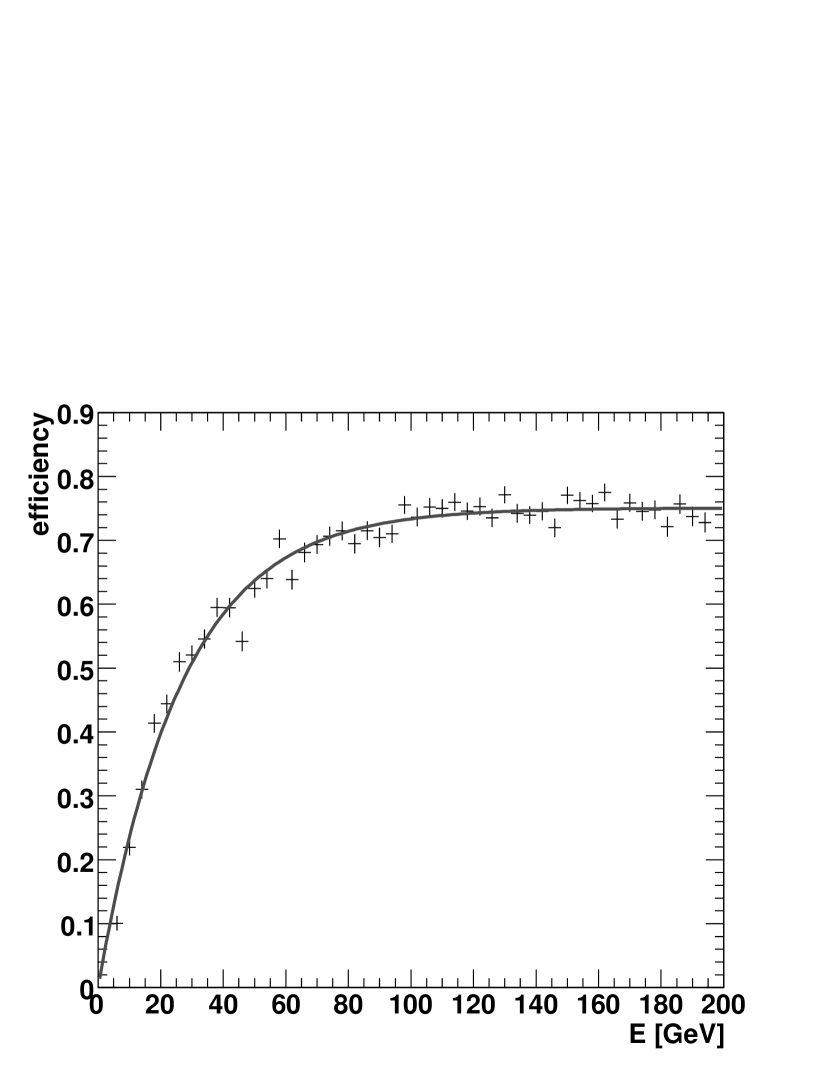
Observation of the sbottom production is challenging due to a very low energy of b-jets, below 20-30 GeV, which pushes the jet clustering and tagging algorithms to their limits. Figure 10 illustrates that while the b-tagging efficiency is about 75% above 60 GeV, it is falling steeply for lower jet energies. The energy of b-quarks is determined by the mass difference between and .
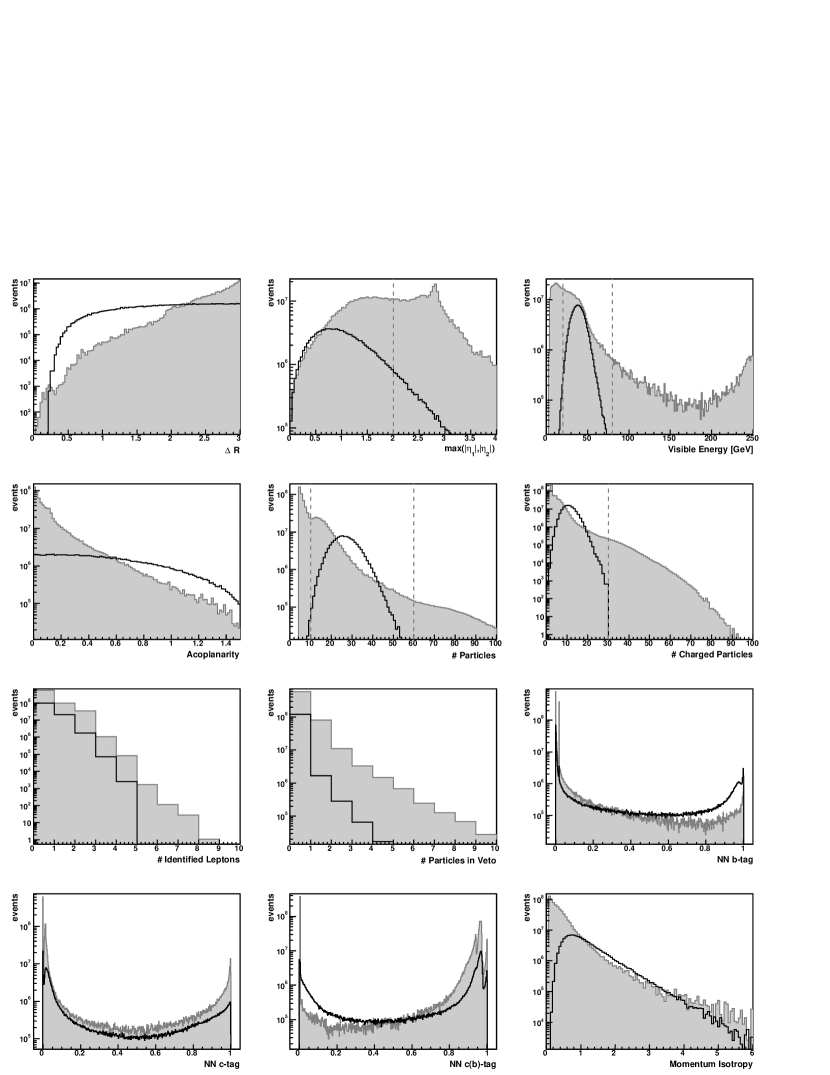
Jets were reconstructed by employing the Durham algorithm with GeV and limiting the maximum number of jets to two. Figure 11 shows distributions of several variables used in the analysis for the signal with GeV and GeV and compares them to the inclusive SM background. The signal was scaled up by a factor of for the presentation purposes. The variables are (from top-left): distance between jets in plane, maximum of jet rapidities , visible energy, acoplanarity, number of particles in event, number of charged particles, number of identified leptons, number of particles in the forward calorimeter used for veto, neural nets outputs of jets for b-tag, c-tag, c(b)-tag and the momentum isotropy.
Majority of the SM background, for the exception of the two-photon background, is suppressed by the GeV selection. The signal events are misbalanced in energy due to the neutralinos. The dominant two-photon and backgrounds produce jets in a back-to-back topology motivating the selection. To further suppress the background is required, where and are jet pseudorapidities. Finally, the total number of reconstructed particles in an event is required to be within for the mass point (230,210) and it is adjusted for the other mass points individually.
An important ingredient in this analysis is an electromagnetic veto using the forward detector at very low polar angles, above mrad. This is used to suppress the two-photon background as well as other backgrounds with a large ISR contribution. The forward detector acceptance was estimated using a simple geometrical model. If a photon or electron with MeV is detected within the acceptance the event veto is applied.
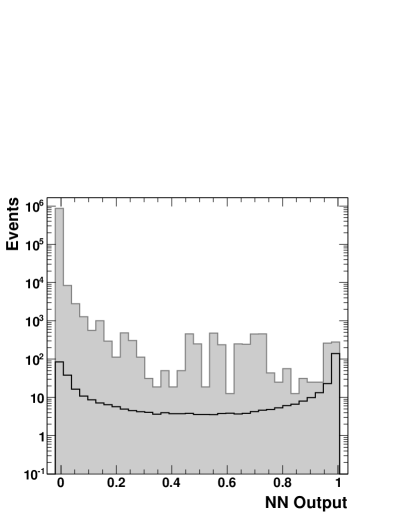
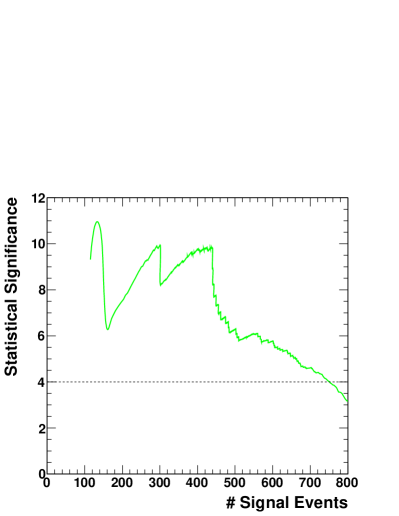
For the final event selection a FANN neural network fan based on the above variables was defined and trained on independent signal and background samples. The resulting neural net output is shown in the left plot of Figure 12. The result is interpreted in terms of signal significance calculated as , where is the number of selected signal events and the number of selected background events. The event numbers are normalised to the total luminosity of fb-1. Figure 12 shows a distribution of as a function of the number of selected signal events with each bin corresponding to a particular selection of the final cut on the neural net classifier output. Big variations are caused by the background events with large weights. The large weights were used for some SM processes with large cross sections.
Based on the above the signal cross section statistical uncertainty was calculated to be equal to 15 % for the (230,210) mass point. The mass points (240, 210); (220,210); (240,220) all can be observed with 3 statistical significance and the mass point (230,220) with 2 statistical significance. A conservative estimate of the 3 observation region is shown in Figure 13.
IV Summary
We have performed analysis of ILC potential to probe a sbottom co-annihilation (SBC) scenario. We have found that if the SBC scenario is confirmed at the ILC, this would be an indication of related non-minimal sfermion non-universality scenario at the GUT scale reflecting non-trivial D-term contributions to soft scalar masses. This would give a hint about the gauge group content at very high energies.
The probe of SBC scenario is very challenging even at the ILC due to the fact that background is higher than the signal by several orders of magnitude. One should stress, that the realistic detector simulation and reconstruction is crucial for this study due to the important role of resolution effects.
Using neural network analysis with the optimised input variables we conclude that the SBC scenario can be probed very close to the ILC kinematic limits and, in the case of discovery, the sbottom production cross section can be measured with a reasonable statistical precision. Such a measurement, however, relies on a presence of the forward detector used to veto two-photon background events and soft di-jet events with a dominant ISR contribution.
The approximate reach of the 500 GeV ILC extends to within 10 GeV to the kinematic limit for the sbottom pair production and within 5 GeV to the kinematic limit of the sbottom decay to LSP and b-quark.
Acknowledgements.
We would like to thank the SiD software and benchmarking groups and LCFI collaboration, in particular Jan Strube, Tim Barklow, Norman Graf and Márija Kováčevic̀ for assistance with sample processing and useful discussions. A.B. is grateful for the hospitality of GGI Institute where the final version of the paper has been prepared.References
- Golfand and Likhtman (1971) Y. A. Golfand and E. P. Likhtman, JETP Lett. 13, 323 (1971).
- Ramond (1971) P. Ramond, Phys. Rev. D3, 2415 (1971).
- Neveu and Schwarz (1971) A. Neveu and J. H. Schwarz, Phys. Rev. D4, 1109 (1971).
- Volkov and Akulov (1973) D. V. Volkov and V. P. Akulov, Phys. Lett. B46, 109 (1973).
- Wess and Zumino (1974) J. Wess and B. Zumino, Nucl. Phys. B70, 39 (1974).
- Haag et al. (1975) R. Haag, J. T. Lopuszanski, and M. Sohnius, Nucl. Phys. B88, 257 (1975).
- Fukugita and Yanagida (1986) M. Fukugita and T. Yanagida, Phys. Lett. B174, 45 (1986).
- Giudice (1992) G. F. Giudice, Phys. Rev. D45, 3177 (1992).
- Carena et al. (1997) M. Carena, M. Quiros, A. Riotto, I. Vilja, and C. E. M. Wagner, Nucl. Phys. B503, 387 (1997), eprint hep-ph/9702409.
- Freedman and Turner (2003) W. L. Freedman and M. S. Turner, Rev. Mod. Phys. 75, 1433 (2003), eprint astro-ph/0308418.
- Lahanas et al. (2003) A. B. Lahanas, N. E. Mavromatos, and D. V. Nanopoulos, Int. J. Mod. Phys. D12, 1529 (2003), eprint hep-ph/0308251.
- Spergel et al. (2007) D. N. Spergel et al. (WMAP), Astrophys. J. Suppl. 170, 377 (2007), eprint astro-ph/0603449.
- Chamseddine et al. (1982) A. H. Chamseddine, R. Arnowitt, and P. Nath, Phys. Rev. Lett. 49, 970 (1982).
- Barbieri et al. (1982) R. Barbieri, S. Ferrara, and C. A. Savoy, Phys. Lett. B119, 343 (1982).
- Ohta (1983) N. Ohta, Prog. Theor. Phys. 70, 542 (1983).
- Hall et al. (1983) L. J. Hall, J. D. Lykken, and S. Weinberg, Phys. Rev. D27, 2359 (1983).
- Ellis et al. (1998) J. R. Ellis, T. Falk, and K. A. Olive, Phys. Lett. B444, 367 (1998), eprint hep-ph/9810360.
- Ellis et al. (2000) J. R. Ellis, T. Falk, G. Ganis, and K. A. Olive, Phys. Rev. D62, 075010 (2000), eprint hep-ph/0004169.
- Chan et al. (1998) K. L. Chan, U. Chattopadhyay, and P. Nath, Phys. Rev. D58, 096004 (1998), eprint hep-ph/9710473.
- Feng et al. (2000) J. L. Feng, K. T. Matchev, and T. Moroi, Phys. Rev. D61, 075005 (2000), eprint hep-ph/9909334.
- Baer et al. (1996) H. Baer, C.-h. Chen, F. Paige, and X. Tata, Phys. Rev. D53, 6241 (1996), eprint hep-ph/9512383.
- Baer et al. (1995) H. Baer, C.-h. Chen, F. Paige, and X. Tata, Phys. Rev. D52, 2746 (1995), eprint hep-ph/9503271.
- Drees and Nojiri (1993) M. Drees and M. M. Nojiri, Phys. Rev. D47, 376 (1993), eprint hep-ph/9207234.
- Baer and Brhlik (1996) H. Baer and M. Brhlik, Phys. Rev. D53, 597 (1996), eprint hep-ph/9508321.
- Baer and Brhlik (1998) H. Baer and M. Brhlik, Phys. Rev. D57, 567 (1998), eprint hep-ph/9706509.
- Baer et al. (2001) H. Baer et al., Phys. Rev. D63, 015007 (2001), eprint hep-ph/0005027.
- Ellis et al. (2001) J. R. Ellis, T. Falk, G. Ganis, K. A. Olive, and M. Srednicki, Phys. Lett. B510, 236 (2001), eprint hep-ph/0102098.
- Roszkowski et al. (2001) L. Roszkowski, R. Ruiz de Austri, and T. Nihei, JHEP 08, 024 (2001), eprint hep-ph/0106334.
- Baer et al. (2003a) H. Baer, C. Balazs, A. Belyaev, T. Krupovnickas, and X. Tata, JHEP 06, 054 (2003a), eprint hep-ph/0304303.
- Baer et al. (2003b) H. Baer, C. Balazs, A. Belyaev, and J. O’Farrill, JCAP 0309, 007 (2003b), eprint hep-ph/0305191.
- Baer et al. (2004) H. Baer, A. Belyaev, T. Krupovnickas, and J. O’Farrill, JCAP 0408, 005 (2004), eprint hep-ph/0405210.
- Baer et al. (1999) H. Baer, P. G. Mercadante, and X. Tata, Phys. Rev. D59, 015010 (1999), eprint hep-ph/9808361.
- Demina et al. (2000) R. Demina, J. D. Lykken, K. T. Matchev, and A. Nomerotski, Phys. Rev. D62, 035011 (2000), eprint hep-ph/9910275.
- Baer et al. (2008) H. Baer, A. Mustafayev, E.-K. Park, and X. Tata, JHEP 05, 058 (2008), eprint 0802.3384.
- Pallis (2004) C. Pallis, Nucl. Phys. B678, 398 (2004), eprint hep-ph/0304047.
- Profumo (2003) S. Profumo, Phys. Rev. D68, 015006 (2003), eprint hep-ph/0304071.
- Paige et al. (2003) F. E. Paige, S. D. Protopescu, H. Baer, and X. Tata (2003), hep-ph/0312045.
- Kolda and Martin (1996) C. F. Kolda and S. P. Martin, Phys. Rev. D53, 3871 (1996), eprint hep-ph/9503445.
- SiD Collaboration (2009) SiD Collaboration, SiD Letter of Intent (2009), URL http://silicondetector.org/display/SiD/LOI.
- Pukhov (2004) A. Pukhov (2004), eprint hep-ph/0412191.
- Boos et al. (2001) E. Boos et al. (2001), in proceedings of the Workshop on Physics at TeV Colliders, Les Houches, France, 21 May - 1 June 2001 [hep-ph/0109068].
- Sjostrand et al. (2006) T. Sjostrand, P. Skands, and S. Mrenna, Pythia 6.4: Physics and manual (2006), eprint hep-ph/0603175.
- Kilian et al. (2007) W. Kilian, T. Ohl, and J. Reuter (2007), eprint arXiv:0708.4233.
- (44) URL http://silicondetector.org/display/ilc/Standard+Model+Data+Samp%les.
- Agostinelli et al. (2003) S. Agostinelli et al., Nuclear Instruments and Methods in Physics Research A 506, 250 (2003).
- Allison et al. (2006) J. Allison et al., IEEE Transactions on Nuclear Science 53 No. 1 pp. 270–278 (2006).
- (47) URL http://www.lcsim.org/software/slic/doxygen/html/.
- Bailey et al. (2009) A. Bailey et al., Nucl. Instrum. Meth. A610, 573 (2009), eprint arXiv.org:0908.3019.
- (49) Fast Artificial Neural Network library (FANN), http://leenissen.dk/fann/.