Mass dependence of onset of multifragmentation in low energy heavy-ion collisions
Abstract
Based on the quantum molecular dynamics (QMD) picture, we calculate the energy and mass dependence of fragment production. For the present study, we simulated the reactions of , , , , and at central geometry. Our findings clearly show a linear mass dependence for the peak center-of-mass energy at which the maximal IMF production occurs. Such linear dependence for peak center-of-mass energy on the system size has also been observed in recent experimental studies. We also predict a similar behavior for the multiplicities of different kinds of fragments. Experiments are called for to verify this prediction.
Keywords: heavy-ion collisions, multifragmentation, quantum molecular dynamics (QMD) model.
1 Introduction
The central heavy-ion (HI) collisions have been reported to result into a complete disassembly of nuclear matter at bombarding energies above 100 MeV/nucleon. This disassembly of hot and dense nuclear matter also commonly known as the onset of multifragmentation, is found to occur when nuclear density drops to less than half of its initial value [1]. In the low density phase, the onset of multifragmentation is expected to occur due to Coulomb instabilities. It is well known that the mean multiplicity of intermediate mass fragments depends strongly on the bombarding energy as well as on the impact parameter of the reaction. Leray et al. [1] studied the fragment distribution for the reaction of O+AgBr near the point of threshold multifragmentation and reported the onset of multifragmentation around 150 MeV/nucleon. Earlier, Peilert et al. [2] have shown that the true multifragmentation events were confined to central collisions only. In their study, reaction was simulated at incident energies between 30 and 200 MeV/nucleon. In central collisions of , one observes the maximal multiplicity around 100 MeV/nucelon. More recently, an extensive and exhaustive study by Puri et al. [3] reported the outcome of reaction over incident energies between 20 and 1000 MeV/nucleon and over the entire impact parameter range. This study indicated the generation of events from incomplete fusion-fission to multifragment emission and finally complete disassembly of the nuclear matter. They observed a peak in the fragment production around 60 MeV/nucleon in the central collisions. Interestingly enough, a rise and fall in the multiplicity with impact parameter was not observed for low incident energies (20-40 MeV/nucleon). The existence of peak energy for maximal IMF emission was in accordance with an earlier study by Peilert et al. [2] using Au nuclei. The multifragmentation, therefore, exhibits a complex picture which is quite sensitive to the entrance channel characteristics i.e., to the impact parameter, beam energy as well as to the total mass of the target and projectile [1, 4, 5, 6, 7, 8]. The beam energy dependence of IMF emission was recently analyzed by Sisan et al. [9] using MSU 4-Array set up. In their study, emission of intermediate mass fragments was reported for the central collisions of , and . They predicted a rise and fall in the emission of IMFs with beam energy and observed a linear peak energy dependence on the size of the system. The percolation calculations used in the above study, however, could not fully explain this dependence. This led to the conclusion by Sisan et al. that perhaps phase space models can explain this observation [9]. We plan to address this situation by employing a dynamical model, where one can follow the reaction dynamics from the start to the end where matter is cold and fragmented. Our present study employs microscopic quantum molecular dynamics (QMD) model [10, 11] which is described in section 2. Section 3 is devoted to model calculations and results, which are finally concluded in section 4.
2 Description of the model
The quantum molecular dynamics (QMD) model is a time dependent A-body theory which is able to describe the many body phenomenon like fragment formation. Here each nucleon in phase space is represented by a Gaussian wave packet of the form:
| (1) |
Mean position and mean momentum are the two time dependent parameters. The Gaussian width is centered around the mean position and mean momentum and is same for all nucleons. This value of corresponds to a root-mean-square radius of each nucleon. The effect of different Gaussian width in fragmentation is reported in reference [12]. The centroids of Gaussian wave packets , in phase space follow the Hamilton’s equations of motion [10, 11]:
| (2) |
In the above equations, stands for the total Hamiltonian of the system, which consists of kinetic and potential energy terms:
| (3) |
and being the target and projectile masses. The nucleon-nucleon interaction in (3) consists of a local Skyrme interaction, a long-range Yukawa interaction and an effective charge Coulomb interaction parts [10, 11]:
| (4) | |||||
, are the effective charge of baryons i and j. In QMD model, one neglects the isospin dependence of the interaction. All nucleons in a nucleus are assigned the effective charge [11]. The long-range Yukawa force is necessary to improve the surface properties of the interaction. The parameters in (4) are adjusted and fitted so as to achieve the correct binding energy and mean square root values of the radius of the nucleus [10]. Since QMD model follows the time evolution of nucleons only, one has to construct the fragments. In a simplest approach, two nucleons are assumed to share the same cluster if they are closer than a distance of 4 fm. This method, also known as minimum spanning tree (MST), can be applied when matter is dilute and well separated. This picture is true when incident energy is high and collisions are central in nature. One has to also keep in the mind that semi-classical models like QMD can not keep nuclei stable for long time. A typical stability of nuclei can be seen untill 200 fm/c. If one analyzes the fragment formation with MST alone, then one may not achieve true fragment structure at 200 fm/c. To speed up the recognition of fragment structure, we add secondary condition that fragments produced with MST method are subjected to further binding energy check:
| (5) |
We take = -4.0 MeV/nucleon if and otherwise. In this equation, is the number of nucleons in a fragment, is the center-of-mass momentum of the fragment. This modified version of conventional MST method with binding energy check is labeled as MSTB method. The magnitude -4.0 MeV/nucleon of is able to recognize the fragment structure quite accurately. It is chosen keeping in the mind the average binding energy of clusters. In a recent communication [13], we used instead microscopic binding energies based on experimental information. Nearly no effect was seen by varying the binding energy. We have shown in many calculations that this check is close to other momentum cuts [14, 15, 16, 17] or sophisticated algorithms like simulated annealing clusterization algorithm [18, 19, 20].
We employ a soft equation of state (EoS) along with Cugnon parametrization of n-n cross section for the present study [10]. The choice of soft EoS has been advocated in many theoretical studies. Recently, Magestro et al. [21] tried to pin down the nuclear incompressibility using balance energy. Their detailed study pointed towards a softer equation of state. Another study concerning the linear momentum transfer occuring in central HI collisions [22] also showed that a soft compressibility modulus is needed to explain the experimental data.
3 Results and Discussion
Here, we simulate the central heavy-ion collisions of (=10 to 55 AMeV), (=35 to 115 AMeV), (=35 to 95 AMeV) and (=35 to 95 AMeV), (=45 to 130 AMeV) and (=70 to 130 AMeV). The systematic study over a wide range of beam energies and system masses allows one to confront the theoretical predictions with experimental findings and search for the mass dependence. Note that only symmetric reactions are taken for present analysis. Our calculations are performed at fixed impact parameter b= 0 fm. We calculate the reaction at fixed incident energies and then calculate corresponding center of mass energy. For each such set, 500 events were simulated that minimizes the fluctuations to greater extent. The choice of central collisions for the present study guarantees the formation of highly excited systems that may break into a large number of pieces. Further, the emission from such events is almost isotropic, which may represent a ‘single source’ emission.
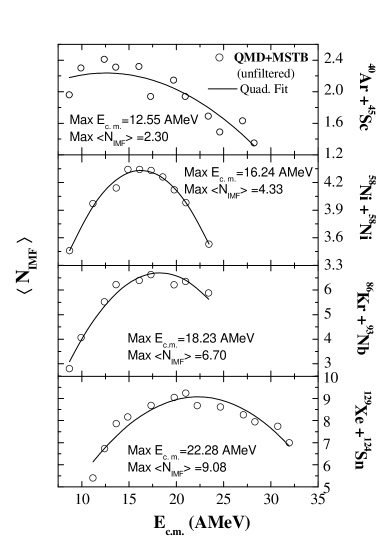
In figure 1, we display the average multiplicity of intermediate mass fragments calculated as a function of beam energy in the center-of-mass frame employing MSTB method. We display here the model calculations for unfiltered events of four entrance channels , , and . The first increases with beam energy, reaches a peak value and then decreases. This trend is visible in all of the four entrance channels shown here. This trend is less clear for the lighter system whereas it is more clearly visible for the heavier systems. A similar dependence of on center of mass energy is also observed in experimental data taken with the MSU 4-Array [9]. This behavior can be understood in terms of compression energy of the system. With the rise in the beam energy, compression energy breaks the IMFs into lighter mass fragments thereby, leading to fall in the multiplicity of IMFs. The maximal and corresponding peak was obtained through a quadratic fit to the model calculations. One should also note that the shape of the beam energy dependence of IMF production is quite close to one reported in the experimental data [9]. As reported by Sisan et al. [9], the peak extracted for different entrance channels scales with the size of the system. Such scaling is also visible in our present calculations (see Fig. 1).
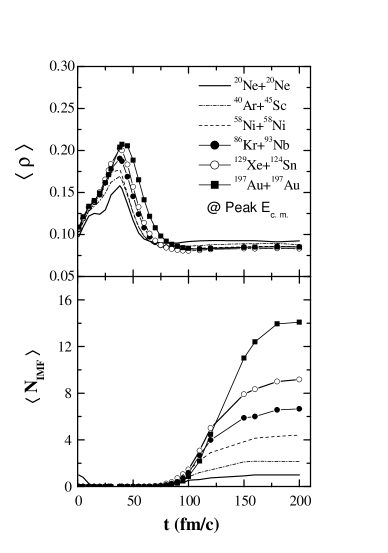
In figure 2, we display the time evolution of average density along with the mean multiplicity of intermediate mass fragments defined as fragments plotted at the peak center-of-mass energy (at which maximal IMF emission occurs). We now include and systems also for the study of system size effects. The average nucleonic density of the system is calculated as:
| (6) |
with and being the position coordinates of the and nucleons. The Gaussian width L is fixed with a standard value of . As expected, the average nucleonic density has a mass dependence, being maximal for the system and minimal for the system. This also indicates a linear density dependence on the system size. The intermediate mass fragments also show similar mass dependence. One can also notice that fragment production almost saturates around 200 fm/c. In other words, time span of 200 fm/c is large enough to pin down the fragment structure. The maximal fragment production is for system whereas system results in minimum value. It may be mentioned that IMF multiplicities obtained in and collisions exclude the largest and second largest fragment respectively to infer the system size dependence accurately.
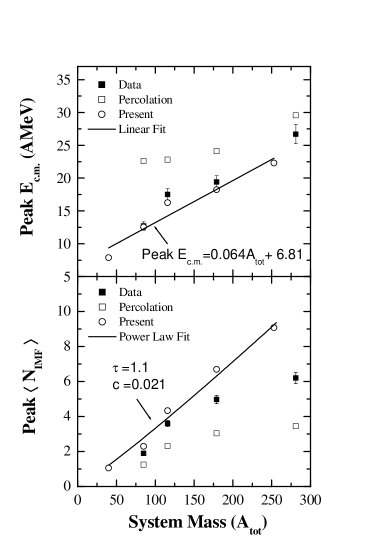
We plot in figure 3, the peak as well as peak as a function of total mass of the system . Strikingly, our model calculations employing MSTB approach are in good agreement with the experimental data (solid squares) of MSU 4-Array for peak . For peak , some deviation can be seen for heavier masses. This could also be due to the fact that our calculations are not filtered for experimental acceptance.
One can also see that the predictions of percolation model fail to explain the sharp dependence of peak on system mass. Our present results show a linear mass dependence of the form: for the peak . These observations suggest that the peak , thus, acts as a measure of finite size effect. It is worth mentioning that the critical excitation energy was estimated from the cluster size distribution fitted to power law: at different beam energies for which the exponent reaches a minimum. Based on the percolation calculations, the critical excitation energy is also found to increase when initial lattice size increases [7]. Interestingly, the mass scaling of peak can be reproduced with a power law: with exponent close to unity.
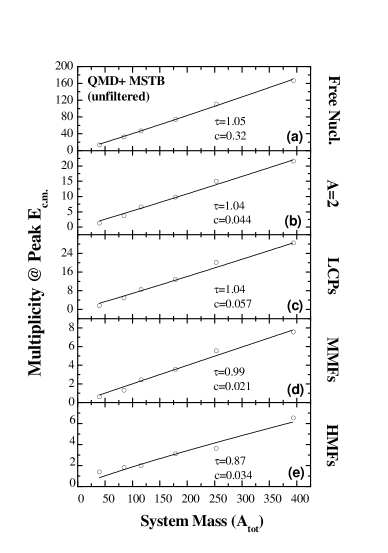
In figure 4, we finally extend the above study for various fragments consisting of free nucleons, fragments with mass A=2, light charged particles LCPs , medium mass fragments MMFs as well as heavy mass fragments HMFs . Interestingly, in all the above cases, a clear system size dependence can be seen in a manner similar to dependence. We observe a power law of the form ; is mass of the composite. In all the cases, parameter is very close to unity. As noted in [9], the percolation model failed badly to reproduce the power law dependence. A linear mass dependence observed with value of depicts the picture of vanishing surface-Coulomb effects. Experiments are called for to verify this new prediction.
4 Summary
We aimed to reveal the dependence of IMF production on beam energy
and system size. This was achieved by a study over wide range of
system masses and incident energies. Our present results reproduce
the experimental trend of both rise and fall in with beam energy. At the point of onset of
multifragmentation, we obtained the scaling of peak
with system mass. The observed trend of peak center of mass energy
is in agreement with previous experimental studies [7, 9, 23, 24, 25, 26]. The behavior of average nucleon density as
well as IMF multiplicity at the point of onset of
multifragmentation for different entrance channels also reflect
the dominance of system size effects. Our calculations also
reproduce a power law of the form ;
being the total mass of the system. We predict a similar power law
dependence for the fragments of different sizes at the energy for
peak IMF emission.
Interestingly, as observed experimentally, the exponent is close to unity in all cases.
This work is supported by CSIR, Government of India vide grant no. 7167/NS-EMR-II/2006, India.
References
- [1] Leray S, Ng C, Bouissou P, Remaud B. and Sbille F 1991 Nucl .Phys. A 531 177
- [2] Peilert G, Stöcker H, Greiner W, Rosenhauer A, Bohnet A and Aichelin J 1989 Phys. Rev. C 39 1402
- [3] Puri R K and Kumar S 1998 Phys. Rev.C 57 2744
- [4] Williams C et al 1997 Phys. Rev. C 55 R2132
- [5] Begemann-Blaich M et al 1993 Phys. Rev. C 48 610
- [6] Beaulieu L et al 1996 Phys. Rev. C 54 R973
- [7] Li T et al 1994 Phys. Rev. C 49 1630
- [8] Li T et al 1993 Phys. Rev. Lett. 70 1924
- [9] Sisan D et al 2001 Phys. Rev. C 63 027602
- [10] Aichelin J 1985 Phys. Rep. 202 233
- [11] Hartnack Ch, Puri R K, Aichelin J, Konopka J, Bass S A, Stöcker H and Greiner W 1998 Eur. Phys. J. A 1 151
- [12] Singh J and Puri R K 2000 Phys. Rev.C 62 054602
- [13] Vermani Y K, Dhawan J K, Goyal S and Puri R K 2009 J. Phys. G -communicated
- [14] Kumar S and Puri R K 1998 Phys. Rev.C 58 320
- [15] Kumar S and Puri R K 1998 Phys. Rev.C 58 2858
- [16] Singh J and Puri R K 2001 J. Phys. G27 2091
- [17] Dhawan J K and Puri R K 2007 Eur. Phys. J. A 33 57
- [18] Puri R K, Hartnack C and Aichelin J 1996 Phys. Rev.54 R28; Nebauer R, Guertin A, Puri R K, Hartnack C, Gossiaux P B and Aichelin J 1999 Proc. Int. Wrks. on Gross Properties of Nuclei and Nuclear Excitations (Hirschegg Austria) Vol 27 ed by H. Feldmeier et al (Darmstadt:GSI) p 43
- [19] Puri R K and Aichelin J 2000 J. Comput. Phys. 162 245
- [20] Dhawan J K and Puri R K 2007 Phys. Rev. C 75 057601
- [21] Magestro D J, Bauer W and Westfall G D 2000 Phys. Rev. C 62 041603(R)
- [22] Haddad F et al 1996 Phys. Rev.C 53 1437
- [23] Stone N T B, Llope W J and Westfall G D 1995 Phys. Rev. C 51 3157
- [24] Llope W J et al 1995 Phys. Rev.C 51 1325
- [25] Jakobsson B et al 1990 Nucl .Phys.A 509 195
- [26] Ogilvie C A et al 1991 Phys. Rev. Lett.67 1214