Iron line emission from X-ray pulsars: physical conditions and geometry of the system
Abstract:
We present here the preliminary results of the study of the fluorescent iron line emission from X-ray pulsars with Be companions. We propose to use properties of this emission to investigate the spatial distribution and physical conditions of the matter around the compact object as well as in the binary system as a whole. Using data of the RXTE observatory the iron line behavior in the transient X-ray pulsar V 0332+53 spectrum was studied during the powerful type II outburst in 20042005. Particularly, we investigated a variability of the iron line equivalent width on different time scales (pulse period, orbital period, outburst phase) and searched for its correlation with the continuum flux, spectral parameters, etc.
1 Introduction
The fluorescent 6.4 keV iron line is broadly detected in spectra of different types of astrophysical objects. Its properties were described theoretically for different geometries of an emitting/reprocessing system (e.g. [1],[2],[3] and references therein). And it was shown that this spectral feature can be a powerful instrument for the study of the spatial distribution and state of the matter around X-ray sources.
The distribution of matter and its state are crucial components for the understanding of the mechanism of giant (type II) outbursts, observed from X-ray transient pulsars with Be optical companions. Type II X-ray outbursts ( erg s-1) last several weeks or even months and are not correlated with any particular orbital phase ([4] and references therein). Despite of many years of observations the exact mechanism of such events as well as the origin and distribution of the matter in the system to be accreted onto the compact object in each particular moment are still unclear. On the other side a very promising property of such sources is a wide range of observed luminosities and hence the possibility to investigate a response of the system (particularly, changes in the geometry) on different accretion rates. It is important to note that such transient systems are usually too bright to be investigated with grazing-incidence X-ray telescopes. But, fortunately, a large amount of high quality data collected up to day from the RXTE observatory gives us a possibility to trace the evolution of the fluorescent iron line emission on different time scales (pulse period, orbital period, outburst phase) in Be-NS transient systems and to try to answer to above mentioned questions.
In this report we present preliminary results of such a study of the very bright transient X-ray pulsar V 0332+53 during the 2004-2005 outburst. V 0332+53 is a classical transient X-ray pulsar with Be companion. The main system parameters are as follows: the pulse period s, the orbital period – days, the eccentricity – 0.37, and the projected semimajor axis of the neutron star – sin lt-s ([5, 6]). Detailed analysis of this and other bright transient pulsars will be published in a forthcoming paper (Tsygankov et al., in preparation).
2 Observations and data analysis
In the following analysis we used data from the PCA spectrometer onboard the RXTE observatory [7] (a list of pointings IDs can be found in our previous papers [8],[9]). The PCA spectrometer is a system of five proportional xenon/propane counters with an effective area of about 6400 cm2 and an energy resolution of 18% at 6–7 keV. Despite of the moderate energy resolution this instrument has a great advantage due to its large effective area and high temporal resolution, which are of great importance for the investigation of the variability of continuum and iron line fluxes on short time scales (see below). Moreover, it gives us a possibility to apply the potential of the reverberation mapping method, proposed in AGNs studies ([10] and references therein), to investigate the distribution of a cold matter around neutron stars. For the data reduction we used standard programs of the FTOOLS/LHEASOFT 6.7 package.
3 Results
3.1 Long-term variability
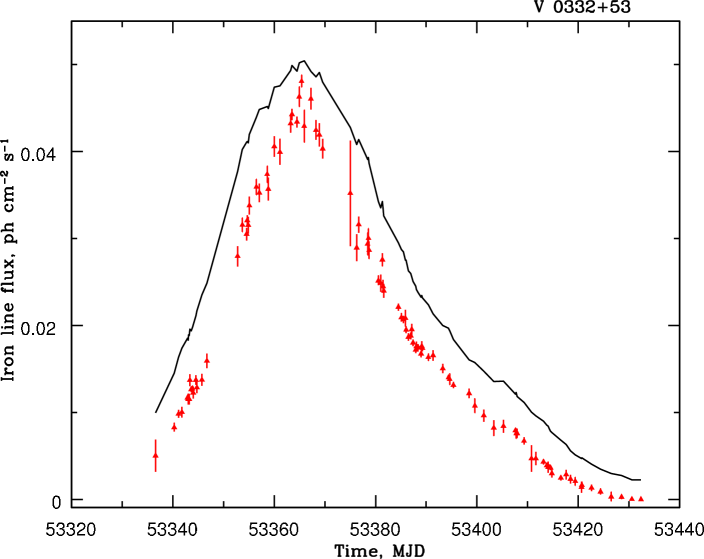
In Fig.1 the evolution of the iron line flux and the continuum one in the energy range of keV are presented. It is seen that observed variations of the iron line flux are mainly caused by variations of the continuum flux. An analysis of a behavior of the iron line equivalent width (EqW) can be significantly more informative because this quantity bear the impress of geometrical properties of the system (e.g. [1],[2],[3]) and doesn’t depends on the incoming flux.
As it was shown in [8],[9] the source spectrum in a wide energy band has a complex shape and has been described with a large number of parameters. Therefore to avoid a possible influence of other spectral parameters on the iron line ones we restricted here our consideration by a relatively narrow energy band (3-12 keV) of the PCA spectrometer, where the continuum emission can be well approximated by a simple power law model with an exponential cutoff. To describe the iron line emission we added to our model a Gaussian component. The line center and its normalization were left free for the fitting, but its width was fixed at keV. Nevertheless, the absolute value of the equivalent width, obtained from the spectral analysis, was still model dependent, that is connected with a moderate energy resolution and relatively high lower energy limit of the spectrometer (3 keV). Therefore below we will concentrated our attention to relative changes of EqW.
Note, that a variability of the intensity and equivalent width of the iron line was observed before for several X-ray pulsars on the long time scales (of the order of the orbital period). But these variations were caused mainly by changes of the density of the strong stellar wind around the compact object. In particular, Inoue [11] showed that the expected equivalent width of the iron Kα line is a linear function of the hydrogen column density and could be expressed as (for a spherical geometry and photon index of 1.1):
| (1) |
where is in units of cm-2.
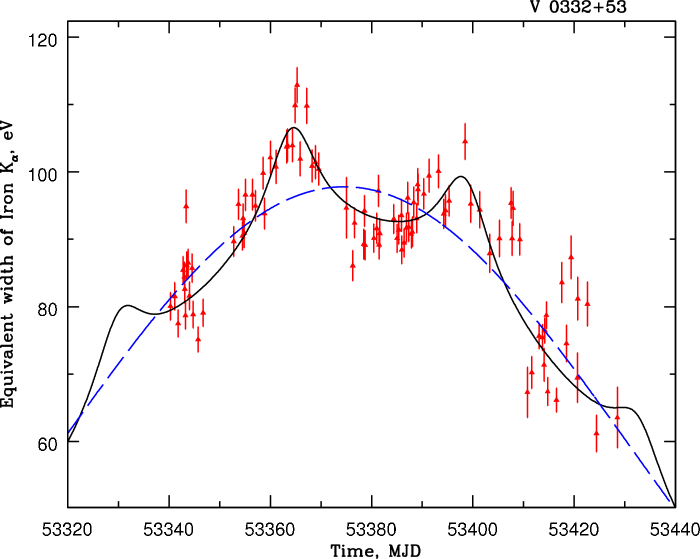
The equivalent width of the iron line, registered in the V 0332+53 spectrum, is shown as a function of time in Fig.2. Its value was changed from to eV during the outburst approximately in the same way as the source luminosity, whose rough approximation by the Gaussian law is presented by a dashed line in arbitrary units. If the observed value of EqW is due to the reprocessing in the surrounding stellar wind, then according to eq.1 a very high (about 1023 cm-2) value of the photoelectron absorption should be detected in the source spectrum. In fact we did not see any evidences of it at any level of the source luminosity.
One of the natural reprocessing site which is able to produce variations of the iron line parameters over the orbital cycle is the companion star atmosphere and circumstellar disk around it. Suggesting that the iron line equivalent width is proportional to the angular size of this disk seen from the compact object, we can estimate its geometrical size and trace its evolution with outburst and orbital phases (note, that the last one reflects the distance between components changing due to a significant eccentricity of the binary system). In general, changes of the equivalent width during outburst can be preliminary described by the convolution of the mentioned above Gaussian law with the inverse distance between components (solid line in Fig.2, T0 value was chosen arbitrarily). It is seen that data points are described more or less satisfactorily even by such a simple geometrical model.
It was shown by [2] that EqW is strongly affected by the photon index of the incident spectrum. During the outburst the source spectrum has been harder in low luminosity states and this fact should be also taken into account during the modelling.
3.2 Variability on the pulse period time scale
Pulsations in the iron Kα line were detected earlier from several X-ray pulsars (Vela X-1 [12], Her X-1 [13], etc.). Such pulsations naturally indicate that the distribution of the reprocessing matter is not completely spherically symmetric around the neutron star and some compact reprocessing regions in its vicinity should exist. By way of such a reprocessor it can be proposed a surface of the neutron star, accretion column, Alfvén shell, accretion wake or accretion disk, stellar wind and atmosphere of companion star, etc. In particular, measuring the delay of the iron line emission from the continuum component in the around energy band Kohmura et al. [14] have concluded that the reprocessing site in the X-ray pulsar Cen X-3 is the accreting matter along the magnetic field around the neutron star at the distance of cm.
We propose to apply the pulse-phase resolved spectroscopy and cross-correlation analysis methods to try to measure such a delay for V 0332+53 and answer to the question about a distribution of the matter in the system. A detailed description of the phase-resolved spectroscopy results over the whole outburst will be published in a separate paper (Lutovinov, Tsygankov, prepared for publication). Here we present only the evolution of iron 6.4 keV line parameters with the pulse phase.
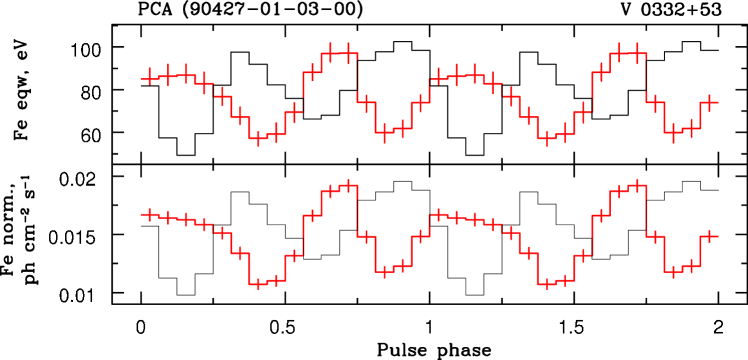
In Fig.3 the iron line equivalent width and normalization changes (red histograms) are presented in line with ones of the continuum flux (black histograms) over the pulse period during the RXTE observation 90427-01-03-00, when the source luminosity was erg s-1. It is clearly seen that both EqW and normalization are shifted relative to the pulse profile on about of 1.5 sec. Considering the measured time lag as a time-of-flight of the continuum photons from the source to the reprocessing site it is possible to estimate a distance between them as cm. This distance is about 2 orders of magnitude higher than the Alfvén surface radius and comparable with the outer size of the accretion disk.
Another possible explanation of the observed time lag is a phase lag (arising just due to a rotation of the neutron star). In this case the illuminating beam cuts the reprocessing site later than it cuts a direct line of the sight to the observer. Mentioned above cross-correlation analysis will help us to determine a real value of the distance between X-ray source and fluorescent matter.
Finally note that the pulsed fraction of the iron line emission during this observation was about 30%, that is significantly higher than its average value in the 3-20 keV energy range [9]. Such a high value of the iron emission pulsed fraction means that the reprocessing region size cannot be too large. On the contrary, in the case of GX 301-2 the local decrease of the pulsed emission at energies of 6-7 keV have been found by [15]. This fact can be easily explained by the reprocessing of the iron emission in a thick 4-surrounding stellar wind.
4 Conclusions
We found for the first time the correlation of the equivalent width of the fluorescent iron line with the orbital phase during a huge type II outburst from the transient X-ray pulsar V 0332+53.
Pulsations in the iron line were found in a wide range of the source luminosities, thus indicating a compact reprocessing site in the vicinity of the neutron star.
From the pulse phase resolved analysis we measured a time lag of sec between continuum and iron line fluxes, that corresponds to the reprocessing site at a distance of cm.
The significant increase of the pulsed fraction in the iron line emission in a comparison with the continuum one was found for the first time.
5 Acknowledgments
Authors thanks M.Revnivtsev and D.Klochkov for useful discussions. This work was partially supported by the Program “The origin, structure, and evolution of objects of the Universe” of the Russian Academy of Sciences and grant NSh-5069.2010.2 for support of leading scientific schools. We are grateful for the data to the HEASARC Online Service provided by the NASA/Goddard Space Flight Center.
References
- [1] Basko M.M., 1980, A&A, 87, 330
- [2] George I.M. & Fabian A.C., 1991, MNRAS, 249, 352
- [3] Leahy D.A. & Creighton J., 1993, MNRAS, 263, 314
- [4] Negueruela I., 1998, A&A, 338, 505
- [5] Stella L., White N.E., Davelaar J., et al., 1985, ApJ, 288, L45
- [6] Zhang S., Qu J.-L., Song L.-M., and Torres D., 2005, ApJ, 630, L65
- [7] Bradt H.V., Rothschild R.E., Swank J.H., 1993, A&AS, 97, 355
- [8] Tsygankov S., Lutovinov A., Churazov E., Sunyaev R., 2006, MNRAS, 371, 19
- [9] Tsygankov S., Lutovinov A., Serber A., 2010, MNRAS, 401, 1628
- [10] Reynolds C.S., Young A.J., Begelman M.C., Fabian A.C., 1999, ApJ, 514, 164
- [11] Inoue H., 1985, Space Sci. Rev., 40, 317
- [12] Choi C.S., Dotani T., Day C.S.R. and Nagase F., 1996, ApJ, 471, 447
- [13] Zane S., Ramsay G., Jimenes-Garate M.A., et al., 2004, MNRAS, 350, 506
- [14] Kohmura T., Kitamoto S. and Torii K., 2001, ApJ, 562, 943
- [15] Endo T., Ishida M., Masai K., et al., 2002, ApJ, 574, 879