Microscopic structure and dynamics of high and low density trans-1,2-dichloroethylene liquids
Abstract
We present a study of the dynamics and structural changes for trans-1,2-dichloroethylene between high and low density liquids using neutron scattering techniques (diffraction, small angle neutron scattering and time of flight spectroscopy) and molecular dynamics simulations. We show that changes in the short range ordering of molecules goes along with a change of the molecular dynamics: both structure and dynamics of the high density liquid are more cooperative than those of the low density liquid. The microscopic mechanism underlying the cooperative motions in the high density liquid has been found to be related to the backscattering of molecules due to a strong correlation of molecular ordering.
pacs:
64.70.Ja, 61.05.fm, 61.20.-p, 61.25.EmClassical thermodynamics establishes the existence of one unique liquid state for any material, i.e., there is only a liquid phases characterized by its density given the thermodybamic coordinates pressure and temperature. Nevertheless, recent experimental results and molecular dynamics (MD) simulations suggest that, even for one-component systems, several liquid phases can appear with an associated liquid-liquid phase transition (LLPT). A noticeable number of cases has been found for atomic liquids, the best-known example concerning liquid phosphorus Akahama et al. (1987); Kikegawa et al. (1987), where the LLPT appears as a transition between thermodynamically stable phases with strong structural changes Katayama et al. (2000). As far as molecular liquids are concerned, the number of experimental evidences for LLPT is still rather scarce and comprises only a limited number of compounds such as triphenyl phosphite Tanaka et al. (2004) and n-butanol Kurita and Tanaka (2005). According to the so called two order parameter theories that propose an explanation for the LLPT, liquids must be described not only by their density but also by an additional order parameter accounting for changes in the molecular arrangement Tanaka (1999, 2000); Franzese and Stanley (2007). The LLPT can end in a liquid-liquid critical point between a high-density liquid (HDL) and a low-density liquid (LDL). However, changes in the dynamics with an associated change in structural features can also be explained by a singularity-free scenario Kumar et al. (2008). In the latter case, changes in both dynamics and structure from a HDL to a LDL also take place at the point where the isobaric heat capacity has a maximum, but no critical point or LLPT are observed at non-zero temperature.
An early work on trans-1,2-dichloroethylene () suggested the existence of a LLPT at based on a small jump in density (less than 0.06%) as well as in the compressibility, and a clear discontinuity on the spin-lattice relaxation time Kawanishi et al. (1981, 1982). The observed changes in were tentatively related to a lack of freedom of the molecular rotation in the HDL, not present in the LDL. The change on the dynamics of this substance between both liquids, was thereafter also supported by discontinuities in the viscosity measurements and the slope of the rotational relaxation time Zegrodnik et al. (1989), and by the absorbance, frequency and linewidth of several infrared vibrational spectroscopy bands Merkel et al. (2008). Concerning structural related magnitudes, subsequent measurements of the density as a function of the temperature did not find a jump at the expected LLPT but only a change in its slope Zegrodnik et al. (1989). More recently, some of the authors of the present work have also undertaken calorimetric and nonlinear dielectric experiments Rzoska et al. (2008). In that work a strong pre-transitional anomaly of nonlinear dielectric effect was obtained, similar to the one observed in the isotropic phase of nematic liquid crystals, together with a maximum of . Therefore, experimental results unambiguously show a clear change in the dynamics, together with a slight change in the structure, between HDL and LDL, that takes place when is in a maximum. However, those facts are not enough to unambiguously determine if they are related to a singularity-free or a liquid-liquid critical point scenario Kumar et al. (2008), i.e., the liquid undergoes a first order phase transition. The present study is aimed to investigate the microscopic structural and dynamical differences between the HDL and LDL, from the experimental point of view and from MD simulations.
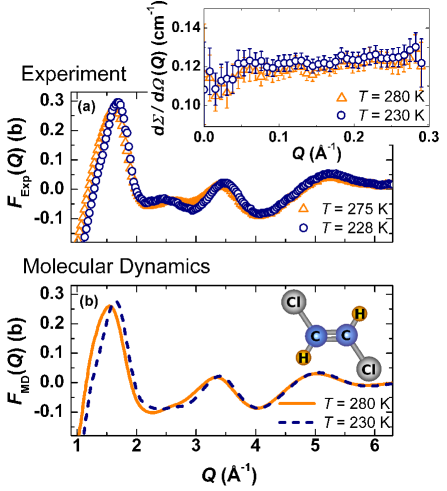
Because the differences between the HDL and LDL in trans-1,2-dichloroethylene were related to a change from a nematic-like to an isotropic molecular ordering as temperature is raised Kawanishi et al. (1981, 1982), we have performed a series of small angle neutron scattering (SANS) measurements from 220 K to room temperature to ascertain whether there is formation of intermediate range nematic-like structures or clustering in the HDL. Experiments were performed on the KWS-2 diffractometer of the Jülich Centre for Neutron Science at the Forschungsneutronenquelle Heinz Maier-Leibnitz (FRM II, Munich, Germany) Radulescu and Loffe (2008) using a wavelength of 4.5 Å and a sample-detector distance of 2.0 m that allowed to perform measurements in the Q range between and . The program qtikws Pipich (2009) was used to perform data correction and normalization. Results are shown in the inset of Fig. 1 for the HDL and LDL. No pronounced signal has been obtained within the experimental error in the measured Q-range, which disfavors the existence of a long range nematic-like ordering for the HDL Richardson (1998). The data exclude that the differences between both liquids are related to the emergence of molecular clustering on length scales of about 20–2000 Å.
Going down in the spatial range, the microscopic short range order (SRO) concerning a length scale of the order of a few molecular lengths () has been analyzed by means of neutron scattering experiments on the D4c diffractometer at the Institute Laue-Langevin (ILL, Grenoble, France) Fischer et al. (2002) using a wavelength of 0.5 Å and a deuterated sample. Data were corrected and normalized using the program correct Howe et al. (1996) and inelastic corrections were also carried out (for details on data reduction see Ref. Pardo et al. (2007)). The obtained total interference function Fischer et al. (2006) is shown in Fig. 1 for two representative temperatures. A change in the shape of the profile emerges between the first and second peak which reflects a change in the SRO. This change was also observed in a series of temperature dependent experiments on the D20 diffractometer (ILL) using a wavelength of 1.3 Å, giving better access to the low- region. It should be pointed out that similar changes have been found in the case of experiments performed on HDL water at high pressures Strässle et al. (2006) and MD simulations on HDL silicon Sastry and Angell (2003); Jakse and Pasturel (2008).
The microscopic mechanisms giving rise to the changes in the interference function have been investigated through a series of MD simulations (Fig. 1). Those were performed using the program amber8 Wang et al. (2004); Case et al. (2004) with a simulation box containing 3629 molecules and a time step of 1 fs. The inter- and intra-molecular interactions for the trans-1,2-dichloroethylene molecule were described using the GAFF force field Wang et al. (2004); Case et al. (2004). The simulations were carried out for the temperature range 200–350 K in the NPT ensemble, therefore allowing the box size to change, and the total time scale of each simulation run was 40–50 ns Murugan and Hugosson (2009, 2008). As can be seen in Fig. 1, the agreement between simulations and experiment is excellent. Note that not only the shapes of the simulated closely resemble the experimental ones, but also positions and intensities are equal within the experimental error.
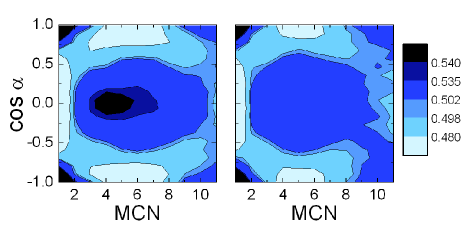
To emphasize quantitatively which are the SRO changes between the HDL and LDL, we show in Fig. 2 the probability of finding two molecules with a determined relative orientation for increasing distances. To present the distance dependent SRO, the molecular coordination number (MCN) has been chosen rather than distance in order to avoid trivial effects due to density changes. Figure 2 shows that the relative orientation of nearest neighbors is virtually the same and strongly defined for both liquids, in such a way that their C–C vectors are parallel, i.e., with . However, upon increasing distance between the molecules (third to tenth neighbor), a clear difference between the LDL and HDL can be seen in the SRO. For instance, for MCN between eight and ten, molecules are arranged in a orthogonal way for HDL and are randomly oriented for the LDL. Further analysis (not shown) tell us that besides the relative orientation of the C–C axes of two molecules, the reported changes are also reflected in the relative position of two molecules and in the relative orientation of the planes defined by the Cl–C–H bonds of two molecules. As proposed in the frame of two order parameter theories Tanaka (1999, 2000); Franzese and Stanley (2007); Kumar et al. (2008), this liquid can therefore not be simply characterized by its density, but also a parameter reflecting the SRO should account for the changes occurring between the two liquids.
To ascertain the influence of the aforementioned structural changes in the dynamics of the system, we have performed a series of quasielastic neutron scattering (QENS) experiments for temperatures ranging from 220 to 300 K, conducted with the TOFTOF spectrometer at FRM II on a hydrogenated sample. Spectra were measured using an energy resolution of and a wavelength of 6 Å, and data reduction was performed using the program frida Wuttke (1990). Two representative spectra at at the LDL and HDL are shown in Fig. 3(a).
To have a first insight of possible changes in the dynamics, a stretched exponential was fitted to the intermediate scattering function, obtaining a decrease of the exponent in the HDL, which is related to a broadening of the relaxation time distribution, i.e., an increase of the cooperativity of the molecular motion. A deeper analysis was performed through a careful fit of data to several models using a Bayesian approach with the program fabada Sivia and Skilling (2006); Pardo et al. (2009); Pardo (2009). In order to keep the number of physical parameters describing the data to a minimum, we performed the fits to the whole scattering law . Model selection was performed calculating the maximum of the likelihood for each model.
The first model used to describe the data is composed by a diffusion motion plus an isotropic rotation of the molecule Bée (1988). In this way, the only physical parameters to describe the whole experimental scattering function were the translational and rotational diffusion coefficients as well as the radius of rotation . This simple model is able to describe LDL data giving rise to a good quality fit and a radius of rotation almost independent of temperature (, see inset in Fig. 3(a)), in agreement with the aforementioned NMR measurements Kawanishi et al. (1981, 1982). For the HDL an inability of this model to describe experimental data (on quantitative grounds, a decrease on the of the fit), makes the isotropic model for rotation not valid to describe molecular rotation. This is also reflected on the sudden drop of R below (inset in Fig. 3(a)). Even when assuming a free diffusion model for rotations Egelstaff (1970) and assuming an anisotropic rotation of molecules Hinze et al. (2004); Bermejo et al. (1990), models could not account for spectra obtained in the HDL. Only adding a confined motion to the previous model, data could be successfully described. For the latter model, can be expressed as:
where is the elastic incoherent structure factor of the confined motion, is a Lorentzian function accounting for a confined motion, is the component accounting for the molecular rotation, the component for molecular diffusion Bée (1988), and is the instrumental resolution. Agreement with HDL spectra is shown in Fig. 3(a). To estimate the length scale at which the confined motion is taking place, values have been fitted with a model of diffussion inside a sphere, yielding and, more realistically, a threedimensional Brownian oscillator Doster (2006), yielding a mean squared displacement . Moreover, the obtained are almost independent of temperature for the HDL, which means that the length scale of the confined motion is roughly temperature independent for this liquid.
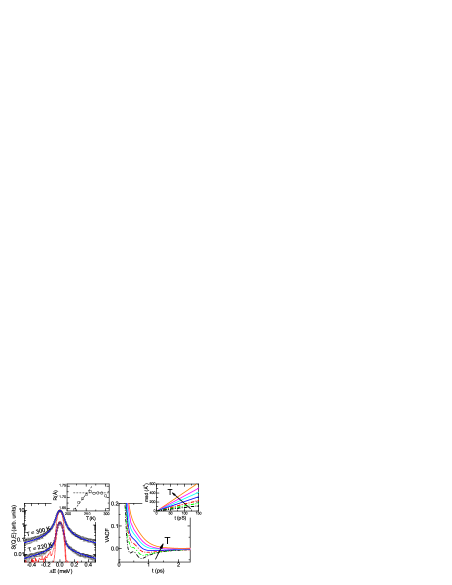
As previously performed for the microscopic structure investigation, the dynamics obtained from MD simulations have been analyzed as well. Agreement between translational diffusion activation energy determined using the neutron experiments () and MD simulations () confirms that the simulation is indeed describing the dynamics of our system, and that we are actually simulating the liquid phase in all temperature range (see also inset of figure 3b) . The normalized velocity autocorrelation function (VACF) is shown in Fig. 3(b). The fastest decay for the HDL is higher that that of LDL indicating that interaction with neighboring molecules takes before in that phase. As can be seen, there is a clear change in the dynamics of the two liquids, the VACF reaching negative values for HDL. Although interactions between neighbor molecules at the LDL seem not to impede molecular diffusion, for the HDL a well defined backscattering effect emerges, displaying a VACF with two minima characteristic to that of hydrogen bonded systems Guàrdia et al. (1994). Such a change in the dynamics is not expected to be due to temperature effects Hirata (2002). Additionally, a change of density of the system would not be able to explain this change in the dynamics since a change as large as about 15% in density is needed to produce an effect on the liquid dynamics in other systems Hirata (2002). Therefore, only a change in the SRO is able to account for the change in the dynamics seen by experiments and simulations.
The need for an additional confined motion at low temperatures to describe the QENS data goes along with a backscattering effect observed in the simulations. We can therefore assert that a cooperative molecular motion is present for the HDL but not for the LDL, which agrees with other experimental results Merkel et al. (2008). The complex dynamics of the HDL agrees with a stronger molecular ordering present in this liquid, where on average there are many orthogonally oriented molecular pairs. This strong correlation is partially lost in the LDL, where molecular movements are due to non-coupled movements of diffusion and rotation.
We have shown that the microscopic ordering of molecules and molecular dynamics are different between the HDL and the LDL. The changes in the dynamics are not due to temperature or density effects, but due to changes in the SRO: for the HDL there are molecules perpendicularly oriented that are randomly oriented in the LDL. This accounts for the change of molecular dynamics from simple non-cooperative motions in the LDL to cooperative motions for the HDL. However, if these effects are to be explained in the frame of a singularity-free scenario or a liquid-liquid critical point scenario associated to a first order phase transition remains an open question.
Acknowledgements.
The authors would like to thank C. A. Angell, G. Franzese, G. Sesé and T. Strässle for helpful discussions and X. Ariza for deuterating the sample. This work has been supported by the Spanish Ministry of Science and Technology (FIS2008-00837, BES-2007-17418), by the Government of Catalonia (2009SGR-1251) and by the European Commission (NMI3/FP7).References
- Akahama et al. (1987) Y. Akahama, W. Utsumi, S. Endo, T. Kikegawa, H. Iwasaki, O. Shimomura, T. Yagi, and S. Akimoto, Phys. Lett. 122, 129 (1987).
- Kikegawa et al. (1987) T. Kikegawa, H. Iwasaki, T. Fujimura, S. Endo, Y. Akahama, T. Akai, O. Shimomura, T. Yagi, S. Akimoto, and I. Shirotani, J. Appl. Crystallogr. 20, 406 (1987).
- Katayama et al. (2000) Y. Katayama, T. Mizutani, W. Utsumi, O. Shimomura, M. Yamakata, and K. Funakoshi, Nature 403, 170 (2000).
- Tanaka et al. (2004) H. Tanaka, R. Kurita, and H. Mataki, Phys. Rev. Lett. 92, 025701 (2004).
- Kurita and Tanaka (2005) R. Kurita and H. Tanaka, J. Phys.: Condens. Matter 17, L293 (2005).
- Tanaka (1999) H. Tanaka, J. Chem. Phys. 111, 3163 (1999).
- Tanaka (2000) H. Tanaka, Phys. Rev. E 62, 6968 (2000).
- Franzese and Stanley (2007) G. Franzese and H. E. Stanley, J. Phys.: Condens. Matter 19 (2007).
- Kumar et al. (2008) P. Kumar, G. Franzese, and H. E. Stanley, Phys. Rev. Lett. 100, 105701 (2008).
- Kawanishi et al. (1981) S. Kawanishi, T. Sasuga, and M. Takehisa, J. Phys. Soc. Jpn. 50, 3080 (1981).
- Kawanishi et al. (1982) S. Kawanishi, T. Sasuga, and M. Takehisa, J. Phys. Soc. Jpn. 51, 1579 (1982).
- Zegrodnik et al. (1989) B. Zegrodnik, A. Hacura, W. Carius, and O. Schröter, Acta Phys. Pol. 75, 469 (1989).
- Merkel et al. (2008) K. Merkel, A. Kocot, R. Wrzalik, and J. Ziolo, J. Chem. Phys. 129, 074503 (2008).
- Rzoska et al. (2008) S. Rzoska, J. Ziolo, A. Drozd-Rzoska, J. L. Tamarit, and N. Veglio, J. Phys.: Condens. Matter 20, 244124 (2008).
- Radulescu and Loffe (2008) A. Radulescu and A. Loffe, Nucl. Instrum. Methods A 586, 55 (2008).
- Pipich (2009) V. Pipich, QtiKWS (2009), URL http://iffwww.iff.kfa-juelich.de/~pipich/.
- Richardson (1998) R. M. Richardson, in Handbook of liquid crystals, edited by D. Demus, J. W. Goodby, G. W. Gray, H. W. Spiess, and V. Vill (Wiley-VCH, 1998), chap. 4.
- Fischer et al. (2002) H. E. Fischer, G. J. Cuello, P. Palleau, D. Feltin, A. C. Barnes, Y. S. Badyal, and J. M. Simonson, Appl. Phys. A: Mater. Sci. Process. 74, S160 (2002).
- Howe et al. (1996) M. Howe, R. McGreevy, and P. Zetterström, Computer code CORRECT, correction program for neutron diffraction data (1996), NFL Studsvik internal report.
- Pardo et al. (2007) L. C. Pardo, J. L. Tamarit, N. Veglio, F. J. Bermejo, and G. J. Cuello, Phys. Rev. B 76 (2007).
- Fischer et al. (2006) H. E. Fischer, A. C. Barnes, and P. S. Salmon, Rep. Prog. Phys. 69, 233 (2006).
- Strässle et al. (2006) T. Strässle, A. Saitta, Y. Le Godec, G. Hamel, S. Klotz, J. Loveday, and R. Nelmes, Phys. Rev. Lett. 96, 067801 (2006).
- Sastry and Angell (2003) S. Sastry and C. A. Angell, Nature Mater. 2, 739 (2003).
- Jakse and Pasturel (2008) N. Jakse and A. Pasturel, J. Chem. Phys. 129, 104503 (2008).
- Wang et al. (2004) J. Wang, R. Wolf, J. Caldwell, P. Kollman, and D. Case, J. Comput. Chem. 25, 1157 (2004).
- Case et al. (2004) D. A. Case, T. E. Cheatham, III, C. L. Simmerling, J. Wang, R. E. Duke, R. Luo, K. M. Merz, B. Wang, D. A. Pearlman, M. Crowley, et al., AMBER 8, University of California, San Francisco (2004).
- Murugan and Hugosson (2009) N. A. Murugan and H. W. Hugosson, J. Phys. Chem. B 113, 1012 (2009).
- Murugan and Hugosson (2008) N. A. Murugan and H. W. Hugosson, Phys. Chem. Chem. Phys. 10, 6135 (2008).
- Wuttke (1990) J. Wuttke, FRIDA: Fast Reliable Interactive Data Analysis (1990), URL http://sourceforge.net/projects/frida/.
- Sivia and Skilling (2006) D. Sivia and J. Skilling, Data Analysis: A Bayesian Tutorial (Oxford University Press, 2006).
- Pardo et al. (2009) L. C. Pardo, M. Rovira-Esteva, S. Busch, M. D. Ruiz-Martín, J. L. Tamarit, and T. Unruh (2009), eprint arXiv: 0907.3711v3 [physics.data-an].
- Pardo (2009) L. C. Pardo, FABADA (Fitting Algortihm for Bayesian Analysis of DAta) (2009), URL http://fisicaetseib.upc.es/gcm/members/lcpardo/software.
- Bée (1988) M. Bée, Quasielastic Neutron Scattering (Adam Hilger, Bristol, 1988).
- Egelstaff (1970) P. A. Egelstaff, J. Chem. Phys. 53, 2590 (1970).
- Hinze et al. (2004) G. Hinze, G. Diezemann, and T. Basche, Phys. Rev. Lett. 93, 203001 (2004).
- Bermejo et al. (1990) F. J. Bermejo, F. Batallán, E. Enciso, R. White, A. J. Dianoux, and W. S. Howells, J. Phys.: Condens. Matter 2, 1301 (1990).
- Doster (2006) W. Doster, in Neutron Scattering in Biology, Methods and Applications, edited by J. Fitter, T. Gutberlet, and J. Katsaras (Springer Verlag, 2006), pp. 461–483.
- Guàrdia et al. (1994) E. Guàrdia, G. Sesé, and J. A. Padró, J. Mol. Liq. 62, 1 (1994).
- Hirata (2002) Y. Hirata, J. Phys. Chem. A 106, 2187 (2002).