nkrao@iiap.res.in 22institutetext: The W.J. McDonald Observatory, The University of Texas, Austin, TX 78712-1083, USA
dll@astro.as.utexas.edu
High-resolution spectroscopy of the R Coronae Borealis and Other Hydrogen Deficient Stars
Abstract
High-resolution spectroscopy is a very important tool for studying stellar physics, perhaps, particularly so for such enigmatic objects like the R Coronae Borealis and related Hydrogen deficient stars that produce carbon dust in addition to their peculiar abundances. Examples of how high-resolution spectroscopy is used in the study of these stars to address the two major puzzles are presented: (i) How are such rare H-deficient stars created? and (ii) How and where are the obscuring soot clouds produced around the R Coronae Borealis stars?
1 Introduction
We congratulate the organizers for arranging and conducting this conference, celebrating the 150 years of the discovery by (Gustav Robert) Kirchoff and (Robert Wilhelm Eberhard) Bunsen that various gases can be easily and positively identified by a detailed study of the light they emit and absorb. As Paul Merrill (Merrill et al. (1963)) noted, a new era in astronomy began when Bunsen saw ‘in yellow flame of an ordinary alcohol lamp whose wick was sprinkled with salt, and possibilities of the chemical analysis of the most distant stars’. Thus began the era of astronomical spectroscopy. Merrill’s own contributions to our discipline are legendary with his discovery of Tc i lines in the spectra of S stars signaling that element synthesis in stars was a continuing phenomena (Merrill (1952)).
A few historical remarks might be appropriate. Astronomical spectroscopy in India started during the famous total solar eclipse that occurred on 1868 August 18 in which a spectroscope was first used to study the nature of solar prominences leading to the discovery of helium. Madras observatory, from which the present host Institution evolved, also played a role. Norman Robert Pogson, then director of the observatory, used a visual spectroscope to look at the prominences and noted a bright line in the yellow close to but not coincident with sodium D lines. This was the D3 line - the same line as found by Janssen during the 1868 eclipse but by Lockyer without the aid of eclipse. The first stellar spectrum recorded in India was obtained at Madras (now Chennai); this was a spectrum of the Wolf-Rayet star Velorum observed in 1871.
Spectroscopic analysis of some of the most enigmatic stars yet discovered is the theme of our contribution. The chosen stars are the R Coronae Borealis stars and their putative cooler relatives, the hydrogen-deficient cool carbon stars (HdCs). The enigma presented by these stars has two principal parts: (i) How did these stars become so H-deficient? and (ii) how do the RCBs but not the HdCs develop thick clouds of soot that obscure the stellar photosphere from view? Answers to these questions are emerging. Here, we highlight particular contributions to their solution from analysis of high-resolution optical and infrared spectra. Disney (2000) has lamented (tongue in cheek, we suppose) that ‘the tragedy of Astronomy is that most information lies in spectra’. We would counter by substituting ‘allure’ for ‘tragedy’ and add that one should expect to apply all available observational tools in seeking answers to our questions.
R Coronae Borealis stars are a rare class of peculiar variable stars. The two defining characteristics of RCBs are (i) a propensity to fade at unpredictable times by up to about 8 magnitudes as a result of obscuration by clouds of soot, and (ii) a supergiant-like atmosphere that is very H-deficient and He-rich. The of the class ranges from 8000 to 4000 K and from 0.5 to 1.5 (cgs units) except for the two hotter stars DY Cen (19000 K) and MV Sgr (14000 K). The MV ranges from -5 to -2.5 and from 4.0 to 3.2 L⊙. Presently, there are 52 known RCBs in the Galaxy (Tisserand et al. (2008); Clayton et al. (2009)), 21 known members in the Large Magellanic Cloud and 6 in the Small Magellanic Cloud. The total number of RCBs in the Galaxy may be about 3200 (Alcock et al. (2001)) There are only 5 known HdC stars in the Galaxy. Their detection may be hampered because they do not show RCB-like light variations, an infrared excess or a stellar wind (Geballe, Rao & Clayton (2009)). They overlap the RCBs in Teff with a spread from about 6500 to 5000 K. At the high end of the RCBs sit the Extreme helium stars (EHes) of which 21 are known in the Galaxy with from 32000 to 9000 K and from 0.75 to 4.0. Their ranges from 4.4 to 3.0 L⊙. Here, we give no more than passing attention to the EHes and other, even hotter H-deficient stars that may form an evolutionary sequence with the HdCs and RCBs.
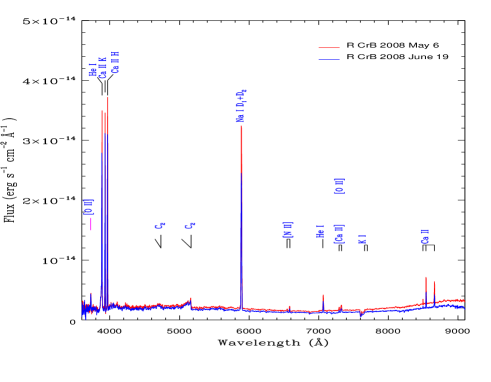
A fascinating aspect of RCBs is that they present several faces to observers, like the Hindu mythological god Karthikeya (son of Kritthikas -Pleiades) with his six faces. The faces presented to our view are (i) a chemically peculiar supergiant, (ii) a variable star obscured without warning from our view by clouds of soot, (iii) a small amplitude pulsation both in light and radial velocity with a period around 40 days, (iv) an infrared source producing dust and blowing it away after several days, weeks, months or even years as clouds, (v) a hot stellar wind, and (vi) and may even be a central star of a low density nebula as evidenced by the presence of nebular lines of [O II], [N II] (Fig. 1) and [S II]. They also have putative relatives of higher and lower temperatures, as intriguing as Karthikeya’s relatives.
Our emphasis is on insights obtainable from high-resolution spectra with the assumption that relevant atomic and molecular data of adequate precision and completeness are to be provided from laboratory and theoretical spectroscopic studies. This assumption is patently false, as is no surprise to practicing astronomical spectroscopists. On the chance that a reader of this paper may wish to take up a challenge, we mention two aspects of the incompleteness of knowledge of the spectrum of neutral carbon that compromise some analyses of the spectra of RCBs.
Spectra of RCBs are crossed by many lines of C i, as noted by Keenan & Greenstein (1963). One might refer to the spectrum of a RCB as arising from a column of somewhat contaminated high-temperature carbon vapour. A great step forward in identifying the C i lines was made when Johansson (1965) extended the laboratory spectrum and knowledge of the C i term system. With modern spectra of RCBs, many suspected C i lines remain unidentified and cry out for a new laboratory investigation of the C i spectrum. Today, astronomical spectroscopists often require more than a set of wavelengths and a table of energy levels. This is certainly true for the pursuit of an abundance analysis leading to the chemical composition of a RCB. Abundance analysis at a minimum requires knowledge of the -values for identified lines including the C i lines. Asplund et al. (2000) report on an extensive abundance analysis of RCBs and their uncovering of a ‘carbon problem’ which may arise because the adopted theoretical -values or the photoionization cross-sections for neutral carbon were too large by a factor of about four. (Asplund et al. also suggested possible ways to reduce the carbon problem without appealing to deficiencies in atomic physics.) Where are the physicists who will attack the spectrum of the carbon atom with the precision and thoroughness that we seek?
2 Major Puzzles
As stated in the Introduction, the two principal puzzles presented by the RCBs concern their origins and their ability to produce soot clouds. The HdCs share the puzzle about their origins but not that of soot production. Of course, the ‘dust’ puzzle might incorporate the HdCs with the RCBs by asking ‘Why is it that RCBs but not the HdCs, which are on average cooler than the RCBs, are prone to soot production?’
2.1 Origins
The basic problem is to understand how a H-deficient star evolves from a H-rich single or binary star; H-poor He-rich gas clouds capable of sustaining stellar nurseries have not been found. Complete resolution of the problem would show how the classes of H-deficient stars – HdCs - RCB - EHe - beyond – are or are not related.
Presently, there are two principal hypotheses for the origins:(i) the double-degenerate (DD) scenario and (ii) a late thermal pulse or final flash (the FF scenario) in a luminous star on the white-dwarf cooling track.
In the DD scenario, a He white dwarf is accreted by a C-O white dwarf as loss of orbital energy drives the white dwarfs to merge. There are rather specific ranges of initial masses and separations for normal (H-rich) stars in a binary to merge and produce a H-deficient He-rich star. (Other combinations produce other odd stars such as a single white dwarf with a mass exceeding Chandrasekhar’s limit that must go bang in the night or day.) The post-merger product has the greatly extended envelope required for a supergiant RCB and HdC star. Subsequent evolution follows the canonical post-AGB contraction to the white dwarf track (Webbink (1984); Iben & Tutukov (1984); Saio & Jeffery (2002)).
In the FF scenario, H-rich post-AGB single stars that reach the white dwarf cooling track with the potential to experience a final thermal pulse in their He-shell. Under particular conditions, the thin surviving H-envelope may experience H-burning. Onset of the pulse leads to a return of the star to a supergiant-like form but, if conditions are ripe, this supergiant will be H-poor and He-rich. Subsequent evolution takes the supergiant across the HR-diagram to the white dwarf cooling track. Schonberner (1979), Iben et al. (1983), Renzini et al. (1990), and Herwig (2001) among others discuss aspects of the FF scenario. Enigmatic stars such as FG Sge and Sakurai’s object (V4334 Sgr) are commonly identified as FF scenario products.
Quantitative comparison of predictions of the FF and DD scenario and the observations of the RCB and HdC stars involves several dimensions. Our focus here is on the chemical composition obtainable only from examination of the spectrum of RCB and HdC stars. The (preferably) high-resolution spectra from the ultraviolet, optical and near-infrared are analyzed with model atmospheres computed for the appropriate composition (Asplund et al. (2000); Pandey et al. (2006); García-Hernándezet al. (2009)). Recent elemental abundance studies of C, N, O in particular seem to favour the DD scenario for the RCBs and HdCs (Asplund et al. 2000; Saio & Jeffery 2002; Pandey et al. 2006).
Two remarkable pieces of observational evidence seems to tilt the balance in favour of the DD scenario. First, Clayton et al. (2005, 2007) made the dramatic discovery that 18O is more abundant than 16O from moderate resolution spectra of HdC and RCB stars showing the first-overtone CO vibration-rotation bands at about 2.3 microns. Second, Pandey (2006) for EHes and Pandey, Lambert & Rao (2008) for RCBs showed that 19F was drastically overabundant. The 18O and F results show that the DD scenario was not a quiescent mixing process but either involved nucleosynthesis during the merger and/or subsequently during the evolution of the merged product to and from its supergiant phase.
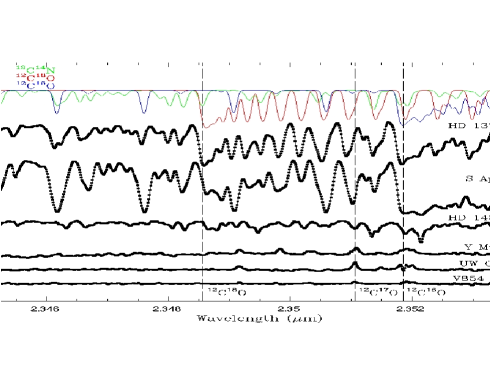
It is amusing to see how this discovery of 18O was made in HD137613, as told us by Tom Geballe. He got an email from Geoffrey Clayton at 5:30 p.m on 2004 November 10: ‘Hi Tom. I have this spectrum of the first overtone CO bands in the HdC star, HD 137613. I took a look at it and the bands were split, so I said to myself, oh well there’s 13CO, but the extra components aren’t at the right wavelengths. So I’m a bit mystified. Take a look at the attached plot and see if you have an idea of what this is’. To which Tom replied: ‘ That is amazing!! I happen to have a book of CO wavelengths that I calculated when I was a grad student in the 70s. All dv=1 and dv=2 lines of all isotopic species. These bandheads match 12C18O!! The first three bandheads (2-0, 3-1, 4-2) of 12C18O are at 2.349, 2.378, and 2.408. I also looked 12C17O and it doesn’t match. How could a star have as much 18O as 16O? What kind of star is this? Cheers and congrats, Tom (Geballe 2008).
High resolution spectroscopy is essential for properly estimating the isotope ratios 16O to 18O, 16O to 17O (as well as detection of the weak lines of 19F). García-Hernández et al. (2009) used a spectral resolution of 50000 in their analysis of the 2.3 micron CO bands. They confirmed Clayton et al.’s result of a high 18O overabundance for HdCs and the RCB S Aps obtaining a ratio of 16O to 18O of 0.5 in HdCs and the ratio 16 for S Aps (Fig.2). The high resolution optical spectra obtained with the Harlan J. Smith telescope at the McDonald Observatory and with the Vainu Bappu Telescope at Kavalur led to the discovery that 19F is enhanced by a factor of several hundreds to a 1000 times solar in these stars. In passing we note that Harlan J. Smith and M.K. Vainu Bappu were great friends.
There can be no doubt that 18O and 19F were synthesized in or subsequent to the creation of the RCBs and HdCs. Before full acceptance of the DD scenario is made, the scenario has to account for the nucleosynthesis of these and other observable elemental and isotopic abundances. In principle, as first noted by Warner (1967), 18O may be synthesized by -capture from abundant 14N. This may occur during the merger in the DD scenario but not with ease in the FF scenario. The reservoir of 14N is finite and probably not easily restored, thus, one wonders what cuts off the high temperatures at the point that there remains an observable amount of nitrogen. Other complexities remain. In particular, some RCBs and one HdC show an appreciable amount of lithium, presumably 7Li. Discussions of the nucleosynthesis in and following the merger are provided by Clayton et al. (2007), Pandey, Lambert & Rao (2008), and García-Hernández et al. (2009). Additional high-resolution spectroscopy, especially in the infrared, is desirable to determine the O isotopic abundances across the RCB sample.
The FF scenario does plausibly account for other stars. Most notable among the FF candidates are FG Sge, V4334 Sgr and V605 Aql (Clayton et al. 2005). It is not impossible that RCBs from the FF scenario lurk among the known Galactic, LMC and SMC examples.
2.2 Dust Production by RCBs
Historically, RCB stars were the first stars in which circumstellar dust production was invoked to explain brightness variations, i.e., the dramatic declines of several magnitudes (Loreta (1934); O’Keefe (1939)). It is now well established that soot (carbon) clouds form close to the star and obstruct the star light reaching us. Such clouds have now been imaged in the infrared around RY Sgr at distances of about 1000 stellar radii (de Laverny & Mekarnia (2004)). These clouds were formed presumably closer to the star; observational constraints prohibited their detection close to the star.
Questions abound concerning the dust. What provides the trigger for dust production in or around the star? How may dust condense in or around such hot stars as RCBs? The trigger appears to be related to the atmospheric pulsations which are revealed by light and radial velocity variations. Pugach (1977) noted a correlation between the beginning of a light decline and pulsation phase in RY Sgr. It has now been shown by Crause, Lawson & Henden (2007) for four stars, by longterm monitoring of the brightness, that when a decline happens it does so at a particular phase although not every pulsation results in a decline. Woitke et al. (1996) developed a model for dust formation following a pulsation-induced shock in the upper atmosphere. When the pulsation amplitudes are large, the temperatures and densities in the post-shock gas are predicted to be conducive for nucleation to occur. The question intriguing spectroscopists is – how may we observe a strong shock develop from a pulsation? What evidence may we offer that dust condensation actually takes place in the atmosphere of the star? Can we detect the presence of cool gas from which dust could condense? High-resolution spectroscopic observations prior to the onset of the minimum are crucial to studying such questions.
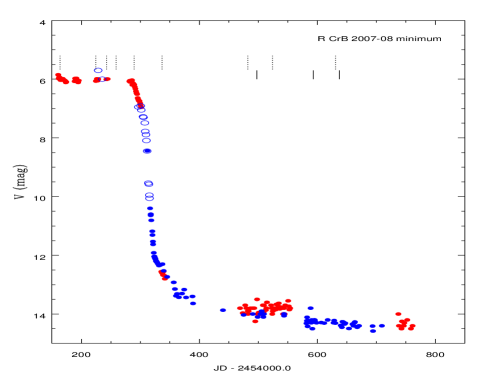
Recently, R CrB has entered a prolonged light decline that commenced on July 2007 and has not yet ended (July 2009). This is one of the deepest minima the star has had in several decades, reaching more than 9 magnitudes. At minimum the star shows a variety of emission lines including broad (fwhm of 250 km s-1) emission lines of He i, H & K lines of Ca ii, Na i D lines (Fig.1) and sharp (fwhm 15 km s-1) emission lines due to Fe ii, Ti ii etc. (Rao et al. (1999)). We postpone the discussion of this intriguing emission spectrum for a later occasion. We were fortunate to catch the star just on the verge of the decline. Our optical spectra obtained at the McDonald Observatory and at Vainu Bappu Observatory have a spectral resolution over 60000. Fig. 3 shows the light curve with the dates of our spectroscopic observations marked. The spectral changes that R CrB underwent even prior to light minimum may provide important clues to the phenomenon of dust production.
3 Prelude to Minimum: The Spectrum at Maximum Light
The present series of spectra that precede the light minimum starts on 2007 March 4. Spectra at maximum light are dominated by lines of C i, O i, N i, Si i and S i in addition to the many lines of neutral and ionized metals seen in spectra of normal F-G supergiants.
The star remained at maximum until 2007 July 10 when the decline in light started. In the following account, we discuss briefly the spectral changes that took place during maximum light. Even four months prior to the onset of the minimum, the star appears to be disturbed with emission in some line cores suggesting a component with an inverse P-cygni profile. Line doubling of the absorption lines is seen two months prior to the onset. The blue and red components of the doubled lines showed a different level of excitation for the rising gas ( of 4300 K) from the infalling gas ( of 5600 K).
Some lines, like Ti ii 5154 , are not doubled but show emission in the line core. Even the cores of the Na i D lines show emission compared to the reference spectrum at ‘normal’ maximum light. Moreover, the radial velocity of the emissions is same as that of the star.
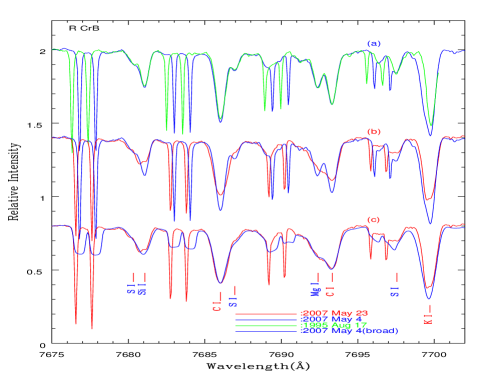
The absorption lines also broadened without altering the equivalent widths, a month and half before the onset of minimum as though the starlight was passing through a scattering medium (see Fig. 4). Study of such line broadening requires high spectral resolution.
Some aspects of the spectroscopic changes months ahead of the decline beginning in 2007 July are not unusual. For example, line doubling appears to be a regular feature of stars such as R CrB and RY Sgr where the atmospheric pulsation is seen clearly. It will be of interest to see if these changes occur at the same or similar phases in the pulsation. Perhaps, there is a quasi-steady amplification of the changes at the particular phase lasting a sequence of several pulsations and culminating in the physical conditions amounting to the trigger for a decline. Examination of this idea will call for routine observations of a RCB such as R CrB, RY Sgr or V854 Cen, a star prone to frequent declines. Considerable observing time may be wasted in that the declines are unpredictable and irritation of Telescope Allocation Committees seems assured. But these datasets are most likely to reveal new phenomena that may tighten the link between pulsation and the trigger for dust production. For example, the spectroscopic variations – line asymmetry, doubling, radial velocity and strength – may be more extreme at particular phases.
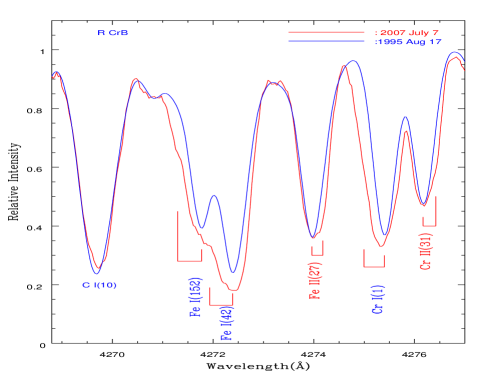
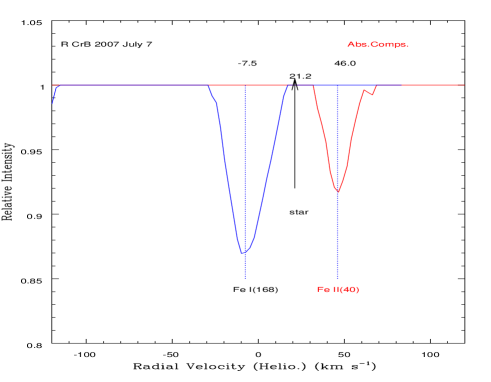
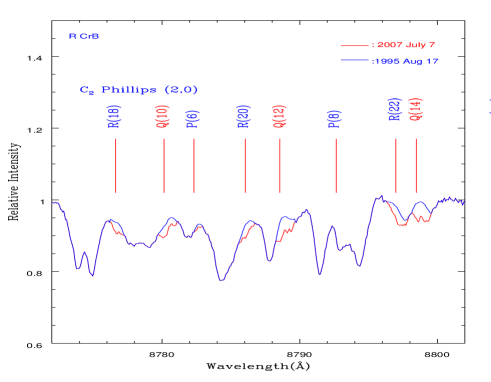
More significantly, major disturbances were present in the spectrum of R CrB three days prior to the descent. Comparison of pre-maximum and 2007 July 7 spectra shows that most lines in 2007 July 7 spectrum have shifted-absorption components (Fig. 5) in addition to the usual photospheric lines. Fig. 5 shows a comparison of the spectrum on 2007 July 7 with respect to an undisturbed spectrum obtained on 1995 August 17 illustrating the additional absorption components to several lines that appear in the 2007 July 7 spectrum. However, the C i lines do not show such additional absorption components. Note that, while the neutral metal lines (e.g., Fe i, and Cr i) show strong blue-shifted components, the ionized metal lines (e.g., Fe ii, and Cr ii) show red-shifted components on 2007 July 7. Such differences suggests that rising and falling gases have different levels of ionization. As further shown in Fig. 6 during the descent to minimum the blue (ionized) and redshifted (neutral) components are separated by 53 km s-1 probably as a result of passage of a strong shock. Of seemingly particular relevance to dust production, the 2007 July 7 spectrum also displays lines of the C2 Phillips system showing the presence of gas at temperatures (1000 to 800 K, Figs. 7 and 8) suggestive of a site for dust nucleation. One supposes these unusual line profiles and the appearance of cool gas are manifestations of the shock induced by the pulsation that triggered the decline.
3.1 2007 July 7-10 –At the edge of the descent
Absorption lines of C2 Phillips system
The 12C2 Swan bands are fairly strong in the spectrum of R CrB. Bandheads of the 0-0 band at 5165 Å, the 1-0 band at 4737 Å, and the 0-1 band at 6174 Å are readily identified. More interestingly, the spectrum of 2007 July 7 shows weak bands of the Phillips system of C2 in absorption – see Fig. 7 for examples of lines from the 2-0 band. These C2 lines not present in the regular stellar spectrum are shifted in velocity from the stellar lines and present with a red and a blue component. Our spectra show that the Phillips lines were not present on 2007 June 6 spectrum, a month before the onset of the decline.
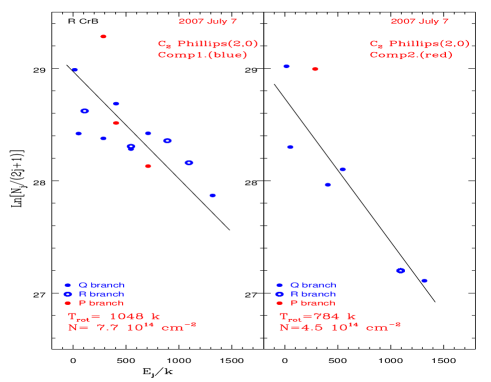
Rotational temperatures of 104830 K and 78430 K were obtained (Fig. 14) for the blue component at 14.5 km s-1 and the red component at 5 km s-1, respectively, using the molecular data given by Bakker et al. (1997). The corresponding molecular column densities are 7.71014 cm-2 and 4.51014 cm-2. The radial velocities of C2 molecules of 14.5 km s-1 and 5 km s-1 suggest cool gas rising relative to the star with stellar lines giving the radial velocity of 21 km s-1. The cooler gas is less rapidly rising than the warmer molecular gas.
These rotational temperatures show that there was gas at the condensation temperatures conducive to formation of carbon soot. Similar detections of cool C2 molecules have been reported by us for V854 Cen (Rao & Lambert (2000)), R CrB (Rao, Lambert & Shetrone (2006)) , and V CrA (Rao & Lambert (2008)). But these detections were during minimum light. In contrast, the present detection of cool C2 molecules at maximum light but on the verge of a minimum is significant and leads to the conclusion that the light minima are indeed caused by formation of dust grains. Woitke et al’s (1996) model seems to be consistent with observations! Intense spectroscopic coverage of the days leading up to a descent to a minimum is an important unfulfilled challenge made more by difficult by the unpredictable onset of the descent.
4 The stellar wind
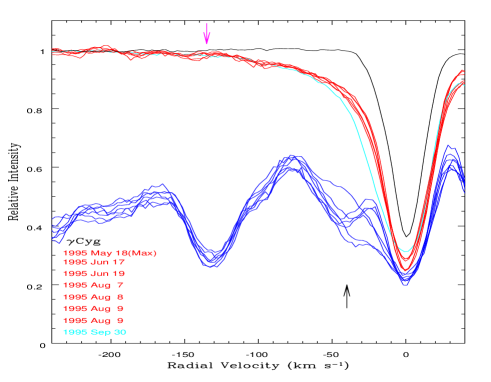
A mark that distinguishes RCBs from HdCs is the absence from the latter’s defining characteristics, the declines – deep or even shallow – that are such a strong feature of the RCBs. Absence of declines accounts for the lack of an infrared excess from the HdCs. Another distinguishing mark between RCBs and HdCs is the presence of a stellar wind from RCBs but not from HdCs. Are these two marks different sides of one difference between the two groups of H-deficient stars? Clayton, Geballe & Bianchi (2003) reported the presence of a P-Cygni profile for the He i 10830 Å line at maximum light for several RCBs. These observations show that the RCBs possess a stellar wind with an outflow velocity of 200 to 300 km s-1. Then, Rao, Lambert & Shetrone (2006) showed that in R CrB the strong photospheric lines, particularly the O i 7771 Å line, had a pronounced blue wing suggesting a component with an expansion velocity of 120 km s-1. Examination of profiles of other lines showed a component associated with the stellar wind with the velocity proportional to the excitation energy of the lines, i.e., the range of lines sample the region in the upper atmosphere where the wind is accelerating to the (possibly terminal) velocity measured from the He i 10830 Å line. Our high-resolution spectra now show that a stellar wind may be common, perhaps ubiquitous, among RCBs.
The temporal dependence of the RCB stellar wind is not yet fully known. There is no indication that it depends greatly or at all on the phase of the pulsation cycle. Long-term behaviour is also not known. Observations at the 1995–1996 minimum of R CrB suggest that the wind-affected wings of the O i lines are undisturbed even though the core is affected by transient emission in the early decline (Rao et al. 1999). What drives this wind? Is there any connection with magnetic fields? In the R CrB wind, low excitation lines (e.g., the Al i resonance lines) show variability on a short time scale but there is no change in the high excitation lines. Examination of magnetically-sensitive and magnetically-insensitive Fe i lines of comparable strength and excitation potential from a series of high-resolution spectra of R CrB taken at maximum light suggests the variability in the former, but not in the latter (Rao 2008). This result suggests a connection between surface magnetic field and the wind. The relation between the (apparently) permanent and (seemingly) pulsation phase-independent wind and trigger for a decline is as yet unknown.
In contrast, Geballe, Rao & Clayton (2009) examined the five known HdCs at the He i 10830 Å line on high-resolution spectra and found no evidence of a stellar wind. The absence of a wind and the lack of deep declines among the HdCs and the presence of a wind among the RCBs with their deep declines is suggestive that the wind or the presence of an extended atmosphere as a result of the wind is a necessary condition for occurrence of deep declines.
5 Concluding remarks
Answers are slowly emerging for the important questions posed by RCB and HdC stars concerning the origin of these H-deficient stars, and the mechanisms by which a cloud of soot forms and obscures the star. Evidence suggests that the DD rather than the FF scenario provides a superior accounting for the elemental abundances of C, N and O for RCB stars and their likely relatives, the extreme Helium (EHe) stars and cool hydrogen deficient (HdC) stars. The FF scenario does plausibly account for other stars. Most notable among the FF candidates are FG Sge and V4334 Sgr, also known as Sakurai’s object and V605 Aql (Clayton et al. (2006)). It is not impossible that RCBs from the FF scenario lurk among the analysed sample attributed in the main to the DD scenario.
The process of soot formation is most likely associated with the atmospheric pulsation which, on occasions at a certain phase of the pulsation, leads to a stronger than usual shock in the atmosphere such that the physical conditions are conducive to molecule formation and dust nucleation, as envisaged by Woitke et al.(1996). How the dust grains grow and soot clouds form represent questions for future study.
As our essay has hopefully shown, high-resolution optical and infrared spectra have and will prove crucial to addressing the leading questions about the H-deficient RCB and HdC stars. In preparing the paper, we came across a collection of articles on modern high-resolution spectroscopic techniques. There, the leading chapter by Sir Harry Kroto carried the title ‘Old spectroscopists forget a lot but they do remember their lines’ (Kroto (2009)). This pair of old spectroscopists remember at least the important lines.
Acknowledgements.
We acknowledge with thanks the variable star observations from the AAVSO database. This research has made use of the SIMBAD database, operated at CDS, Strasbourg, France. Our sincere thanks to the editors of this volume for accepting with admirable patience our delay in submitting this article. This research has been supported in part by a grant (F-634) to DLL from the Robert A. Welch Foundation of Houston, Texas.References
- Alcock et al. (2001) Alcock,C., et al . 2001, Ap.J, 554, 298
- Asplund et al. (2000) Asplund, M., Gustafsson, B., Lambert, D. L., Rao, N. K., 2000, A&A, 353, 287
- Bakker et al. (1997) Bakker, E.J., van Dishoeck, E.F., Waters, L.B.F., Schoenmaker, T., 1997, A&A, 323, 469
- Clayton, Geballe & Bianchi (2003) Clayton, G.C., Geballe, T.R., Bianchi, L. 2003, ApJ, 595, 412
- Clayton et al. (2006) Clayton, G.C., Kerber, F., Pirzkal, N., De Marco, O., Crowther, P.A., Fedrow, J.M. 2006, ApJ, 646, L69
- Clayton et al. (2007) Clayton, G.C., Geballe, T.R., Herwig, F., Fryer, C., Asplund, M. 2007, ApJ, 662, 1220
- Clayton et al. (2005) Clayton, G.C., Herwig, F., Geballe, T.R., Asplund, M., Tenenbaum, E.D., Engelbracht, C.W., Gordon, K.D., 2005, ApJ, 623, L141, ApJ, 662, 1220
- Clayton et al. (2009) Clayton, G.C., Kilkenny, D.,Wils, P., Welch, D.L., 2009, astro-ph 0904.0631
- Crause, Lawson & Henden (2007) Crause, L.A., Lawson, W.A., Henden, A.A. 2007, MNRAS,375, 301
- de Laverny & Mekarnia (2004) de Laverny, P., Mekarnia, D. 2004, A&A,428, L13
- Disney (2000) Disney, M.J. 2000, General Relativity and Gravitation, 32, 1125
- García-Hernándezet al. (2009) García-Hernández D.A., Hinkle, K.H., Lambert,D.L., Eriksson, K. 2009, Ap.J., 696, 1733
- Geballe, Rao & Clayton (2009) Geballe, T.R., Rao, N.K., Clayton, G.C., 2009, Ap.J., 698, 735
- Geballe (2008) Geballe, T.R., 2008, (personal communication)
- Herwig (2001) Herwig,F. 2001, Ap& SS, 275, 15
- Iben & Tutukov (1984) Iben, I.Jr., Tutukov, A. 1984, Ap.JS, 54, 355
- Iben et al. (1983) Iben, I.Jr., Kaler, J.B., Truran,J.W., Renzini,A. 1983, Ap.J, 264, 605
- Johansson (1965) Johansson, L.1965, Arkiv f. Fysik, 31, 201
- Keenan & Greenstein (1963) Keenan, P.C., Greenstein, J.L., 1963, Perkins Obs. Contr. Ser. II, no. 13
- Kroto (2009) Kroto, H. 2009, in ed Jaan Laane.,Frontiers of Molecular Spectroscopy, Elsevier(publisher), 1
- Loreta (1934) Loreta, E. 1934, A.N, 254, 151
- Merrill (1952) Merrill, P. W., 1952, ApJ, 116, 21
- Merrill et al. (1963) Merrill, P. W., 1963, in ‘Space Chemistry’, Univ. of Michigan press, Ann Arbor
- O’Keefe (1939) O’Keefe, J.A. 1939, Ap.J, 90, 294
- Pandey (2006) Pandey, G., 2006, Ap.J, 648, L143
- Pandey, Lambert & Rao (2008) Pandey, G., Lambert, D.L., Rao, N.K. 2008, Ap.J, 674,1068
- Pandey et al. (2006) Pandey, G., Lambert, D.L., Jeffery, C.S., Rao, N.K. 2006, ApJ, 638, 454
- Pugach (1977) Pugach, A.F., 1977, IBVS, 1277
- Rao (2008) Rao N.K. 2008, in Werner,K., Rauch,T., eds., Hydrogen Deficient Stars, ASPC,391, 25
- Rao & Lambert (2000) Rao N.K., Lambert D.L., 2000, MNRAS, 313, L3
- Rao & Lambert (2008) Rao N.K., Lambert D.L., 2008, MNRAS, 384, 477
- Rao et al. (1999) Rao N.K., Lambert D.L., Adams, M.T., Doss, D.R., Gonzalez, G., Hatzes, A.P., James, R., Johns-Krull, C.M., Luck, R.E., Pandey, G., Reinsch, K., Tomkin, J., Woolf, V.M. 1999, MNRAS, 310, 717
- Rao, Lambert & Shetrone (2006) Rao, N.K., Lambert, D.L., Shetrone, M.D. 2006, MNRAS, 370, 941
- Renzini et al. (1990) Renzini, A. 1990, in Cacciari,C., Clementini,G., eds., Confrontation Between Stellar Pulsation and Evolution, ASPC, 11, 549
- Saio & Jeffery (2002) Saio, H., Jeffery, C.S. 2002, MNRAS, 333, 1210
- Schonberner (1979) Schönberner, D., 1979, A&A, 103, 119
- Tisserand et al. (2008) Tisserand, P. et al., 2008, A&A, 673
- Warner (1967) Warner, B., 1967, MNRAS, 137, 119
- Webbink (1984) Webbink, R.F. 1984, Ap.J, 277, 355
- Woitke et al. (1996) Woitke, P., Goeres, A., Sedlmayr, E., 1996, A&A, 313, 217