11email: jesscobrien@gmail.com; kcf@mso.anu.edu.au⋆ 22institutetext: Kapteyn Astronomical Institute, University of Groningen, P.O. Box 800, 9700 AV Groningen, the Netherlands
22email: vdkruit@astro.rug.nl††thanks: For correspondence contact Ken Freeman or Piet van der Kruit
The dark matter halo shape of edge-on disk galaxies
Abstract
Context. This is the third paper in a series in which we attempt to put constraints on the flattening of dark halos in disk galaxies. We observed for this purpose the HI in edge-on galaxies, where it is in principle possible to measure the force field in the halo vertically and radially from gas layer flaring and rotation curve decomposition respectively. For this purpose we need to analyse the observed XV diagrams in such a way as to accurately measure all three functions that describe the planar kinematics and distribution of a galaxy: the radial HI surface density, the rotation curve and the HI velocity dispersion. In this paper, we first present the results of the modelling of our HI observations of 8 HI rich, late-type, edge-on galaxies. We find that in all of these we find differential rotation. Most systems display HI velocity dispersions of 6.5 to 7.5 km s-1 and all except one show radial structure in this property. There is an increase in the mean HI velocity dispersion with maximum rotation velocity, at least up to 120 km s-1.
Next we analyse the HI observations to derive the radial variation of the thickness of the HI layer. The combination of these gas flaring measurements with the HI kinematics measurements allow us to measure the total vertical force of each galaxy assuming hydrostatic equilibrium. We find that with the exception of the asymmetric IC5052, all of the galaxies in our sample are good candidates for 3D mass modelling to measure the dark halo shape. The flaring profiles are symmetric with respect to the galactic centres and have a common shape, increasing linearly inside the stellar disks and exponential outside where the gravitational potential is dominated by the dark halo. In the best example, UGC7321, we find in the inner regions small deviations from the midplane and accompanying increases in thickness of the HI layer that are possibly a result of perturbations of the gravitational field by a relatively strong bar.
Aims.
Methods.
Results. Conclusions. galaxies: structure; galaxies: kinematics and dynamics; galaxies: halos; galaxies: ISM
1 Introduction
In paper I in this series (O’Brien et al., 2010a) we presented HI observations of a sample of 8 edge-on, HI rich, late-type galaxies. The aim of the project has been described there in detail. Briefly, we attempt to put constraints on the flattening of dark halos around disk galaxies by measuring the force field of the halo vertically from the flaring of the HI layer and radially from rotation curve decomposition. For the vertical force field we need to determine in these galaxies both the velocity dispersion of the HI gas (preferably as a function of height from the central plane of the disk) and the thickness of the HI layer, all of these as a function of galactocentric radius. In addition we also need to extract information on the rotation curve of the galaxy and the deprojected HI surface density, also as a function of galactocentric radius. To adequately constrain the halo shape these parameters needed to be measured out to as low surface densities as possible.Here we present the determination of these properties from our HI observations.
In order to resolve the vertical structure, we selected a sample of nearby, HI rich, late-type edge-on galaxies which are likely to exhibit large HI flaring expected from high dark matter fractions. From paper I, we recall that the gradient of the force field in the vertical direction for a Gaussian gas layer can be written as
| (1) |
where is the vertical velocity dispersion of the gas and FWHMz,g the gas layer thickness. Using the flaring of the HI distribution and the derived density distribution of the gas and stellar distributions, it is possible to measure the halo shape over the HI extent of the luminous disk. For a given vertical gas velocity dispersion, the flaring will decrease and the gas surface density will increase, for increasingly flattened dark halos. Thus, in gas-rich late-type galaxies it is possible to measure the force field of the halo vertically from the gas layer flaring and radially from rotation curve decomposition.
In the second paper (O’Brien et al., 2010b), paper II, we presented a new method to accurately determine the rotation curve, deprojected HI surface density and velocity dispersion at all radii in a edge-on gas disk. The superposition of velocity profiles from many radii in each sightline through an edge-on HI disk tends to cause an overestimate of the velocity dispersion with most measurement methods (see paper II). Measuring the radial flaring profile requires a model of the galaxy rotation and face-on surface density; this also necessitates high accuracy rotation curve measurement and HI surface density deprojection.
In this third paper we present the rotation curve, HI velocity dispersion and deprojected HI surface density from the XV maps measured using the iterative XV diagram modelling program (see paper II). Previously, measurement of these parameters in edge-on galaxies has been difficult. Indeed, the gas velocity dispersion has been measured as a function of radius in only one edge-on galaxy NGC4244 (Olling, 1996a). If the data have suffiently high S/N, then our iterative XV modelling program is capable of deriving the variation of rotation, velocity dispersion and density as a function of both radius and height above the equatorial plane of these edge-on galaxies. For the data described in paper I, the S/N is not high enough to derive the variations in both and . We use the XV diagrams integrated over , and measure the gas surface density distribution and kinematics as a function of radius only, assuming that the gas velocity dispersion is isotropic and vertically isothermal.
2 Results for kinematic modelling
For each galaxy in our sample we present the best fit measurements of the radial kinematics, and show the map of the residuals formed by comparing the model XV diagram to the observed XV map. These XV maps were formed by integrating the observed HI channel maps over the axis.
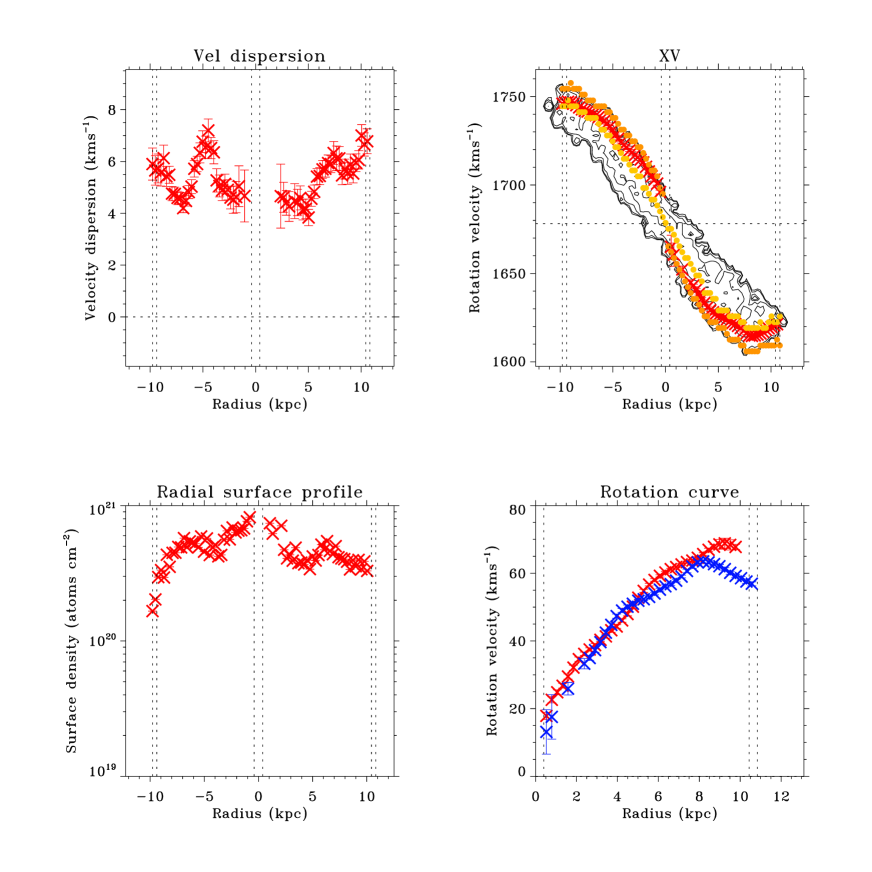
2.1 ESO074-G015 (IC5052)
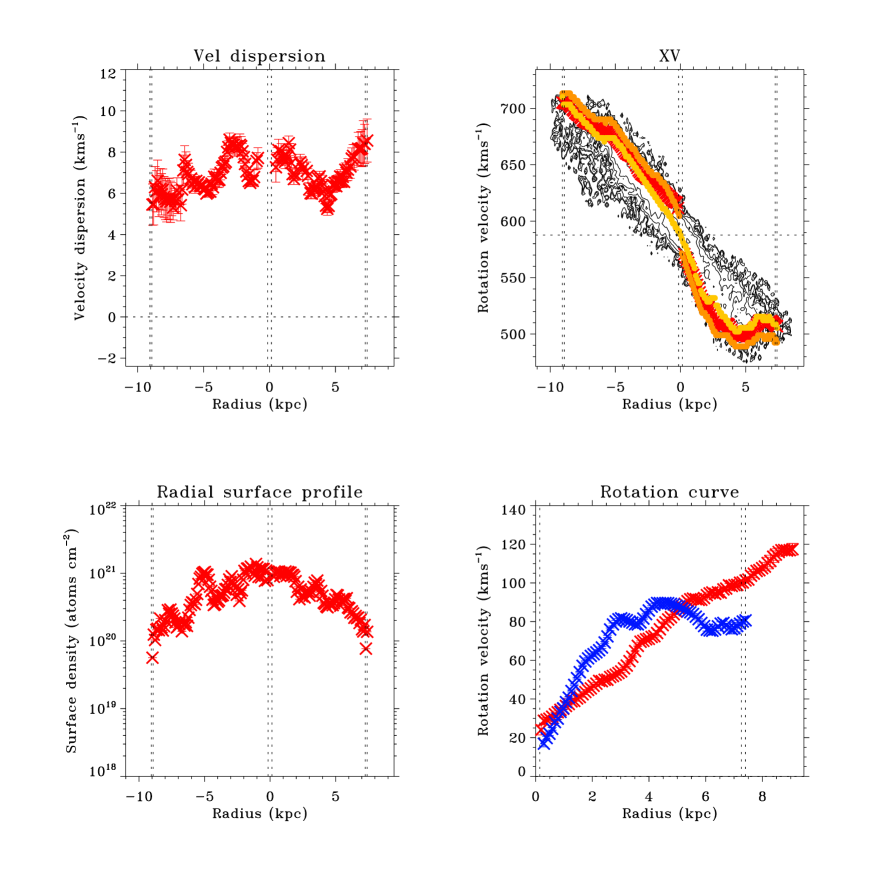
Although ESO074-G015 is one of the nearest edge-on low mass galaxies, it is a galaxy less suitable for dark halo fitting because it is asymmetric in both the HI and optical distribution. Furthermore, it shows a bright star formation region kpc west of the galactic center with associated radio continuum emission, indicating a possible regional deviation from hydrostatic equilibrium. The measured rotation curve (see Fig. 1) also shows a large asymmetry which is unlikely to be solely due to the HI warp. Given the irregular optical distribution, it is more likely to indicate a non-axisymmetric mass distribution commonly found in Magellanic dwarf galaxies. The centre of mass was poorly determined in IC5052 due to the irregular structure of the XV distribution.
Despite the apparent mass asymmetry, the HI velocity dispersion is roughly constant at 6-7 km s-1. Similarly the HI radial profile is reasonably symmetric, although it displays a broad plateau in the bright star formation region on the west side. As the channel maps clearly show vertical flaring of the HI layer, we will proceed with the flaring analysis for this galaxy. However, the gross kinematic asymmetry precludes it from use in the hydrostatic analysis to determine the shape of the dark matter distribution.
2.2 ESO109-G021 (IC5249)
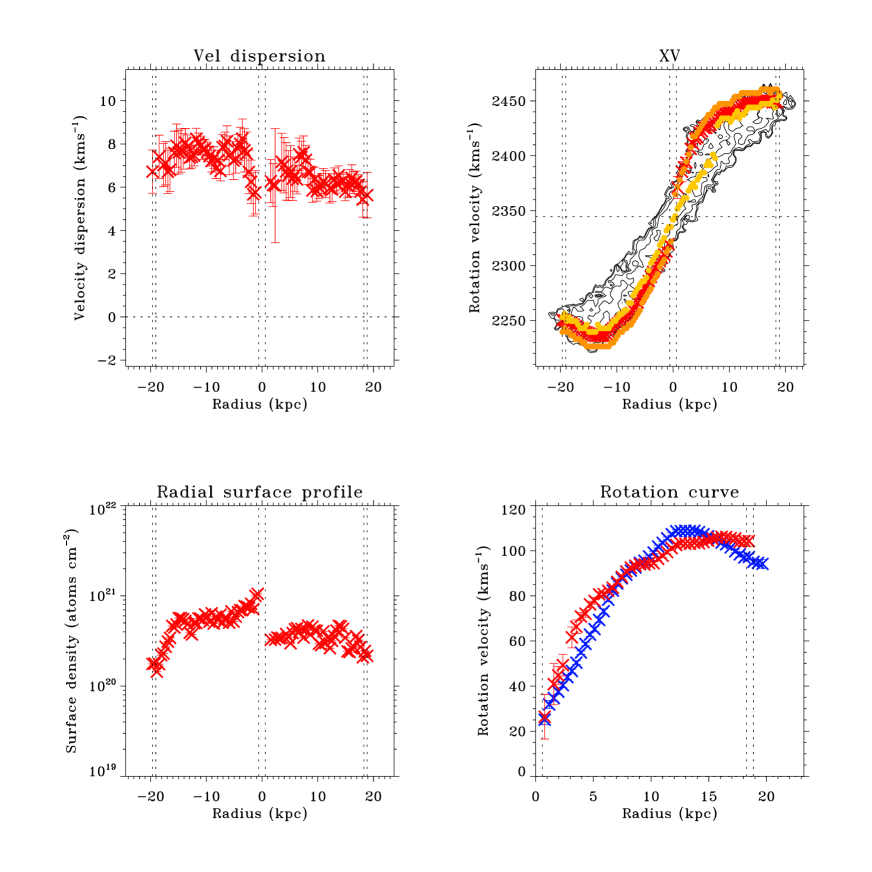
ESO109-G021 (IC5249) is one of several well-known “superthin” galaxies, renowned for the large optical axial ratio. The rotation curve shown in Fig. 2 shows that ESO109-G021 has a maximum rotation speed of km s-1. ESO109-G021 is the only one of the galaxies in our sample with rotation speeds larger than km s-1 that does not show the “figure-8” signature in the HI distribution indicative of a possible bar.
The measured HI radial surface density has a shallow gradient with dips at around 11-12 kpc in agreement with the features in the deprojected surface density obtained by van der Kruit et al. (2001). However these authors also measured a central HI depression, while we find a small central peak when measuring from the left-hand side and a plateaued central surface density when measuring from the right-hand side. The deprojected surface density was measured after folding the observed surface density calculated from the XV map about the galactic center.
One possible explanation for the discrepancy between our measured surface density and that of van der Kruit et al. (2001), is the lower sensitivity of their observations. In addition to the hr 6.0C ATCA observation used by all parties, we acquired an additional hr of HI synthesis observations spread over the ATCA EW352, 750D and 6.0A array configurations. This resulted in a peak signal-to-noise of and a synthesised beam FWHMθ of ″ in the XV map, which appears to be a significantly higher sensitivity and spatial resolution than that acquired by van der Kruit et al. (2001).
The measured rotation curve is reasonably symmetrical, in agreement with that obtained by van der Kruit et al. (2001) which was derived by modelling the XV distribution using the fixed velocity dispersion XV modelling method of van der Kruit (1981, see also Sect.2.5 in paper II). Like that of van der Kruit et al. (2001), our measurement shows a steep inner rise — as opposed to the earlier less accurate measurements by Abe et al. (1999) which appear to have been measured from the peak flux ridge of the XV map.
The measured HI velocity dispersion varies from to km s-1, falling to lower values on the right-hand side of the galaxy. The mean HI velocity dispersion of km s-1is in agreement with the best fit value of km s-1 found by van der Kruit et al. (2001).
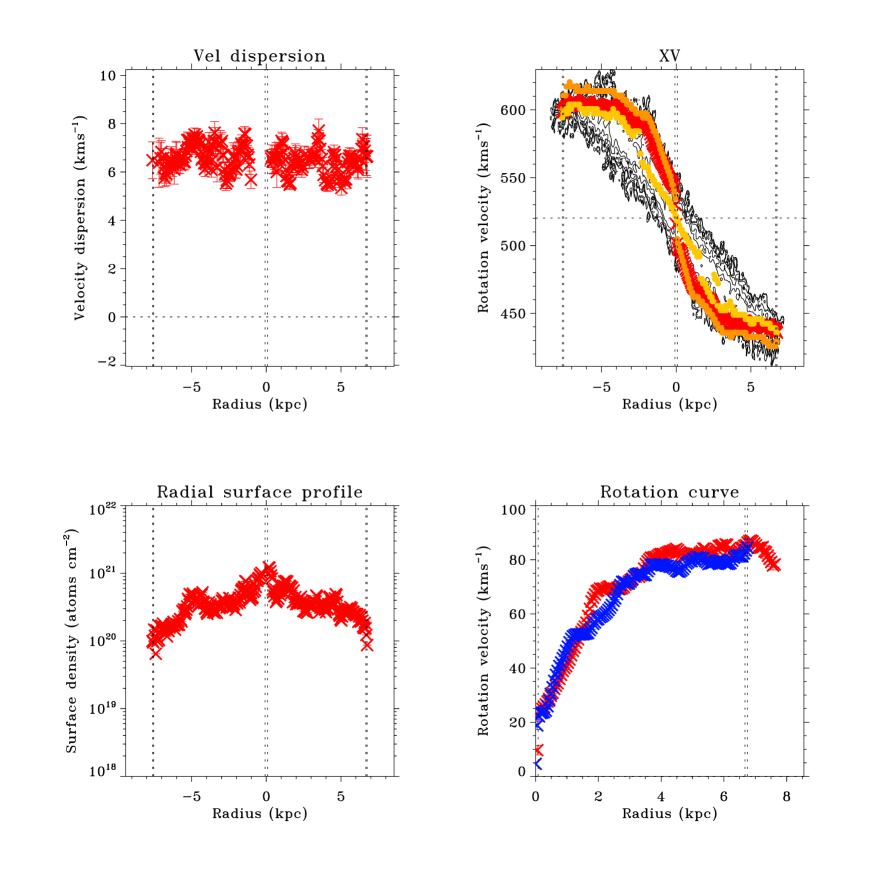

2.3 ESO115-G021
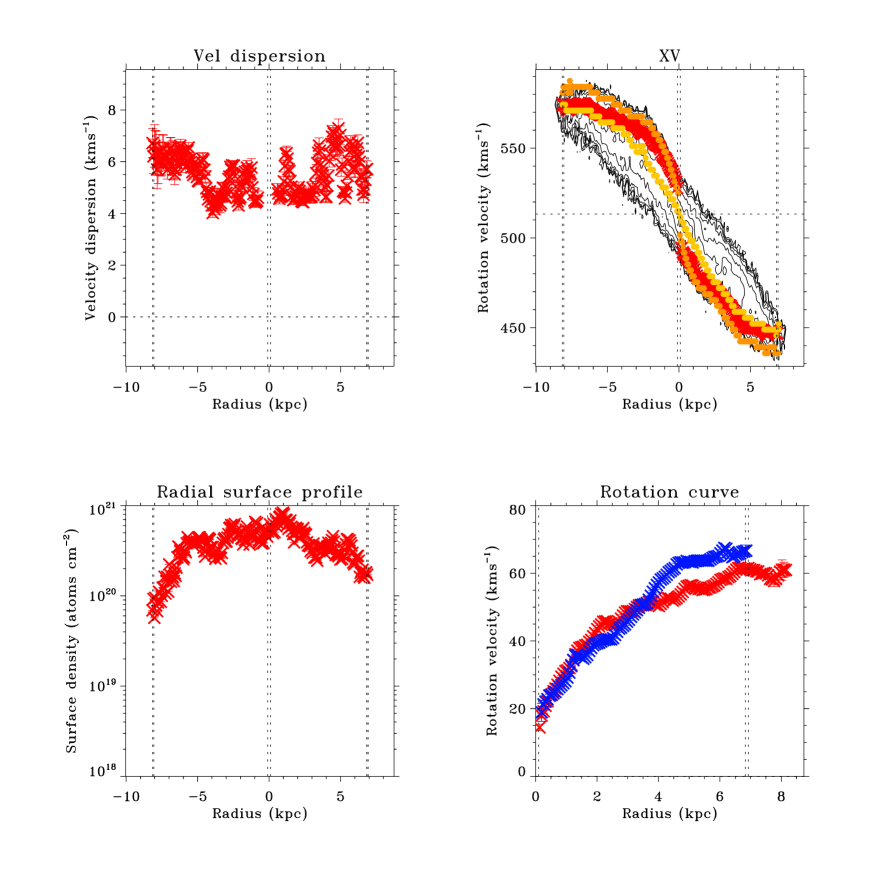
The high resolution HI imaging of ESO115-G21 yields an almost solid-body rotation curve flattening out at a radius of 5-6 kpc at a peak rotation speed of approximately km s-1 (see Fig. 3). Like the other small galaxies in our sample it shows steep inner rotation unlike the solid body rotation commonly obtained from low resolution studies of small galaxies. Despite an apparently accurate rotation curve fit there is still significant flux in the residual in the part of the XV diagram containing flux at large radii. This appears to be due to an underestimate of the HI surface density and the velocity dispersion at large radii.
The measured HI velocity dispersion is surprisingly low at only 4.5-6 km s-1 at radii within kpc from the galactic centre. This galaxy displays particularily bright HI emission in the inner 2-3 kpc, with a brightness temperature K. The low measured velocity dispersion and high brightness temperature are consistent with a partially opaque inner HI disk. In the face-on galaxy NGC1058, Petric & Rupen (2006) found regions of HI velocity dispersion as low as km s-1 — indicating cold low velocity dispersion HI on scales of at least pc which is quite large compared to typical star formation scales in the ISM. Given the large beamwidth of kpc of the NGC1058 HI observations, it is likely that smaller regions of even lower velocity dispersion gas exist in NGC1058. In ESO115-G021, regions with a HI velocity dispersion of km s-1 occur on radial scales of kpc, similar to the cold gas distribution in NGC1058.
2.4 ESO138-G014
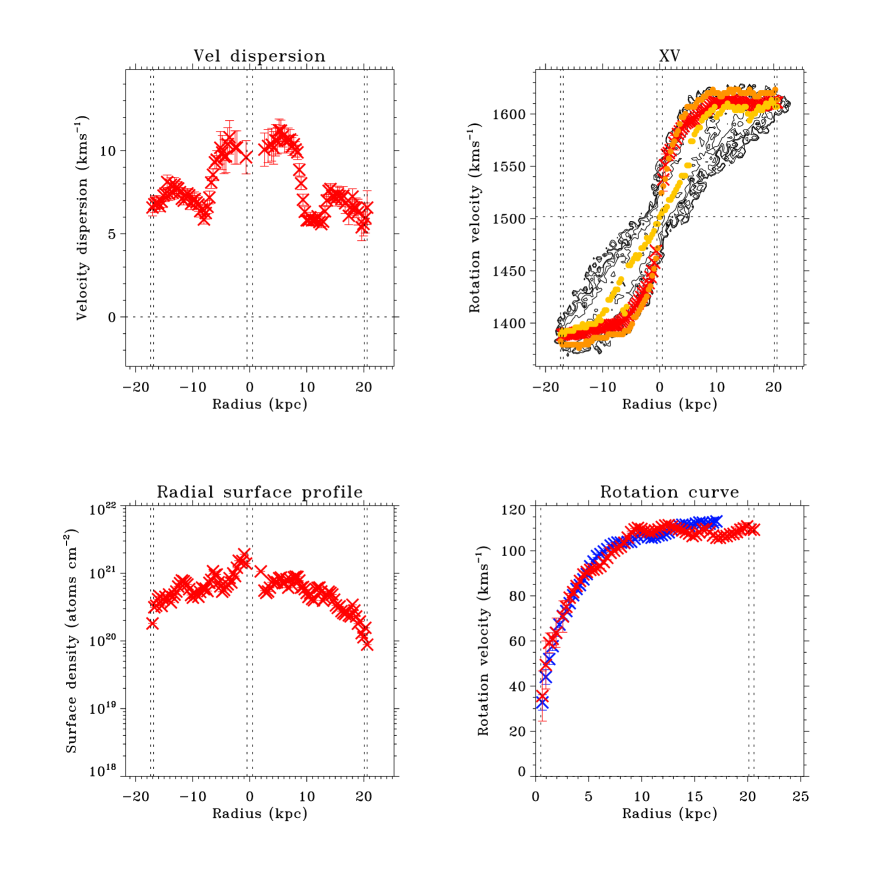
ESO138-G014 is a relatively large Sd galaxy with a HI disk extending to kpc, and a maximum rotation speed of km s-1 (see Fig. 4). The rotation curve is clearly differential, rising steeply in the innermost kpc, then starts to flatten outside of kpc from the galactic centre. As noted in paper I, the XV map displays a faint “figure-8” signature, indicating a possible bar.
The HI velocity dispersion is approximately km s-1 at radii outside of kpc. At radii inside of kpc, the HI velocity dispersion rises steeply to a plateau of 10-11 km s-1 within kpc radii.
The HI radial profile is roughly constant within 9 kpc from the centre, except for central peak within 2 kpc radius. The large central plateau spans the same radial domain as the increased velocity dispersion and could be explained by radial streaming in the bar causing redistribution of the gas. As explained in Sect. 4.4, we will leave this galaxy out of the discussion because of missing short spacings and a poorly determined flaring profile of the HI layer.
2.5 ESO146-G014
ESO146-G014 is another small Sd galaxy similar to ESO115-G021 with a particularly low HI velocity dispersion of 4.5 km s-1 at radii less than kpc. At larger radii, the mean velocity dispersion is km s-1, with a peak of km s-1 at kpc west of the galactic centre. This high velocity dispersion region on the west side corresponds to a kpc wide bright overdensity in the B-band optical image, and to a kpc gap between bright HI regions in the HI total intensity map (see paper I, Fig. 5a).
The rotation curve of ESO146-G014 peaks at only km s-1 and is quite symmetric about the galactic centre, particularly within radii of kpc. The HI surface density shows a bright central peak, a plateau from to kpc radius, after which it declines steeply on the left-hand side, and less so on the right-hand side.
2.6 ESO274-G001
ESO274-G001 is the closest galaxy in our sample at a distance of only Mpc. This allowed the km maximum baseline of the ATCA to yield an exceptionally small HI synthesised beam of pc. Thus despite the small radius of only 7-8 kpc, each side of the galaxy is spanned by over 47 independent beams. Using a beam sampling of 3 pixels per beam, approximately 150 kinematic fits are obtained on each side of the galactic centre.
The measured kinematics shown in Fig. 6 display a differentially rotating galaxy with a maximum rotation speed of only km s-1. This rotation velocity shows that ESO274-G001 is a small galaxy with a rotation curve that continues to rise until the outermost kpc. The -level envelope fitting method overestimates the rotation speed by up to 10-15 km s-1, while the peak flux method dramatically underestimates it by up to . The HI surface density is reasonably symmetric, with a central peak within kpc, and a plateau to kpc on the left-hand side and kpc on the right-hand side, declining to an HI surface density of 7-8 atoms cm-2. The HI velocity dispersion at km s-1shows no systematic trend with radius, with small oscillations of only km s-1 around this value, throughout the HI disk.
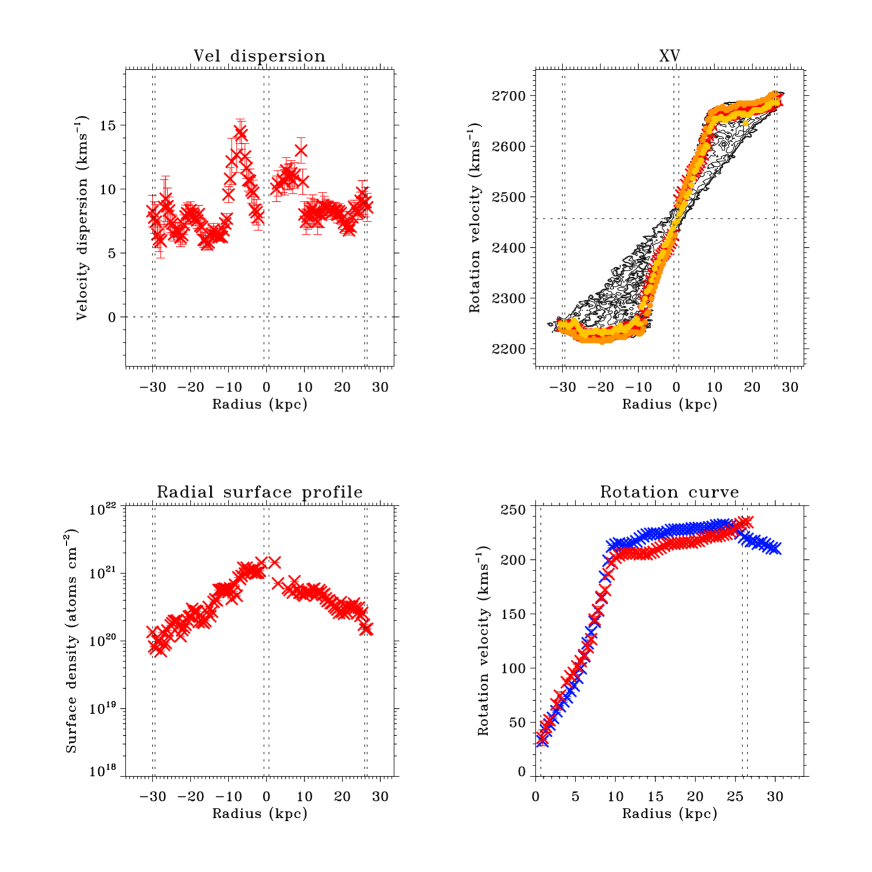
2.7 ESO435-G025 (IC2531)
ESO435-G025 is the only Sc galaxy in our sample and more massive than the next largest galaxy by a factor of four. The rotation curve displays an unusual concave shape (see Fig. 7) indicating a dip in the gradient of rotation. ESO435-G025 was one of the first detections of a bar in an edge-on galaxy (Bureau & Freeman, 1999). Despite the bar, the measured kinematics are an excellent representation of the galaxy. The inner rotation of IC2531 is similar to that of NGC891, however lacking gas tracing an inner ring, seen in both HI (Swaters et al., 1997) and CO (Tony Wong, private communication). It is quite possible that like NGC891, the inner galaxy of ESO435-G025 is largely populated by molecular gas in the inner disk (Wong, Blitz & van der Hulst, 2004).
ESO435-G025 is the most distant galaxy in our sample and with a low peak signal-to-noise of in the XV map, and particularly low signal-to-noise in the parts of the XV diagram with radii less than kpc. Unfortunately, the signal-to-noise in the inner galaxy was too low to deconvolve for the effect of the HI beam (FWHM kpc) while modelling the XV diagram. As a result the HI surface density is probably overestimated at radii within kpc where the gradient of rotation over each beamwidth is large. The measured HI velocity dispersion displays a significant peak and central trough, which is largely an effect of beam smearing. At radii outside kpc, where the beam smearing effect is minimal, the HI velocity dispersion has a mean of km s-1. To compensate for the inability to properly measure the velocity dispersion inside of kpc, we adopt a smooth central velocity dispersion rising from km s-1 at kpc radius to km s-1 in the centre. Inside of kpc we adopt a central plateau for the HI surface density, but we flag that the derived properties within 10 kpc should be treated with caution.
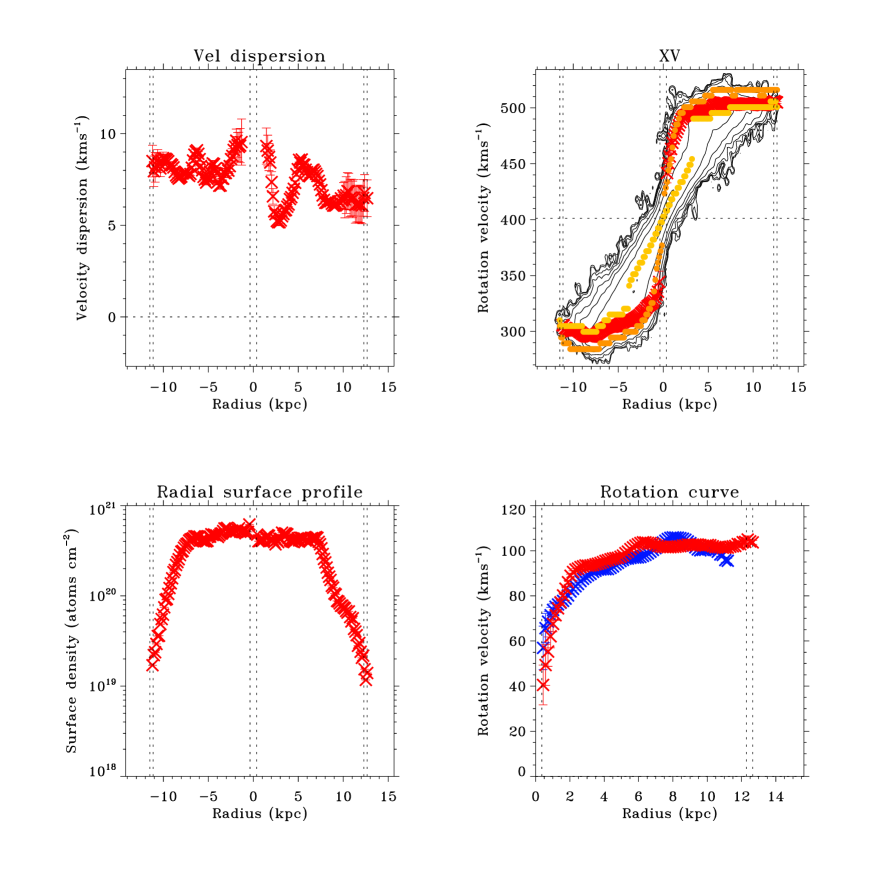
2.8 UGC7321
The HI bar of UGC7321 causes a significant distortion in the peak flux of the XV distribution. The effect of non-circular motions in the bar causes a deviation in the projected rotation of gas rotating in the bar. The XV modelling is able to recover the azimuthally averaged surface density, and rotation (Fig. 8); however, it is unable to fit the non-axisymmetric gas in the bar, as can been appreciated from Fig. 2, which shows the observed, model and residual XV diagrams. Orbits in a barred potential have been studied by Contopoulos & Mertzanides (1977), who found that there are two families, where the main orbit family is designated (see also Binney et al., 1991). On the left-hand side of the galactic centre, the orbit showing the near and far side of the bar is clearly apparent in the residual map. The residual structure on the right-hand side of the galactic centre is less clear.
The peak flux in the orbits of the residual is of the peak flux of the observed XV diagram. To ascertain the likely surface mass density perturbation caused by the bar, we inspected the K band azimuthal flux profile of the bars in several late-type face-on galaxies with weak bars. If one assumes a significant fraction of the brightness variation is biased by young stars contributing to the bar, galaxies with a relatively weak, diffuse bar are unlikely to have a difference of stellar surface density between bar and inter-bar regions greater than (for example, the Sc galaxy NGC2525). Photometry of UGC7321 by Pohlen et al. (2003) shows that the stellar bar is very faint and thin, indicating that minimal buckling of the bar has occured. The thin stellar bar of UGC7321, and the small HI mass fraction in the bar suggest that the inner mass density perturbation is quite low, and unlikely to significantly effect the halo mass modelling.
3 The flaring of the HI layer
There have been few attempts to directly measure the flaring of the HI layer in galaxies. With the exception of Olling’s study of NGC4244 (Olling, 1996a) and an earlier less sensitive study of NGC5023 (Bottema et al., 1986), all the flaring measurements were undertaken on massive Sb-Sc galaxies. It is particularly difficult to measure the flaring in large galaxies, as such galaxies are expected to have higher disk surface densities and consequently thinner gas layers. For gas in hydrostatic equilibrium the FWHM of the HI is inversely proportional to the maximum rotation velocity (Eqn. (D31) of Olling, 1995)
| (2) |
so large galaxies with max rotation speeds similar to the Milky Way, will only flare to of the height of small galaxies like ESO146-G014, given similar HI vertical velocity dispersions . Most of these previous HI flaring measurements of large galaxies were undertaken around 20 years ago, with larger telescope beams and poorer sensitivity resulting in partial resolution of the FWHMz vertical thickness of the gas layer.
One of the first measurements of the gas layer thickness in an external galaxy was the early low resolution WSRT study of NGC891 by Sancisi & Allen (1979). This data were re-analyzed by van der Kruit (1981). These authors found that the vertical thickness of the HI layer was unresolved by the kpc beam in the inner parts ( kpc) and increased to kpc at the outermost measured point of kpc. Using deeper higher resolution VLA data with synthesised beam FWHMθ of and kpc respectively for NGC4565 and NGC891, Rupen (1989) found that the gas thickness increased exponentially with radius, although NGC891 displays substantial scatter. This is due to a low channel map peak signal-to-noise of in the NGC891 HI cube, compared to in the NGC4565 dataset. This result is consistent with the thickness of the gas layer in our Galaxy, which is also found to increase exponentially from pc near the Galactic Centre to kpc at 20 kpc (Merrifield, 1992). Meanwhile, Braun (1991) fitted the gas thickness of M31 with an exponential profile and found that the gas thickness increases roughly linearly from a scale height of pc at kpc radius to pc at kpc.
The most accurate measurement of HI flaring was obtained for the small Scd galaxy NGC4244 by Olling (1996a) who found that the FWHMz thickness increased from pc at kpc radius to kpc at kpc radius, with uncertainty ranging from pc at inner radii to 200-500 pc at the outermost measured point. These were by far the most sensitive high resolution observations obtained, with hrs of VLA data spread over B, C and D arrays, resulting in a FWHMθ of pc. The only other small galaxy that has been observed is the Scd NGC5023 imaged at the WSRT with a spatial resolution of 650 pc (Bottema et al., 1986). These authors find a constant thickness of kpc despite the fact that their Fig. 4 appears to show an increase of thickness from to kpc, particularly on the east side. However the spectral resolution of km s-1 available on the WSRT at the time was a little coarse given the low maximum rotation speed ( km s-1) of NGC5023. This low spectral resolution and the low signal-to-noise of the observations would have increased the uncertainty in their radial flaring profile.
3.1 Methods used to measure the vertical gas thickness
Several methods have been used to measure the vertical flaring of high inclination galaxies. The gas disk thickness must be measured from individual channel maps, rather than from the total HI column density map, as the latter measures the thickness of the integrated flux. If the HI distribution is well resolved by the telescope beam, measuring the gas thickness from channel maps is elementary. The challenge lies in deprojecting the measurements from the projected radius of each measurement to the galactocentric radius. In each method below, the measured FWHMz vertical thicknesses are corrected for the spatial resolution of the beam (see Eqn. (3) below).
The most common method used to determine the radial flaring profile is to fit the vertical thickness of just the extreme velocity channel maps along each line of sight. This provides an accurate measurement of the flaring in the outer disk if the rotation curve is flat over this radial domain. If gas in the extreme velocity channel maps is emitted from a narrow azimuthal range around the line of nodes, then the gas fitted by a vertical profile at each projected radius is emitted from a narrow radial range, allowing the radius of each thickness measurement to be approximated by the major axis distance . This method was used in the early flaring measurements of NGC891 (Sancisi & Allen, 1979; Rupen, 1989), NGC4565 (Rupen, 1989) and NGC5023 (Bottema et al., 1986).
Unfortunately this deprojection approximation can often miscalculate the radial shape of the flaring profile. This occurs in less differentially rotating galaxies, as the radial range of gas emission is larger along each line of sight through the extreme channel maps. Also, less massive galaxies with shallower rotation curves will have a smaller major axis extent spanned in the outer velocity channels and the radial domain where the rotation curve is most flattened may not be where the gas disk flares. The other disadvantage is that the vertical thickness at each radius is measured only twice, once on either side of the galaxy. Another problem is that the gas thickness is only measured at radii with flux in the edge channel maps. In a large galaxy with a flat rotation curve, these channel maps will probe most of the radial extent of the galaxy, however in a less massive galaxy with a less steep inner rotation curve, the radial span of the outer channel maps is much less.
The analysis of van der Kruit (1981) of the NGC 891 data of Sancisi & Allen (1979) involves matching the observed XV map to a simulated XV formed with different assumed values of gas thickness and flaring. This study also involved an investigation into the effects of small residual inclinations away from purely edge-on.
The technique used by Braun (1991) to measure the flaring of the inclined galaxy M31 was more complicated. Braun used the fitted inclination and rotation curve to fit the vertical thickness of HI features in the spiral arms.
In the next section, we present the method which we have developed to accurately deproject the projected radius to the galactocentric radius for each vertical thickness measurement, and correct the measured thickess for the spatial resolution of the telescope along the axis. As our method fits the vertical gas thickness in all channel maps with sufficient flux, the number of measurements at each radius produces a more reliable radial flaring profile, and also allows the flaring profile to be measured at radii much closer to the galactic center. Our method is very similar to that used by Olling (1996a); however, we only allow for warps of the HI disk in the plane of the sky.


3.2 Gas flaring measurement by iterative HI cube modelling
The FWHM thickness of the HI disk was determined by fitting a Gaussian to each vertical slice across the galaxy major axis in each HI channel map, enabling the gas layer thickness to be measured independently on each side of the galactic centre. To facilitate vertical thickness measurements, each HI cube was rotated in the plane of the sky to align the galaxy major axis with the axis, ie. cube axes , (see Sect. 6 of paper I for rotated HI cubes for each galaxy). The measured FWHM thickness is corrected for the effect of the beam by
| (3) |
to obtain the actual gas thickness FWHMz,HI, where the FWHM of the telescope beam is denoted by FWHMθ. For simplicity, hereafter we use FWHMz to refer to the beam-corrected HI gas thickness.
The projected radius was deprojected to the galactocentric radius using the kinematics measured from the XV map in Sect. 2 to identify the galactocentric radius that contributes emission at the projected radius and line-of-sight velocity of the channel map being measured. This was facilitated by building a “face-on” HI cube that showed the HI distribution in the equatorial plane (where is the projected radius and is the distance in the line-of-sight) of the emission in each observed line-of-sight velocity. For each galaxy a face-on HI cube was built using the radial kinematics determined in Sect. 2.
To simulate the observational effects of the telescope, the face-on HI cube was convolved by the FWHM of the telescope beam along the axis. In order to account for the intrinsic HI velocity dispersion and the finite spectral resolution, the spectral axis of the face-on HI cube was convolved by a 1D point-spread-function with total velocity dispersion equal to
| (4) |
where is the radial HI velocity dispersion measured in Sect. 2 and FWHMv,ch is the spectral resolution of the telescope correlator. The telescope signal response function is a sinc function, which has a FWHMv,ch of times the width of the correlator channels.
The intensity-weighted velocity fields of the face-on HI cubes were calculated for each galaxy. These velocity fields provide a representation of the galactocentric radii contributing flux to each major axis slice of the actual observed HI cubes.
Each channel map of the face-on HI cube was masked by the maximum radius of HI emission on each side of the galaxy. Next the galactocentric radius at each projected radius of a channel map was derived by taking the intensity-weighted mean of the galactocentric radii of all points along that projected radius in the face-on channel map, where the intensity weights are the HI flux at those positions. This process was used to find the weighted mean galactocentric radius corresponding to the major axis position of each vertical thickness measured from the actual observed HI cubes.
The FWHM was determined from the average of all the FWHMz fitted at that galactocentric radius. The number of channel maps with emission from any one galactocentric radius usually ranged from one to , as dictated by the galaxy kinematics and the resolution of the observations. Galaxies with flatter rotation curves enabled a greater number of measurements for each galactocentric radius. Higher spectral resolution relative to the HI velocity dispersion caused the HI emission at each galactocentric radius to be spread over more channel maps. However, increasing the spectral resolution resulted in lower signal-to-noise and fewer fits, as fitting was only possible on vertical slices with at least 4 consecutive points with flux greater than two times the rms noise.
To correct for the scatter in the vertical thickness measurements due to beam-smearing and low signal-to-noise, the whole HI cube fitting process was iterated in a similar manner as that used for the XV modelling algorithm. The known kinematics (from Sect. 2) and the newly measured FWHM flaring fits formed the first model which was used to build a new HI HI cube. The effect of the telescope observation was simulated by convolving the HI cube spatially by the telescope synthesised beam and spectrally by total velocity dispersion (defined in Eqn. (4)). The model HI cube was then fitted, and the fits to the model HI cube compared to the fits of the actual observed HI cube. This cycle was iterated, with all kinematics except the flaring held fixed, until FWHM fits to the model HI cube matched the FWHM fits of the actual observed HI cube to within of the FWHM of the telescope beam along the axis or until the total difference in fits stopped decreasing. The best fits were usually obtained after 3-4 iterations.
This iterative flare fitting method was tested under various conditions on synthetic galaxy observations. Simulations showed that high signal-to-noise observations could be corrected for beam smearing to within 5-10% of the FWHM beam size along ; however, lower signal-to-noise observations with large beams were somewhat limited with a FWHMz uncertainty of of the FWHM beam size along . Although the flare fitting algorithm does accurately correct for the projection and beam-smearing of the HI distribution, the final FWHMz accuracy is naturally still dependent on the adequate signal-to-noise of the HI data cube.
4 Results for flaring profiles
For each galaxy in our sample we present the best fit measurements of the FWHMz thickness of the HI disk as a function of radius, derived independently on each side of the galaxy. The measured thickness along each major axis slice of the HI channel maps was undertaken using the kinematics measured by XV modelling in Sect. 2. The error bars shown on the flaring profiles in this section are the 1 errors of the Gaussian fits.
We were able to measure the HI flaring to radii within 1-2 kpc of the maximum radius at which the other HI kinematics were measured. This was a particularily impressive result considering that the signal-to-noise of most vertical slices was only 3-5. The average HI cube peak signal-to-noise was only , except for UGC7321, which had almost 6 times the signal-to-noise of the other galaxies. Analysis of the vertical shape of the HI distribution in UGC7321, facilitated by the high sensitivity observations, found unexpected azimuthal variations in the gas thickness and midplane displacement of this edge-on galaxy. These surprising results for UGC7321 are presented in Sect. 4.8.


4.1 ESO074-G015 (IC5052)
The FWHMz vertical thickness of ESO074-G015 expanded from FWHM kpc at a galactocentric radius of kpc to FWHM kpc at kpc, with an additional thicknesses of and kpc measured at the edge of the HI disk at radii 8.0-8.1 kpc (Fig. 3). These outermost two measurements are consistent with the flaring shape of the disk, but the measurement has a large uncertainty of 0.5-0.6 kpc and were only measured in one channel map of the HI data cube. The flaring at kpc comprises the warped eastward extension at a radius of ′ in the HI column density map (see Fig. 1b in paper I), and is detected as very diffuse edge emission in the outer channel maps on the receding side. The channel maps show the emission at 2 rms noise of atoms cm-2.
The integrated flux of ESO074-G015 was less than that measured from the HI Parkes All Sky Survey (HIPASS) line spectrum obtained from the online HIPASS Public Data Release111http://www.atnf.csiro.au/research/multibeam/release. This suggested that there is additional extended HI emission that was not observed with the long ATCA array configurations. Indeed, a low resolution HI column density map available in the online Local Volume HI Survey (LVHIS222http://www.atnf.csiro.au/research/LVHIS/ic5052/ATCAresults), showed large scale emission around the warped disk extending to 12 kpc. The smallest array configuration observations included in our analysis were low sensitivity snapshot observations with the ATCA array configuration. The LVHIS image was obtained with a hour integration using the ATCA EW367 array configuration. Additional low resolution data of ESO074-G015 may detect HI flaring to thicknesses greater than kpc.
Despite the gross asymmetry of the ESO074-G015 rotation curve, the flaring is remarkably symmetric (see Fig. 3). This HI disk does thicken by 200 pc at radii inside kpc particularly on the east side. This appears to be due to the increased HI velocity dispersion from 6 to 8 km s-1at the same radii, and is more pronounced on the east side. The inner west side of the disk from 2-4 kpc shows intense star formation and radio continuum emission, but the east side is optically more quiescent. The flaring profile is clearly well-resolved by the synthesised HI beam FWHM of pc. However, the low peak signal-to-noise of in the HI data cube restricts measurement of flaring in the faint outer HI disk. Despite being well-resolved spatially, the apparent mass asymmetry indicated by the rotation curve precludes this galaxy from dark halo flattening modelling.
4.2 ESO109-G021 (IC5249)
Like UGC7321, ESO109-G021 is renowned for being a “superthin” galaxy, exhibiting a scalelength-to-scaleheight ratio of . However, although ESO109-G021 has a similar maximum rotation speed to UGC7321, its radial scale is approximately times larger, with a long scalelength of kpc and a sharp stellar truncation at kpc. We find that the HI disk flares from a FWHMz of pc at kpc radius out to kpc at kpc (see Fig. 3.1). The thickness of the gas disk appears to be roughly constant from to kpc and begins to rise exponentially from a radius of 6-7 kpc. The steep flaring of the gas disk at 17-18 kpc is consistent with the edge of the stellar disk.
The gas layer thickness was also been measured by van der Kruit et al. (2001) from the total HI intensity map, as the signal-to-noise of the channel maps was too low as they had only the original hour ATCA 6.0C observation by Carignan & Beaulieu. They found the FWHMz thickness rose from kpc near the centre to kpc at kpc. Our flaring measurements were obtained using an additional hrs of ATCA time split over EW352, 750D and 6.0A array configurations, yielding a peak channel map signal-to-noise of
The HI disk was possibly unresolved at radii less than kpc, as the large synthesis beam of kpc made it difficult to resolve spatial features smaller than 800 pc. An unresolved central gas thickness would explain the relatively thick central gas layer, comparable in thickness to the stellar disk.
4.3 ESO115-G021
ESO115-G021 shows strong flaring (see Fig. 5) from a central FWHMz thickness of kpc to over kpc at the outermost measured point, kpc from the galactic centre. The HI emission of the galaxy extends to a galactocentric radius of kpc on the eastward side; however, this emission is very diffuse and too faint for HI thickness measurement.
The peak signal-to-noise of the channel maps used to measure the flaring was only and the FWHM beam size was pc. Each radial fit was the average of all vertical thickness fits at major axis positions of a channel map that deprojected to this radius. Some thickness measurements were averaged from measurements to 5-7 channel maps; however, most were obtained from two to three channel maps.
Despite the low average HI velocity dispersion of km s-1, the HI disk flares to a vertical HWFMz above the plane of kpc near the HI edge.
4.4 ESO138-G014
ESO138-G014 was the only galaxy in our sample in which it was not possible to satisfactorily measure the HI gas layer thickness. The measured flaring thickness are shown in Fig. 6; however, the derived FWHMz are ballpark estimates only due to missing large scale structure that was not measured with the large ATCA array configurations used. ESO138-G014 and ESO274-G001 were the only two galaxies in our sample with extended HI disks (10′ diameter) for which we were unable to obtain compact array HI observations. Although they both had similar peak channel map signal-to-noise of 15, the low spatial resolution of ESO138-G014 prevented correction of the fitted flaring by iterative modelling. The irregular measured flaring profile, which displays a decreasing disk thickness at radii outside of kpc, is probably due to the missing large scale structure.
Under a constant hydrostatic pressure, a fall in gas thickness of 0.5-1.0 kpc could be explained by a decrease in HI velocity dispersion of 15-30% or 1.5-3.0 km s-1. Although a km s-1 decrease in velocity dispersion is observed between and kpc radius, this decrease is significantly inside the onset radius of the decline in gas layer thickness. Due to the irregular gas flaring profile we decided not to model the dark halo of ESO138-G014.
4.5 ESO146-G014
The HI disk of ESO146-G014 flares dramatically from a FWHMz thickness of kpc at radii of kpc, to FWHM kpc at kpc from the galactic centre (see Fig. 7). The flaring is highly asymmetric around the galactic centre, probably due to the low peak HI cube signal-to-noise of which limited the number of fits at each radius. Despite the noisy data, the measured flaring profile still showed a steep exponential rise from kpc radius to the last measured point at kpc radius. This steep inner flaring, occuring at to stellar scalelengths, is consistent with a low stellar surface density as inferred from the B-band face-on surface brightness of mag arcsec-2 and the low rotation speed. The low stellar surface brightness and large flaring make this galaxy an excellent candidate for measuring the shape of the dark halo.
4.6 ESO274-G001
As mentioned above, the HI imaging of ESO274-G001 is also missing some extended large scale structure due to a lack of HI observations using array configurations shorter than km. This missing structure was clearly apparent in the flaring measurement process as the measurements of the HI cube modeled with the initial measured flaring were much lower than the flaring measured from the observed HI channel maps. The best fit model displayed in Fig. 8 shows that the flaring rises roughly linearly from a FWHMz thickness of pc at less than kpc radius to kpc at kpc radius.
4.7 ESO435-G025 (IC2531)
IC2531 displays a very large outer and remarkably symmetric flare (see Fig. 9), rising from a gas thickness of pc at kpc radius to 3-4 kpc at kpc. The central gas thickness was initially partially unresolved given the FWHMθ beamwidth of , and was decreased to the final thickness by iterating. The large gas thickness uncertainty of between and pc was due to the low peak channel map signal-to-noise of .
4.8 UGC7321
The measured flaring of UGC7321 is our most accurate determination of the flaring in our sample, rising from a FWHMz thickness of pc at a radius of kpc to roughly kpc at kpc from the galactic centre. The hours of VLA time obtained by Matthews enabled the HI channel maps to be imaged with much better sensitivity than that acquired for the other galaxies observed with the ATCA. As a result the error bars on the UGC7321 FWHMz thickness measurements are only 15-50 pc, except in the outermost 2-3 kpc. The relatively flat rotation curve also allowed the flaring at most radii to be independently measured in over 10-20 different channel maps.
The flaring profile of UGC7321 exhibits the high degree of symmetry of the gas thickness about the galactic center as expected for an undisturbed, isolated galaxy. At all radii the flaring profiles are symmetric about the galactic centre to within the bounds of the errors bars (1 errors are pc within a radius of kpc). As the HI velocity dispersion as a function of radius is also very symmetric, this shows that the total vertical force must also be symmetric. Given a symmetric luminous density distribution, this implies that the vertical force and density of the halo are symmetric about the galaxy centre.
The most striking feature of the HI flaring profile of UGC7321 is the change in the shape of the flaring profile near the edge of the stellar disk. In the inner disk the HI thickness appears to increase linearly with radius, while outside the stellar disk it displays an exponential profile. In UGC7321, this “break” occurs at kpc, which is between the stellar truncation radius of kpc (Pohlen et al., 2003) and the maximum stellar disk radius of kpc (Mattthews & Wood, 2003).
The vertical thickness of the HI disk of UGC7321 has also been studied by Mattthews & Wood (2003) who, as in the study of NGC2403 by Fraternali et al. (2002), tried to discern the HI flaring from the HI total intensity map. Mattthews & Wood (2003) found that the best fit to the observed HI total intensity map was achieved using a thin HI disk that flares from a FWHMz of pc at the center to kpc at kpc, and an additional low density halo HI component of constant FWHMz of kpc that lagged behind the disk gas rotation. Mattthews & Wood (2003) parameterised the thin HI disk using . This produced a smooth flaring profile, but lacked the steep exponential increase we measured in gas thickness at radii outside of the stellar disk of UGC7321 and most of the galaxies in our sample (see Sect. 5.4).The addition by Mattthews & Wood (2003) of a low density second gas component with a large constant FWHMz seems to simulate the thick gas layer at the outer radii. The filamentary nature of this structure suggests that it is HI ejecta, originating in the inner disk, rather than a pervasive diffuse thick HI layer. As shown below, our direct flaring measurements of UGC7321 show that the gas layer can be well represented by a single gaussian gas component with a FWHM that varies smoothly with radius: modelling the gas layer thickness by two gas components appears to be unnecessary.
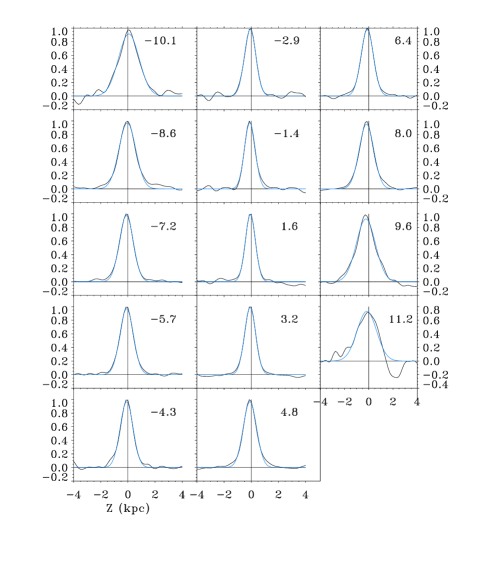
The high signal-to-noise of these observations allowed inspection of the intrinsic shape of the vertical gas thickness. The left-hand panel of Fig. 11 displays the observed vertical profiles in a sample of galactocentric radial bins on both sides of the galactic centre. The profiles show the number of independent measurements in each bin and the flaring of the gas thickness on both sides of the galaxy. In order to inspect the vertical shape more closely, we averaged the profiles in each bin after aligning the profile centres and vertically rescaling all profiles to a peak of (see Fig. 11, right-hand panel). This shows that the profiles are indeed Gaussian in nearly all radii bins, with small high- wings seen only in annuli at radii of 4 and 8 kpc.
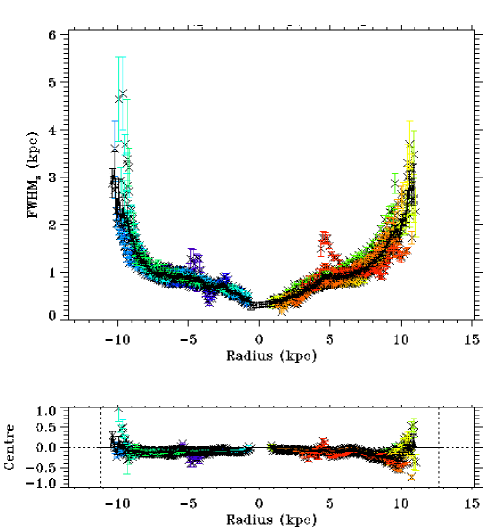
In Fig. 12 we show the direct FWHMz (upper plot) and midplane position (lower plot) fits of the HI disk. The FWHMz shows a clear increase in thickness at radii between and kpc on both sides occuring on both sides of the galactic centre. The colors show that this occurs only in the extreme velocity channels, corresponding to HI in the line of nodes. The lower plot shows that the HI midplane also deviates at this radius and azimuth in the X-Y plane, dropping below 200 pc below the average midplane position on the left-hand side, and rising approximately pc above the galactic plane on the right-hand side.
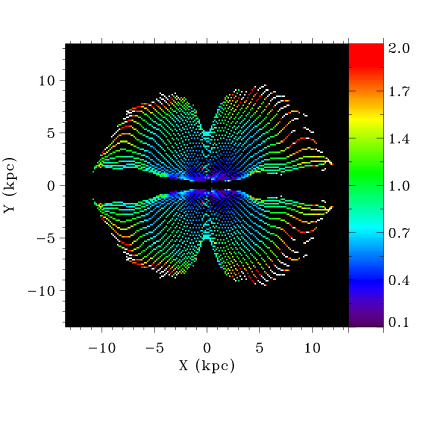
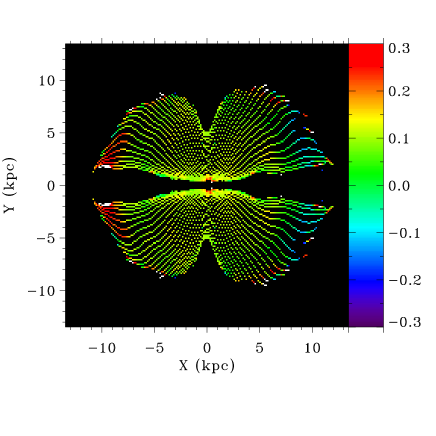
In Fig. 13 we show the FWHMz thickness (upper panel) and midplane position (lower panel) measurements deprojected onto the X-Y plane, where the color scale on each plot shows the respective FWHMz or midplane displacement measurements. Each line of measurements forming a coloured “track” shows the measurements from a single HI channel map. The measurements are the same on each side of the Y=0 line as, due to the edge-on orientation of the gas disk, we can’t determine if HI emission comes from the near or far side of the disk. Below we briefly describe the HI warp of the midplane before discussing the unusual azimuthal variation of both the thickness and midplane displacement mentioned above.
The midplane displacement plot (lower panel) shows that disk plane warps by 300-500 pc in the plane of the sky on the left-hand side centred around Y=0, while on the right-hand side the warp amplitude is similar, peaking at a small angle of 30∘ to the line-of-nodes. This implies that the measured thickness is uneffected by the warp on the left-hand side of the centre, while on the right-hand side the measured thickness of the direct loop 1 fit may have been slightly overestimated due to the projection of the warp. These effects of warping are corrected by iterating the measurement as explained in Sect. 3.2.
Also visible is a pronounced deviation of the midplane and FWHMz thickness of gas in the line of nodes at radii between 2.5-5.0 kpc on the left-hand side of the galaxy and at radii from 4-5.5 kpc on the right-hand side. This midplane displacement is seen most clearly in the lower plot of Fig. 12; while this deviation of the gas thickness from the mean flaring can be seen in both the upper plot of Fig. 12 and the upper panel of Fig. 13. One explanation for the increased broadening and tilting of the disk midplane along the Y=0 axis at this radius, is that the gas is responding to the local perturbation of the total potential by the suspected bar. Peanut-shaped deviations from elliptical isophotes in the projected R-band image (Pohlen et al., 2003) favour a bar oriented in the plane of the sky (ie. along the Y=0 axis), rather closer to end-on which would align the bar axis with the line-of-sight. The measured enhanced local gas thickening along the Y=0 axis probably is the best observational evidence of a bar in an edge-on galaxy.333We thank Lia Athanassoula for pointing this out. Other explanations for localised regions of increased thickness are infalling material from a companion or disruption by a companion, however UGC7321 is an isolated galaxy. The high symmetry of the flaring on both sides of the centre, and the high stellar disk major-to-minor axis ratio ( at mag arcsec-2, Matthews, Gallagher & van Driel 1999) render disruption by an undetected neighbouring galaxy rather implausible.
Another noticable feature of Fig. 13 is that the tracks denoting the location of the measurements in the X-Y plane display wiggles which systematically vary over a range of azimuthal angles. As our deprojection method is based on the velocity field, these wiggles could be due to deviations from circular rotation in the velocity field causing small errors in the deprojection444Private communication with Agris Kalnajs.. Kinks are typically seen in the velocity fields of less inclined galaxies with strong spiral arms (e.g. M81, Rots, 1974) suggesting that, if seen face-on, UGC7321 may exhibit weak spiral arms in the gas distribution.
5 Discussion
5.1 HI rotation curves
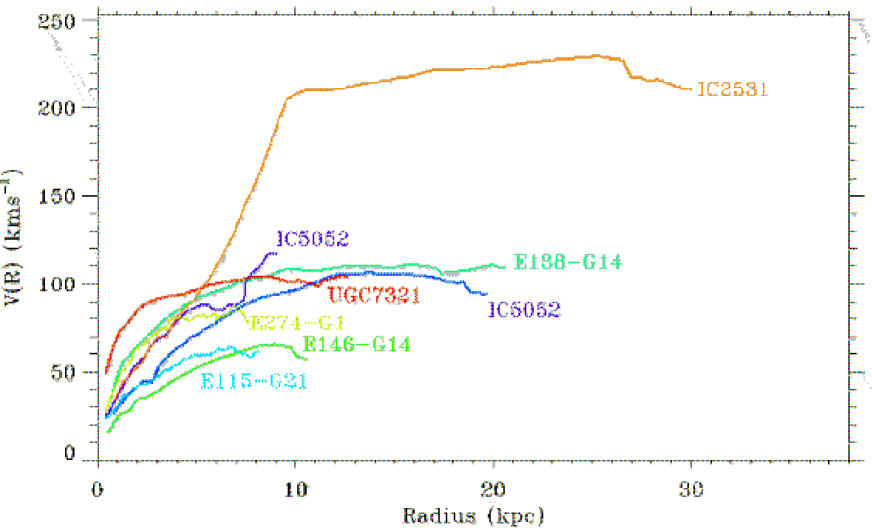
In Fig. 14 the rotation curves of our galaxies are overlaid. IC 2531 stands out as a massive, large galaxy compared to the rest of the sample. We have two very slow rotators with maximum rotation speeds of 60 km/s in our sample, while the others form a group of galaxies rotating at 100 km/s. The shape of the rotation curves are in good agreement with the rotation curves of 60 less inclined late-type dwarf galaxies measured by Swaters (1999). Although low mass LSB galaxies exhibit a shallower inner rotation gradient, our high resolution observations clearly resolve differential rotation, in agreement with other observations by Swaters (1999) and de Blok & Bosma (2002).
5.2 HI velocity dispersion
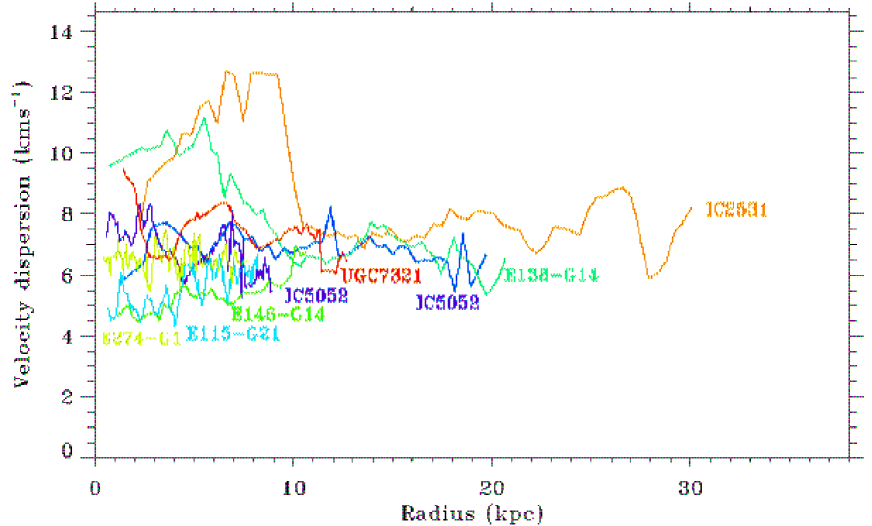
The HI velocity dispersion measurements presented in this paper comprise the highest spatial resolution measurements of velocity dispersion to date and the first measurements using data that span the radial extent of each galaxy by more than HI synthesised beams. Fig. 15 shows that the HI velocity dispersion of our galaxies ranges from km s-1 to km s-1, with most galaxies displaying a HI velocity dispersion of to km s-1. Of the eight galaxies in our sample, all display radial structure in HI velocity dispersion, except ESO274-G001 which has an approximately constant HI velocity dispersion of km s-1.
Fig. 16 shows the mean HI velocity dispersion as a function of the maximum rotation velocity of the HI disk. There is a definite increase in the mean velocity dispersion with rotation speed from about to km s-1 for rotation velocities to km s-1, but IC2531 has the same velocity dispersion of approximately km s-1 although its maximum rotation speed is km s-1. Dalcanton et al. (2004) found that edge-on galaxies with rotation velocity greater than km s-1 have well-defined dustlanes, while those with lower rotation do not. Dalcanton et al. suggested that well-defined dust lanes are related to lower gas turbulence and lower scale heights for the dust layer in the more rapidly rotating galaxies. Do our data support this suggestion?
From Eqn. (1), the scaleheight of a Gaussian dust layer is related to the ISM velocity dispersion by
| (5) |
where is the mid-plane total density which is dominated by baryons in normal spirals. The density where is the typical surface density of a disk and is the baryon scale height. It turns out that and the stellar scaleheight are both approximately proportional to the maximum circular velocity (Gurovich et al., 2009; Kregel et al., 2002), so the typical value of is independent of and we expect the scale height of the dust layer to be directly proportional to the ISM velocity dispersion . In our sample of galaxies, the galaxy with the largest (IC2531) shows a clean well-defined dustlane as expected from the Dalcanton et al. sample. However Fig. 22 shows no evidence for a decrease in as increases, so our data do not suppport the variable turbulence explanation for the change in dust lane morphology with .
Two of the larger galaxes, IC2531 and ESO138-G014, display HI velocity dispersions 2-3 km s-1 larger at small radii coinciding with the inner stellar disk. IC2531 is a large Sc galaxy with a strong bar, while the HI XV map of ESO138-G014 indicates a possible bar. The other barred galaxy in our sample, UGC7321, displays the next highest central HI velocity dispersion. These three galaxies have a relatively large standard deviation in the HI velocity dispersion as often observed in more face-on strongly barred galaxies like NGC1365, presumably caused by gas shocks and increased star formation. Unfortunately, ESO138-G014 was not in our optical sample due to its low galactic latitude, so we were unable to confirm the existence of a bar by investigating the stellar isophotes.
The velocity dispersion profile of UGC7321 exhibits three broad localised peaks with velocity dispersion 1-2.5 km s-1 higher than the intervening medium. These occur at the galactic centre, and at radii of kpc and kpc. Stellar observations of UGC7321 by Pohlen et al. (2003) show a central peanut-shaped stellar over-density with a radius of kpc, which could be caused by resonant off-plane thickening via bar buckling (e.g. Combes et al., 1990). The rise of HI velocity dispersion from km s-1 to km s-1 in this region suggests that processes associated with bar buckling could be providing the additional energy heating the gas. The second HI velocity dispersion peak, from kpc to kpc, corresponds to the radius of the bar shown in the “figure-8” HI signature and the stellar isophotes analysis by Pohlen et al. (2003). The third HI velocity dispersion is of lower amplitude and occurs outside the stellar disk. These results suggest that at least part of the additional gas heating seen in the high inner HI velocity dispersions of barred galaxies in our sample could be due to star formation along radial flows in the bar, and bar buckling.

Observations of the face-on galaxies NGC3938 (van der Kruit & Shostak, 1982), NGC628 (Shostak & van der Kruit, 1984), NGC1058 (van der Kruit & Shostak, 1984; Petric & Rupen, 2006), NGC6946 (Boulanger & Viallefond, 1992) and NGC5474 (Rownd et al., 1994) have shown that the HI velocity dispersion ranges from to km s-1, and has generally been assumed to be 6-8 km s-1 in the absence of significant star formation. In NGC 6946, detailed observations by Kamphuis & Sancisi (1993) and Boomsma et al. (2008) indicate the presence of widespread high velocity gas with significant kinetic energy, while the radial HI velocity dispersion profile shows a peak of more than 10 km s-1 within , followed by a gradual decline. Large-scale turbulence probably plays a role in this. The cause of the HI velocity dispersions is complicated and not well-understood, but turbulence driven by star formation, supernovae, shearing motions and magnetic instabilities all may play a role (Tamburro et al., 2009; Agertz et al., 2009).
The typical velocity dispersion of to km s-1 of galaxies in our sample is in agreement with these observations, which is to be expected given the LSB nature of all the galaxies in our sample (except IC2531 and IC5052). On small scales it is assumed that increased HI velocity dispersion is due to heating of the ISM by stellar winds from hot OB stars, supernovae and expanding HII regions (e.g. McKee & Ostriker, 1977; Spitzer, 1978). Star formation is known to increase the turbulence of the ISM (Oort & Spitzer, 1955), as the newly formed stars eject gas from the cloud within which they formed by radiation pressure and stellar winds. Although limited by a small sample size, our results suggest that increased gas velocity dispersion in disk galaxies is linked to the presence or prior formation of bars, which could cause the widespread star formation required to form strong dust lanes. However, it could also be caused by star formation in spiral arms.
The most recent observations of NGC1058 by Petric & Rupen (2006) are the only HI velocity dispersion study of a face-on galaxy with high spectral resolution ( km s-1). They found a general radial trend of a declining HI velocity dispersion which was punctuated by many peaks and saddles where it ranged from to km s-1. Two of the three regions with high HI velocity dispersion did not coincide with star formation tracers such as Hα or radio continuum emission. For the third one it did, but that region was located at the galactic center. The high spatial frequency of HI velocity dispersion variation measured in our sample also suggests that the small scale velocity structure of the neutral ISM is likely to be quite complex.
If the canonical HI velocity dispersion of km s-1 found in the outer disks of galaxies were due solely to thermal motion, the gas temperature would need to be K. In the outer Galaxy where it is possible to measure the kinetic temperature and the velocity dispersion, Spitzer (1978) found a thermal contribution to the HI velocity dispersion of only 1 km s-1, indicating that most of the broadening is non-thermal in origin.
One possible explanation is that differential galactic rotation transforms rotational energy into turbulent motions, perhaps via shocks resulting from disk instabilities (Quiroga, 1983; Rohlfs & Kreitschmann, 1987; Sellwood & Balbus, 1999). Shocks in galactic bars could also generate gas heating. High resolution hydrodynamical simulations, including gaseous self-gravity, realistic radiative cooling, and rotation by Wada et al. (2002) show that large scale rotation combined with gas self-gravity could be the source of the additional non-thermal energy broadening the gas velocity dispersion. Their models of turbulent rotating disks are consistent with the velocity dispersion of the extended HI disk in the dwarf galaxy NGC2915, which appears to have no prominent star formation. Their numerical simulations also show that the stellar bar in NGC 2915 enhances the HI velocity dispersion, which supports our finding of higher velocity dispersion in the inner disks of IC2531, ESO138-G14 and UGC7321
5.3 HI radial surface density
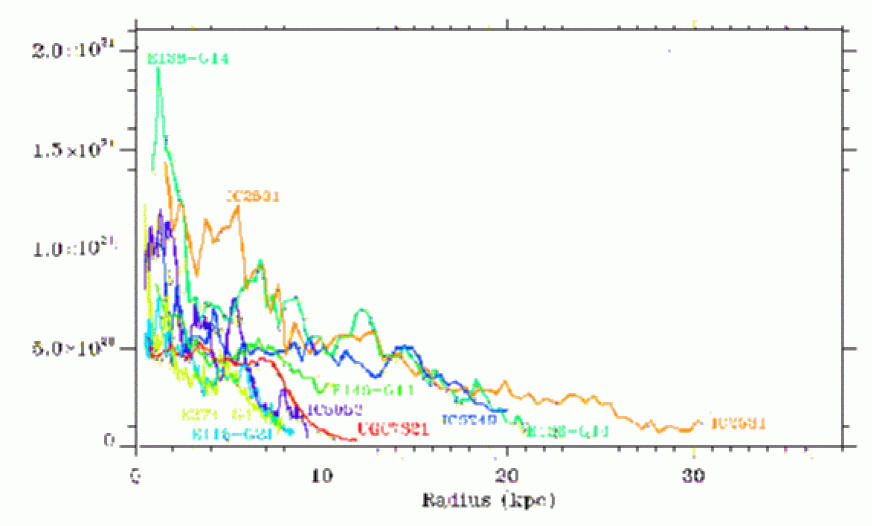
Fig. 17 shows the measured radial HI surface density of each galaxy in our sample. UGC7321, ESO274-G001 and ESO115-G021 all show a steep exponential decline at large radii, while IC5052 and ESO138-G014 appear to exhibit a roughly linear decline. With the exception of IC5052, most galaxies appear to show roughly smooth HI surface densities.
5.4 Flaring of HI layers
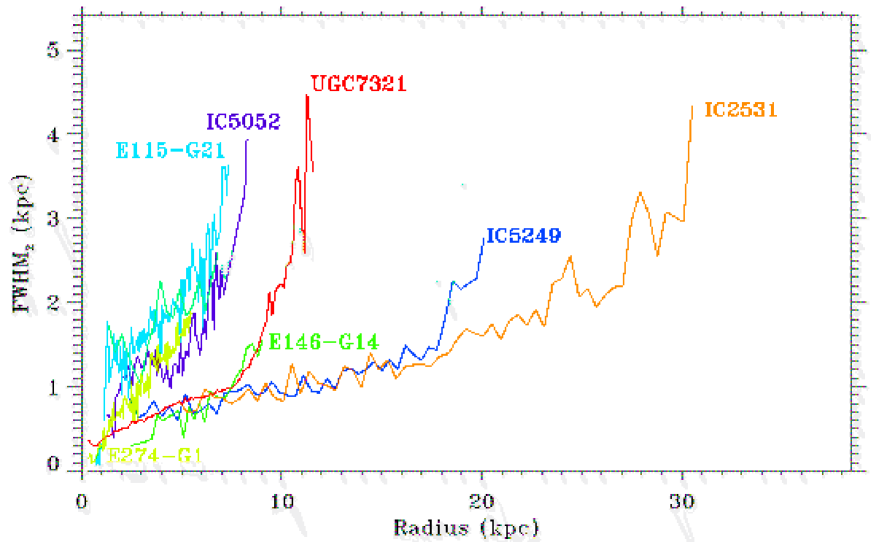
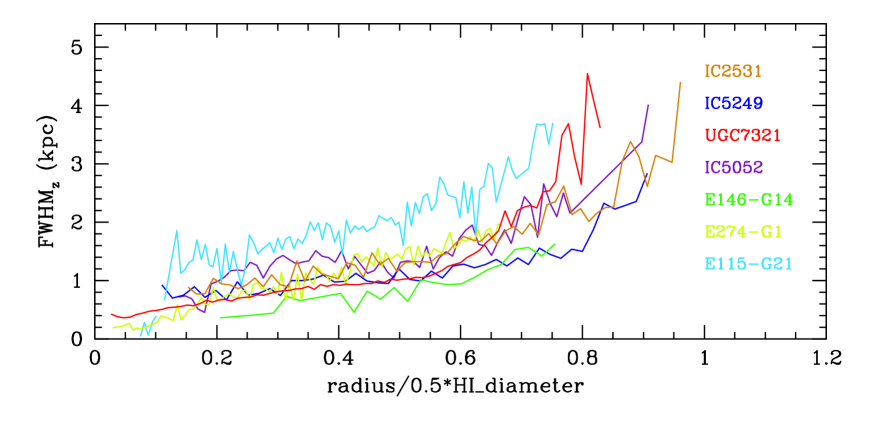
In Fig. 18 we display a plot of all the flaring profiles for each galaxy in our sample. The HI flaring profiles appear to obey a typical shape, with the flaring increasing linearly with radius where the stellar disk dominates the local gravitational potential, and steepening to an exponential profile in the outer disk where the potential is probably dominated by the halo. This break in the change of the flaring profile is seen most clearly in UC7321. The onset of exponential curvature appears to occur just outside the stellar truncation radius in the more massive galaxies with maximum rotation speed km s-1. In smaller, lower surface brightness disk galaxies with km s-1, the break possibly occurs at smaller radii due to dark matter dominating the inner gravitational potential.
All of the galaxies in our sample display this flaring profile, except ESO138-G014 which is considered unreliable due to missing large-scale HI structure (see Sect. 4.4). Unfortunately, we were unable to detect this radial change in flaring profile shape in ESO274-G001, the galaxy with the highest spatial resolution in our sample, as we were unable to measure the gas thickness at radii outside the stellar disk, due to a lack of short-spacing observations. Excluding ESO138-G014, all the more massive galaxies ( km s-1) display a shallower flaring profile over the inner disk. With the exclusion of ESO146-G014, the three remaining small disk galaxies ( km s-1) all display steep linear inner flaring profiles.
The flaring profile of ESO146-G014 shows remarkable similarities to the flaring profile of UGC7321. Apart from a similar central face-on B-band stellar surface brightness (respectively and mag arcsec-2), these two galaxies appear quite different — ESO146-G014 has a much lower rotation speed and HI velocity dispersion.
The three well-measured large galaxies (IC2531, IC5249 and UGC7321) and the unusual ESO146-G014, each display one common profile with a small FWHMz. A common flaring profile in the inner disk suggests a common ratio of the HI velocity dispersion to the stellar density, assuming the stellar density dominates at low radii. The ratio of mean HI velocity dispersion to maximum rotation speed is very similar in IC5249, UGC7321 and ESO146-G014, the value for IC2531 is roughly half that of the others.
The radial gradient of the flaring is more varied in the smaller galaxies. The coalignment of the inner flaring slopes of UGC7321, IC5249 and IC2531 is probably a coincidence, as a comparison of IC2531’s flaring profile to that of the Galaxy (Olling & Merrifield, 2000) shows that the gas disk of IC2531 is approximately twice as thick as the Galactic HI layer.
In Fig. 19 we show the flaring profiles with the horizontal axis scaled with (half) the diameter of the HI distribution, taken from paper I. This does make the profiles more comparable in shape, although still there is quite some variation of the thickness of the HI in kpc from galaxy to galaxy. We have done the same by scaling to (half) the optical radius, taken from NED555This NASA/IPAC Extragalactic Database is operated by the Jet Propulsion Laboratory, California Institute of Technology, under contract with the National Aeronautics and Space Administration.. Not surprisingly, the result is similar since the optical and HI diameters do in general correlate among galaxies, although the relative positions of the lines with respect to each other is different. For comparison, the flaring profile of NGC 891 (van der Kruit, 1981) would be on the scale of Fig. 19 run from about 0.3 kpc at 0.2 scaled galactocentric radius to 1.9 kpc at 1.0. This is thinner than in our systems, but that is not surprising since our sample was selected to be made up of galaxies with low contributions of the disks to the gravitational potential and the thickness of the HI layer is to a larger extent determined by that of the dark matter halo, which would be less flattened than the disk.
In this work we have measured the vertical thickness of the HI disk by fitting a single Gaussian gas component. We have not attempted to fit the thickness by a two Gaussian components as others have done, because the single Gaussian model was a good fit. Earlier higher resolution VLA observations of NGC891 yielded an exponentially flaring thin HI layer. More recent studies of its gas thickness, using exceptionally sensitive lower resolution WSRT observations with hrs integration time, recover extended filamentary high latitude HI with unusual velocity structure comprising of the total HI mass (Oosterloo et al., 2007; Fraternali et al., 2004). By applying this dual gas component modelling process to the initial hrs of WSRT data on NGC891, Swaters et al. (1997) found that the traditional warped and flared gas layer did not simulate the high latitude inner disk gas. Indeed the best models of NGC891 tested in this fashion used two disks each of constant thickness, with FWHM kpc and FWHM kpc, for the thin and thick disk respectively, where the thick disk rotation lags that of the planar gas, and also displays some radial infall motion.
Similar two-component HI modelling has been undertaken on several less-inclined large galaxies: NGC2403 (Fraternali et al., 2002), NGC4559 (Barbieri et al., 2005), NGC253 (Boomsma, 2007) and NGC6946 (Fraternali et al., 2004; Boomsma, 2007). Each of these galaxies is actively star-forming with significant fractions of their total HI mass (10-30%) exhibiting anomalous velocities forbidden by circular rotation. As discussed in Sect. 4, Mattthews & Wood (2003) also applied this model to UGC7321, a low surface brightness galaxy in our sample. In each of these galaxies, modelling has found a thick gas layer combined with a thin constant thickness or flaring thin gas layer. With the exception of UGC7321, the high stellar density, star formation rate and stellar disk area of these galaxies are all conducive to ejecting a greater HI mass fraction to high latitudes, whether by discrete star formation or large scale galactic fountains. Despite the massive amount of HI in the halos of these galaxies, this inner high latitude HI is probably more akin to Galactic high velocity clouds than a continuous broad HI component.
As discussed in paper I, a small amount of high latitude filamentary HI is observed in the larger galaxies in our sample, with km s-1, at projected radii corresponding to the inner disk. However this gas makes up only a small fraction () of the total gas mass and may not be in hydrostatic equilibrium. For this reason we have not attempted to measure its mass distribution.
5.5 Open issues
As mentioned above, the HI velocity dispersion measured in face-on galaxies were all undertaken with low spatial resolution of kpc, much larger than the scale of most processes in the ISM which are likely to cause local variation in the HI velocity dispersion. Deep high spatial and spectral HI observations of such systems are lacking.
In theory, given high spatial and spectral resolution, it is possible to determine the intrinsic shape of the HI line spectrum, and whether the velocity structure is best represented by one or more Gaussians, or a non-Gaussian function. Petric & Rupen (2006) found that the HI line profile was best fit by a two-Gaussian shape where the ratio of the integrated flux of the thick and thin Gaussians was constant at all radii with good signal-to-noise. The only edge-on galaxy with bright HI that is close enough to image at the required resolution is the small Scd galaxy, NGC4244, studied by Olling (1996a).
It is also important to test the isothermality of the HI distribution by fitting the HI velocity dispersion to XV maps formed from gas at different heights above the galactic plane. This is important; without further information about the -dependence of the velocity dispersion, we would need to assume -isothermality when using the equations of hydrostatic equilibrium to derive the vertical potential of the dark matter halo. Although the spatial resolution of ESO274-G001 is sufficient to independently measure the gas at several heights above the plane, additional HI observations in compact array configurations would be needed.
Our HI observations in paper I show significant optical depth (assuming HI spin temperatures of 200-400 K) in isolated locations of several galaxies in our sample. It would be interesting to generalise the XV modelling to also fit the direction, as this would allow the HI opacity to be accurately measured across the galaxy. Such a generalised model would measure the gas density . By integrating over the line of sight, the total HI column density and HI opacity consistent with the kinematic model could be calculated and compared to the observed HI column density to check the calculated HI opacity. This requires higher spatial resolution data than we have available in this study.
6 Summary and conclusions
Using our new XV modelling method detailed in paper II we have successfully fit the rotation curves of all eight galaxies in our sample; and the HI velocity dispersion and surface density in all the galaxies except for the inner disk of IC2531. The rotation curve was the most reliably fit achieving an accuracy of roughly 2-4 km s-1. The surface density was also very reliably measured. The HI velocity dispersion was more sensitive to local variations and noise in the XV map, however despite these challenges the uncertainty in the derived HI velocity dispersion is only about 1–1.5 km s-1, which is comparable to the accuracy obtained from NGC4244 by Olling (1996a). The prevalence of bars in the larger galaxies and the increase in the mean velocity dispersion with maximum rotation speed suggests that bar buckling may be a common cause of widespread gas heating in disk galaxies.
The measured rotation curves show that all galaxies in our sample display differential rotation, even the smallest galaxies IC5052 and ESO115-G021 which have peak rotation speeds of only km s-1. The increased velocity dispersion by 1–2.5 km s-1 observed in galaxies with bars suggests that shocks caused by disk instabilities in bars can cause gas heating.
Iterative fitting of the HI layer thickness enabled us to reliably measure the HI flaring in 7 of the 8 galaxies in our sample, despite FWHMθ beamwidths of up to kpc and a low peak channel map signal-to-noise of around for most of the galaxies in our sample. The only galaxy we were unable to reliably fit was ESO138G-014 which was missing large scale HI structure due to an absence of short baseline observations, and also suffered low peak signal-to-noise () and a large telescope beam ( kpc). For galaxy observations with only two of these three handicaps it was possible to iteratively recover a flaring model that fit the observed HI channel map distribution. UGC7321 is the most accurately measured flaring profile in our sample with errors of only 15-50 pc over most of the radial extent.
The flaring profiles show an impressive degree of the symmetry between flaring measurements on either side of the galaxy — this is most clearly seen in UGC7321. Axial symmetry of the gas layer thickness is expected as in the absence of local variations of the stellar surface density or gas velocity dispersion, the vertical flaring should reflect the smooth symmetric gravitational potential of the dark matter halo. The exceptionally smooth flaring profile of UGC7321 shows that, on the kpc scale of telescope beam, the stellar surface density and dark matter halo gravitational potential are also smooth.
The most remarkable feature of HI flaring profiles is a common shape displaying a linear increase at low radii and steepening to an exponential increase in the outer disk. The steepness of the inner flaring should be dominated by the radial surface density, while at the stellar disk truncation radius the flaring becomes exponential and is dominated by the dark halo shape. This typical flaring shape is found in all of the galaxies except ESO138-G014 which was incompletely imaged, and ESO274-G001 which appears to have a more linear flaring profile. With the exception of ESO146-G014, all of the less massive galaxies ( km s-1) display steep inner flaring profiles. The four larger galaxies ( km s-1), excluding ESO138-G014, display much shallower inner flaring profiles.
The high sensitivity of the UGC7321 observations allowed us to discern variations from azimuthal symmetry of both the HI midplane position and the HI thickness. We show that at radii from approximately to kpc along the Y=0 axis, the FWHMz gas thickness varies by up to pc from the azimuthally averaged flaring in those radial annuli. At this same locations along the Y=0 axis the gas midplane tilts, dropping 200 pc below the average disk midplane on the left-hand side, and rising 200 pc above the midplane on the right-hand side. These local deviations are considered to be best observational evidence for a bar in an edge-on disk galaxy.
The next paper in this series will be devoted to an analysis of the data on UGC7321 as a first attempt at deriving constraints on the flattening of a dark halo.
Acknowledgements.
We are very grateful to Albert Bosma who contributed greatly to initiating this project. He pointed out that HI flaring studies are best done on edge-on galaxies with low maximum rotational velocities, and we used an unpublished Parkes HI survey of edge-on galaxies by Bosma and KCF when selecting our galaxies. JCO thanks E. Athanassoula, M. Bureau, R. Olling, A. Petric and J. van Gorkom for helpful discussions. JCO is grateful to B. Koribalski, R. Sault, L. Staveley-Smith and R. Wark for help and advice with data reduction and analysis. We thank the referee, J.M. van der Hulst, for his careful and thorough reading of the manuscripts of this series of papers and his helpful and constructive remarks and suggestions.References
- Abe et al. (1999) Abe, F. et al., 1999, AJ, 118, 261
- Agertz et al. (2009) O. Agertz, G. Lake, R. Teyssier, B. Moore, L. Mayer & A.B. Romeo, 2009, MNRAS, 392, 284
- Barbieri et al. (2005) Barbieri, C.V., Fraternali, F., Oosterloo, T., Bertin, G., Boomsma, R. & Sancisi, R., 2005, A&A, 439, 947
- Binney et al. (1991) Binney, J., Gerhard, O.E., Stark, A.A., Bally, J. & Uchida, K.I., 1991, MNRAS, 252, 210
- Boomsma (2007) Boomsma, R., 2007, Ph.D. Tesis, Groningen
- Boomsma et al. (2008) Boomsma, R., Oosterloo, T.A., Fraternali, F., van der Hulst, J.M. & Sancisi, R., 2008, A&A, 490, 555
- Bottema et al. (1986) Bottema, R., Shostak, G.S. & van der Kruit, P.C., 1986, A&A, 167, 34
- Boulanger & Viallefond (1992) Boulanger, F. & Viallefond, F., 1992, A&A, 266, 37
- Braun (1991) Braun, R., 1991, ApJ, 372, 54
- Bureau & Freeman (1999) Bureau, M., & Freeman, K.C., 1999, AJ, 118,126
- Combes et al. (1990) Combes,F., Debbasch, F., Friedli, D. & Pfenniger, D., 1990, A&A, 233, 82
- Contopoulos & Mertzanides (1977) Contopoulos, G, & Mertzanides, C., 1977, A&A, 61, 477
- Dalcanton et al. (2004) Dalcanton, J.J., Yoachim, P. & Bernstein, R.A., 2004, ApJ, 608, 189
- de Blok & Bosma (2002) de Blok, W.J.G. & Bosma, A., 2002, A&A, 385, 816
- Fraternali et al. (2004) Fraternali, F., Oosterloo, T., Boomsma, R., Swaters, R. & Sancisi, R, 2004, I.A.U. Symp. 217, ed. P.-A. Duc, J. Braine & E. Brink,. San Francisco: ASP, 136
- Fraternali et al. (2002) Fraternali, F., van Moorsel, G., Sancisi, R. & Oosterloo, T., 2002, AJ, 123, 3124
- Gurovich et al. (2009) Gurovich, S., Freeman, K.C., Jerjen, H. & Puerari, I., 2009, ApJ, submitted
- Kamphuis & Sancisi (1993) Kamphuis, J. & Sancisi, R., 1993, A&A, 273, L31
- Kregel & van der Kruit (2004) Kregel, M. & van der Kruit, P.C., 2004, MNRAS, 352, 787
- Kregel et al. (2002) Kregel, M., van der Kruit, P.C. & de Grijs, R., 2002, MNRAS, 334, 646
- Matthews, Gallagher & van Driel (1999) Matthews, L.D., Gallagher III, J.S. & van Driel, W., 1999,AJ, 118, 2751
- Mattthews & Wood (2003) Matthews, L.D. & Wood, K., 2003, ApJ, 593,721
- McKee & Ostriker (1977) McKee, C.F. & Ostriker, J.P., 1977, ApJ, 218, 148
- Merrifield (1992) Merrifield, M.R., 1992, AJ, 103, 1552
- O’Brien et al. (2010a) O’Brien, J.C., Freeman, K.C., van der Kruit, P.C. & Bosma, A., 2010a, A&A, submitted (Paper I)
- O’Brien et al. (2010b) O’Brien, J.C., Freeman, K.C. & van der Kruit, P.C., 2010b, A&A, submitted (Paper II)
- Olling (1995) Olling, R.P., 1995, AJ, 110, 591
- Olling (1996a) Olling, R.P., 1996a, AJ, 112, 457
- Olling & Merrifield (2000) Oling, R.P., & Merrifield, M.R., 2000, MNRAS, 311, 361
- Oort & Spitzer (1955) HOort, J.H. & Spitzer, L., 1955, ApJ, 121, 6
- Oosterloo et al. (2007) Oosterloo, T., Fraternali, F. & Sancisi, R., 2007, AJ, 134, 1019
- Petric & Rupen (2006) Petric, A.O. & Rupen, M.P., 2007, AJ, 134, 1952
- Pohlen et al. (2003) Pohlen, M., Balcells, M., Lütticcke, R., & Dettmar, R.-J., 2003, A&A, 409, 485
- Quiroga (1983) Quiroga, R.J., 1983, Ap&SS, 93, 37
- Rohlfs & Kreitschmann (1987) Rohlfs, K. & Kreitschmann, J., 1987, A&A, 178, 95
- Rots (1974) Rots, A.H., 1974, Ph.D. Thesis, Groningen
- Rownd et al. (1994) Rownd, B.K., Dickey, J.M. & Helou, G., 1994, AJ, 108, 1638
- Rupen (1989) Rupen, M.P., Ph.D. Thesis, Columbia
- Sancisi & Allen (1979) Sancisi, R. & Allen, R.J., 1979, A&A, 74, 73
- Sellwood & Balbus (1999) Sellwood, J.A. & Balbus, S.A., 1999, ApJ, 511, 660
- Shostak & van der Kruit (1984) Shostak, G.S. & van der Kruit, P.C., 1984, A&A, 132, 20
- Spitzer (1978) Spitzer, L., 1978, Physical Processes in the Interstellar Medium, Wiley Interscience, New York.
- Swaters (1999) Swaters, R.S., 1999, Ph.D. Thesis, Groningen
- Swaters et al. (1997) Swaters, R.S., Sancisi, R. & van der Hulst, J.M., 1997, ApJ, 491, 140
- Tamburro et al. (2009) D. Tamburro, H.-W. Rix, A.K. Leroy, M.-M. Mac Low, F. Walter, R.C. Kennicutt, E. Brinks & W.J.G. de Blok, 2009, AJ, 137, 4424
- van der Kruit (1981) van der Kruit, P.C., 1981, A&A, 99, 298
- van der Kruit et al. (2001) van der Kruit, P.C., Jiménez-Vicente, J., Kregel, M. & Freeman, K.C., 2001, A&A, 379, 374
- van der Kruit & Shostak (1982) van der Kruit, P.C. & Shostak, G.S., 1982, A&A, 105, 351
- van der Kruit & Shostak (1984) van der Kruit, P.C. & Shostak, G.S., 1984, A&A, 134, 258
- Wada et al. (2002) Wada, K., Meurer, G. & Norman, C.A., 2002, ApJ, 577, 197
- Wong, Blitz & van der Hulst (2004) Wong, T., Blitz, L. & van der Hulst, J.M., 2004, Ap&SS, 289, 211