Role of molecular electronic structure in IETS: the case of O2 on Ag(110)
Abstract
Density functional theory (DFT) simulations corrected by the intramolecular Coulomb repulsion , are performed to evaluate the vibrational inelastic electron tunneling spectroscopy (IETS) of O2 molecules on Ag(110). Semilocal DFT calculations predict a spinless adsorbed molecule, however the inclusion of the leads to the polarization of the molecule by shifting a spin-polarized molecular orbital towards the Fermi level. This has an important implication in IETS, because a molecular resonance at the Fermi level can imply a decrease in conductance while in the off-resonance case, an increase in conductance is the expected IETS signal. We use the lowest-order expansion on the electron-vibration coupling, in order to evaluate the magnitude and spatial distribution of the inelastic signal. This allows us to reproduce the experimental data [Hahn et al., Phys. Rev. Lett. 85, 1914 (2000)] in: (i) the negative conductance variation observed in the vibrational spectra of O2 along the direction, (ii) the spatial distribution of the conductance changes recorded over the O2 molecule for the O–O stretch and the antisymmetric O2–Ag stretch vibrations, (iii) the absence of signal for the center-of-mass and hindered rotations modes, and (iv) the lack of IETS signal for the molecule chemisorbed along the direction. Moreover, our results give us insight of the electronic and vibrational symmetries at play. The vibrational frequencies need to go beyond the harmonic approximation in order to be compared with the experimental ones, hence we present a Morse-potential fitting of the potential energy surface in order to evaluate accurate vibrational frequencies. The final IET spectra are evaluated with the help of the self-consistent Born Approximation and the effect of temperature and modulation-voltage broadening are explored. This ensemble of results reveals that the IETS of O2 is more complicated that a simple decrease of conductance and cannot be ascribed to the effect of a single orbital molecular resonance.
I Introduction
Single-molecule vibrational spectroscopy is now possible thanks to the development of the inelastic electron tunneling spectroscopy (IETS) operating with the scanning tunneling microscope (STM) Stipe . The STM is thus conferred with the ability to chemically analyze surfaces on the atomic scale Ho ; Komeda . IETS has rapidly become a mature technique and multimode analysis on molecular substrates have been accomplished Okabayashi as well as analysis of extended vibrations or phonons Morgenstern . The characterization and control of single molecule reactivity through the excitation of a specific vibrational mode is a challenging area for the STM-based IETS techniquestprl97 ; ohkiprl08 . Within this context, the interaction of O2 with metals, which plays a central role in many technological processes, has served as a model system to explore and control the fundamentals of gas/surface reactivity.
The chemisorption and dissociation of O2 on silver surfaces have been widely investigated in last decades in an attempt to understand the catalytic properties of silver, which are extensively exploited in industrial-oxidation processes. Molecular beam experiments provide detailed information on how reactivity depends on the collision energy, the molecular rovibrational or electronic state, and the surface temperature and coverage. Combining this technique with either electron energy loss spectroscopy (EELS), infrared spectroscopy, or thermal desorption spectroscopy (TDS), it is also possible to extract information on the energetics ruling the elementary gas/surface processes –activation energies, atomic and molecular adsorption energies, reactive paths. Thanks to these kind of studies we know that O2 dissociation on flat Ag surfaces is characterized by rather large activation energies Bird ; albujcp08 and, as a consequence only molecular adsorption is possible at crystal temperatures below 150 K vaboprl94 ; buross96 ; rabuss96 . The chemisorption of O2 on the Ag(110) surface has been particularly controversial because of the initial disagreement regarding the nature and orientation of the chemisorbed molecule. Density functional calculations performed by Gravil et al. Bird shed light to this controversy showing the existence of two distinct chemisorption states with essentially equal energies. This theoretical finding was subsequently corroborated by EELS and TDS studies bafrprl98 , though the final confirmation came with the STM-IETS investigations by Hahn et al. Hahn ; hahoprl01 ; JCP . Compared with other spectroscopies, the great advantage of IETS operated with STM is that it provides simultaneous topographical and spectroscopical images with atomic resolution. This permits an almost direct identification of the molecular state.
Molecular O2 chemisorbs on Ag(110) parallel to the surface over the hollow site on two possible configurations, one with the molecular axis along the surface direction (O) and the other one along the direction (O). Single molecule vibrations are detected with STM-IETS on the O only. The recorded inelastic signal is a decrease in conductance for one of the modes (the O–O stretch) and it can be a decrease or an increase in conductance depending on the exact position of the STM tip over the molecule for the other detected mode (the antisymmetric O2–Ag stretch) Hahn . The reasons behind this rich and complex IETS structure have been a matter of controversy that have recently been solved alsaprl10 .
In IETS, the changes of conductance are recorded as a function of the tip-substrate voltage. It is generally admitted that in tunneling, the excitation of a vibration mode leads to opening an inelastic channel for conduction, hence increasing the conductance Persson ; Lorente2000 ; Paulsson2 ; Tal . However, early model calculations predicted that when a molecular resonance overlaps the Fermi level of the substrate, IETS could also give rise to decreases in conductance Persson . Up to now, the O is the only example, where such decreases in conductance have been observed experimentally. Strikingly, state-of-the-art IETS simulations, which use the electronic structure calculated with DFT as the initial ingredient, have been unable to reproduce the experimental conductance decreases. The simulations give conductance increases because in the DFT electronic structure the orbitals are not at resonance with the Fermi level Paulsson2 ; Lorente2004 . This discrepancy led to speculate that the theoretical Fermi level was wrongly positioned. However, questioning the position of the Fermi level and, thus, the molecular charge state in this system is at variance with the excellent characterization of the two experimental chemisorption states given by this theory Bird . Moreover, the Fermi level fitting, thought to force the resonance, cannot reproduce the rich IETS structure of the experimental data showing increases and decreases according to the vibrational mode and the tip localization.
In a recent letter alsaprl10 , it has been shown that correcting the DFT electronic structure to adequately incorporate the on-site Coulomb repulsion (the so called DFT+ approach), the experimental conductance changes recorded over the O–O stretch mode and the antisymmetric O2–Ag mode are correctly reproduced. Furthermore, the DFT+ calculations permit us to gain extra insight on the actual electronic structure of this molecular system. Contrary to the previous speculations, rather than shifting towards the Fermi level, the resonance follows a Stoner-like splitting of its spin components, leading to the partial filling of one of the spin components of the orbitals and, thus, to the spin polarization of the isolated O2 molecule on Ag (110). In the present contribution we present a comparative analysis of the DFT+ electronic structure of the O and O states, discussing the properties that cause the respective survival and quenching of the intrinsic O2 paramagnetism. Our previous simulations of the conductance changes for the O state are extended to all the relevant molecule-surface modes and also to the O molecule. In particular, the reasons for the existence or absence of IETS signal are explained in terms of the electronic and vibrational mode symmetries. There are two symmetry planes in the O2/Ag(110) system. We show that the possibility to excite a vibrational mode is determined by the overall symmetry character of the coupling states and mode respect to those two planes. However, the value of the IETS signal depends ultimately on the energies of the orbitals and on the strength of the electron vibration coupling. Also, we evaluate the IETS spectra with the help of the self-consistent Born Approximation and explore the effects due to temperature and modulation-voltage broadening.
The reminder of the paper is organized as follows. Section II.1 describes the details of the DFT+ calculations performed to obtain the electronic spectra of O2 chemisorbed on Ag(110). In Sec. II.2, we discuss the necessity to go beyond the harmonic approximation in order to obtain accurate vibrational frequencies of the molecule-surface modes. The theoretical model used for the IETS simulations is explained in Sec. II.3. The calculated electronic structure is shown in Sec. III. The corresponding STM-IETS simulations are discussed in Sec. IV. In Sec. V, we apply the SCBA model to calculate the IETS. Conclusions and final remarks are presented in Sec. VI.
II Methods
II.1 Details of the DFT+ calculations
Density functional theory calculations are performed with the VASP code vasp using plane waves with an energy cutoff of 515 eV and the projector augmented wave method paw . We use a periodic supercell consisting of a six-layer slab separated by 10.45 Å of vacuum and a (34) surface unit cell large enough to significantly reduce interactions among oxygen molecules in neighboring cells. The surface Brillouin zone is sampled with a 441 Monkhorst-Pack grid of special points. The exchange and correlation energy is calculated within generalized gradient approximation (GGA) using the PW91 functional pw91 . Corrections to the on-site Coulomb repulsion are applied to the oxygen 2 electrons following the rotationally invariant DFT+ scheme proposed by Dudarev et al. duboprb98 as implemented in VASP. The screened on-site Coulomb interaction is calculated from first principles as the energy cost for adding extra charge to O2 when adsorbed on Ag(110). The value obtained with the method described in Ref. [cogiprb05, ] is close to 4 eV. However, we also verify that the results shown in this work, are reproduced for varying within the range 2–4 eV. Such a verification is necessary because the calculated value actually depends on the projectors and the used constrained method to fix the final electronic structure. The adsorption positions are optimized by fully relaxing the O atoms and the two uppermost silver layers until atomic forces are less than 0.02 eV/Å.
II.2 Vibrational frequency evaluation: beyond the harmonic approximation
The diagonalization of the dynamical matrix gives the vibrational modes within the harmonic approximation. The method implemented in VASP uses finite differences to compute the second derivative of the hamiltonian with respect to a constant displacement of every coordinate of the active atoms, here the oxygen ones. In Table 1 we give the first 4 molecular modes on the surface for atomic displacements, 0.025, 0.03 and 0.04 Å. The displacement of 0.04 Å is the one that has the better overall agreement with the experimental measurements. The dispersion is still considerable, despite DFT is known to yield frequencies within % the experimental values Martin . The use of a rigid displacement to estimate the dynamical matrix is too simple to capture the complexity of molecular modes on surfaces. Indeed, a small displacement will be probing a region too flat of the potential energy surface (PES), and a large value will be probably in the anharmonic part of the PES. The situation becomes more difficult when we consider modes that span several tens of meV as is the present case. A that probes the harmonic potential corresponding to the center-of-mass coordinates (at meV) will be too large to probe the O–O stretch mode (at meV).
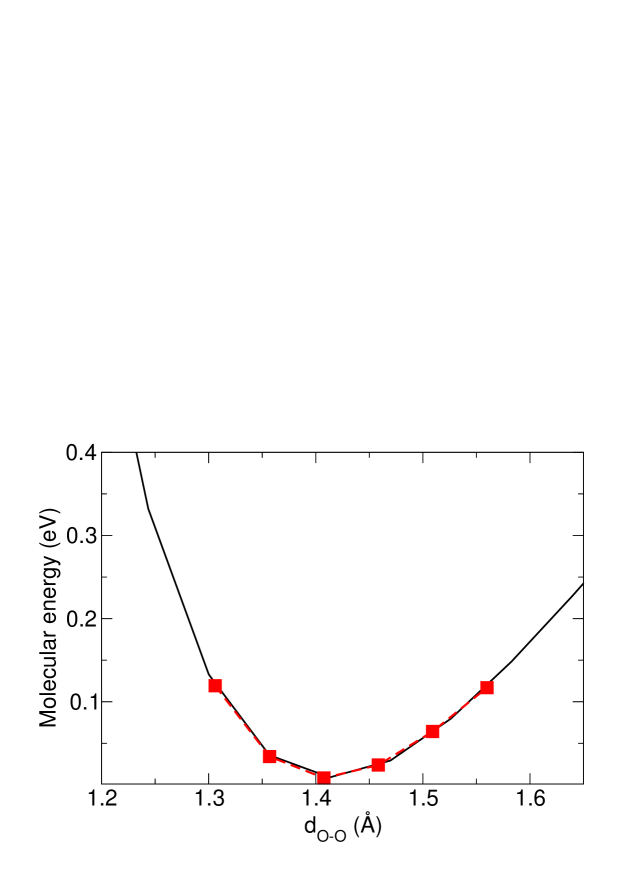
The vibrational frequencies are accurately calculated if several points of the PES are obtained and fitted to a Morse potential. This is the strategy followed here. We use the eigenvectors of the simple finite difference method. These eigenvectors change little from displacement to displacement (less than the frequencies do) and are a good starting point to plot the PES along a given mode. Figure 1 shows the PES along the O–O stretch mode and the corresponding Morse-potential fit. Solving the one dimensional the Schrödinger equation for this PES, we find a frequency of 83.626 meV. This value is now in good agreement with the experimental frequency of 82.0 meV. Therefore, we safely conclude that the uncertainty in the frequency evaluation is due to the anharmonicities of the PES and not to the DFT calculation.
II.3 IETS simulations
The IETS simulations of O2 on Ag(110) are performed using two different methods. For the quantitative evaluation of IETS and its spatial distribution we use the many-body extension of the Tersoff-Hamman theory for the STM Lorente2000 ; Lorente2004 . The current implementation is based on DFT results regarding the electronic structure and the electron-vibration couplings. Briefly, the conductance change due to the excitation of a localized vibration to the lowest order in the electron-vibration coupling, is given by the opening of the inelastic channel, leading to an increase of conductance, , and the change in the elastic channel to the same order in , , which means a decrease in conductance. In Ref. [Monturet08, ], an all-order theory shows that the decrease of conductance is related to the appearance of vibrational side-bands in the elastic electron transmission. The decrease is maximum when a molecular level is resonant with the Fermi energy and such that side bands appear at .
Due to the strong molecular character at the Fermi energy, approximations replacing the energy dependence by the behavior at the Fermi energy are not correct any longer. Hence, we use the full electronic structure and energy dependence for the finite bias of the measurements. In this case, we extend the customary IETS treatment Lorente2000 ; Lorente2004 to new equations that keep all the energetic dependence. Hence, the inelastic contribution to the conductance change is given by:
| (1) | |||||
where is the local density of states evaluated at the STM tip’s center and at the Fermi energy plus the energy of the electron at the corresponding bias, . The Fermi distribution function is given by and is the frequency of the considered mode. Since we are using periodic-boundary calculations, the electronic states are Bloch states with band indexes and and k-vector . Note that the local electron-vibration potential couples states with the same k-vector. The elastic term is
The factor is responsible for the temperature-dependent onset of the vibrational signal. Indeed, this factor is strictly zero at zero temperature, if . In the evaluation of these equations the k-point sampling is critical because a large number of electronic states is needed to ensure numerical accuracy. The -functions are approximated by Gaussian functions of broadening smaller than the used bias. Typically, we have performed the simulations at mV with a gaussian broadening of 50 meV, except for the O–O stretch mode that is calculated at meV. The experimental change in conductance is simulated as the sum of the inelastic and elastic contributions.
The second method is the use of the self-consistent Born approximation (SCBA) Galperin04 ; Frederiksen04 ; Solomon06 ; Rydnik based on a parameterized hamiltonian following Ref. [Monturet08, ]. In spite of the hamiltonian simplification, SCBA is numerically difficult and the evaluation of the spatial distribution of the SCBA signal is beyond our capabilities, instead we have fixed the STM-substrate symmetry and evaluated the IETS as a function of the applied bias. Results are shown depending on temperature and modulation voltage of the experimental lock-in amplifier in Sec. V.
III Electronic structure of O2 on Ag(110)
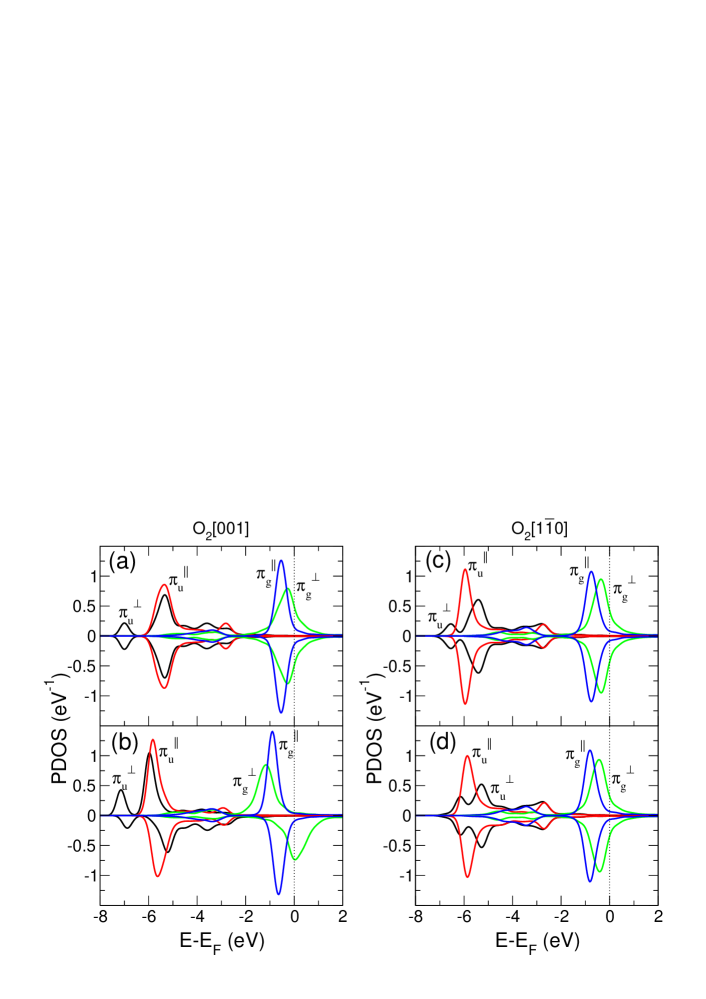
Despite local and semilocal DFT have proven to be accurate in determining variational ground state properties of the many-body system such as the electron density, it cannot assure a reliable treatment of the spectroscopic properties. In many cases, the electronic structure is incorrect due to the inadequate description of the on-site Coulomb interaction that favors fractional occupancies of energetically close states. This is precisely what happens with the electronic structure of the O chemisorption state calculated with GGA. In Fig. 2 (a) the projection of the density of states (PDOS) on to the O2 molecular orbitals (MOs) reflects the partial occupation of the four orbitals, despite the adsorbed molecule is capturing less than two electrons. These unrealistic populations are possibly at the origin of the discrepancy between the experimental IETS and the GGA-based simulations. To solve this failure we have performed DFT+ calculations of O2 chemisorbed on Ag(110). The DFT+ is aimed to correct the electronic structure without perturbing the physical magnitudes for which the GGA excels. A detail comparison of these quantities is shown in Table 2 for the two chemisorption states. The good agreement obtained with the GGA values ensures the correct description of the system.
The more realistic DFT+ electronic structure shows that the paramagnetic nature of O2 is partially preserved when chemisorbed along the [001] direction. As shown in Fig. 2 (b), the adequate description of the intramolecular Coulomb interaction breaks the spin degeneracy imposed by GGA and allows the full occupation of the two parallel-to-the-surface orbitals () and the spin-up perpendicular-to-the-surface (). Still the spin-down is partially occupied in order to preserve the correct electron density ascribed to the molecule. As a result, this molecular orbital is at resonance with the Fermi level. The electronic structure of this chemisorption state can be viewed as a Stoner-like process in which the molecule reduces its total energy by splitting the orbitals according to their spin polarization. One becomes completely filled at the expense of the other stabilizing the full system.
In contrast, no spin-splitting of the orbital is obtained for the O molecule. At first sight there are no significant differences on the structural properties (Table 2) and the GGA electronic structures of the two chemisorption states [compare Figs. 2 (a) and (c)]. These similarities are indeed consistent with the experimental observations of almost identical chemisorption energies bafrprl98 and equal probability to find any of the two configurations Hahn . However, the small differences found in the GGA calculations already point to a slightly larger charge transfer from the surface to the O molecule, which is also closer to the surface and more stretched charge . Similar results were also found in Ref. [Bird, ] using a 3 2 surface cell. Experimentally, this picture agrees with the existence of two energetically-close modes that are attributed to the O–O stretching vibration of the O (79.5 meV) and the O (85 meV) bafrprl98 . Our DFT+ calculations show that the induced density for O is larger and the Coulomb repulsion less important. Interestingly, what the DFT+ results highlight is a new difference between the two chemisorption states, namely, the paramagnetic character that is only preserved in the O molecule.
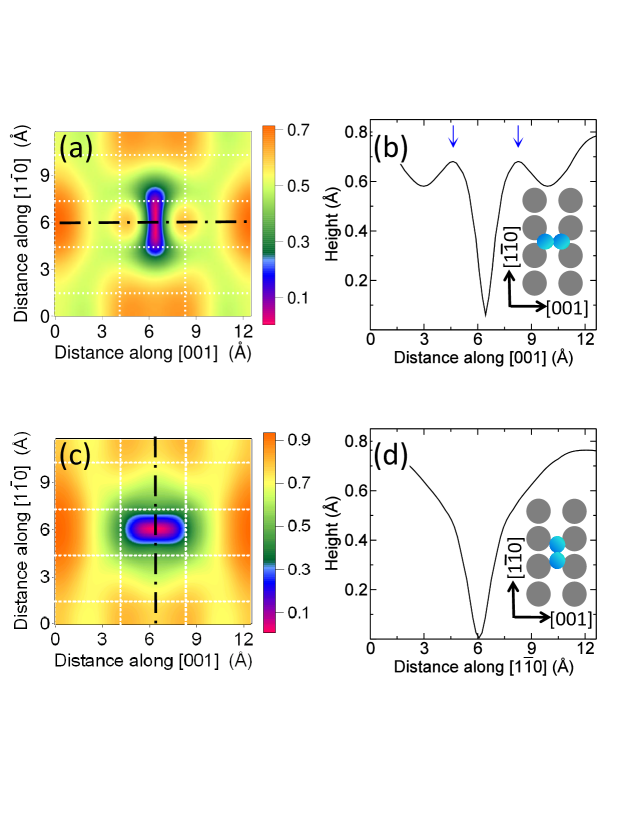
The DFT+ electronic structures are used to generate the constant current simulations of Fig. 3. The experimental topographical images of the O Hahn and the O hahoprl01 are well reproduced in both cases. The main difference between both states are the two protrusions appearing along the molecular axis in the former but not in the latter. As was demonstrated by the non-spin polarized DFT calculations of Olsson et al. Olsson , these protrusions are the fingerprints of the orbital. The absence of these features in the LDOS image of the O molecule is also understood on the basis of the stronger screening exerted on this molecule by the surface electrons. Note, finally, that the similar STM simulations obtained with non-spin polarized DFT and spin polarized DFT+ remark that information about the spin moment cannot be directly extracted from the STM topography. In next section, we will see that STM-based IETS can alternatively be used to identify this peculiar electronic structure in which a spin-polarized molecular orbital (MO) is at resonance with the Fermi level.
IV Spatial distribution of constant current IETS signals
Our STM-IETS simulations, based on the DFT+ electronic structure, are able to reproduce qualitatively, and many times quantitatively, the reported experimental findings: (i) the negative conductance changes observed in the vibrational spectra of the O molecule, (ii) the spatial distribution of the conductance changes recorded over the O molecule for the O–O stretch and the antisymmetric O2–Ag stretch vibrations, (iii) the absence of signal for the center-of-mass and hindered rotation modes, and (iv) the lack of IETS signal for the molecule chemisorbed along the direction hahoprl01 .
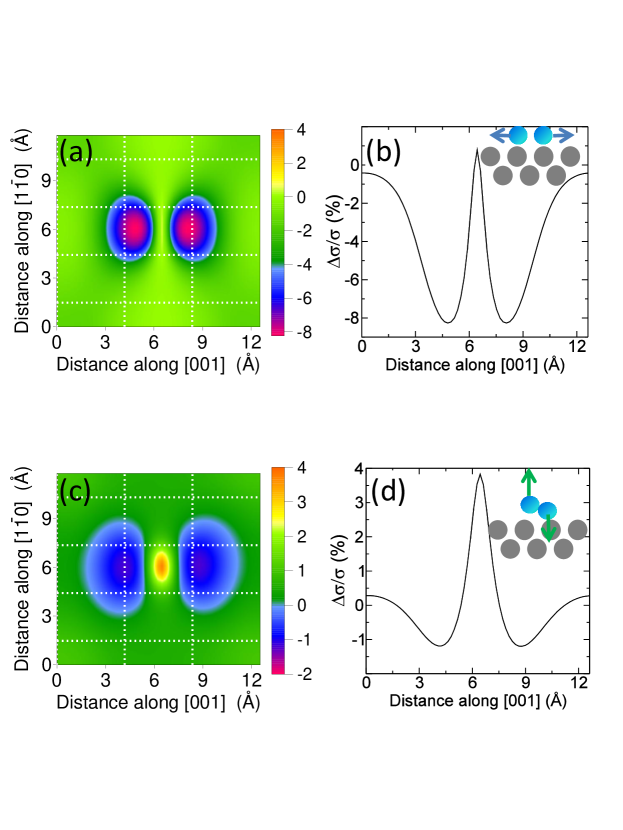
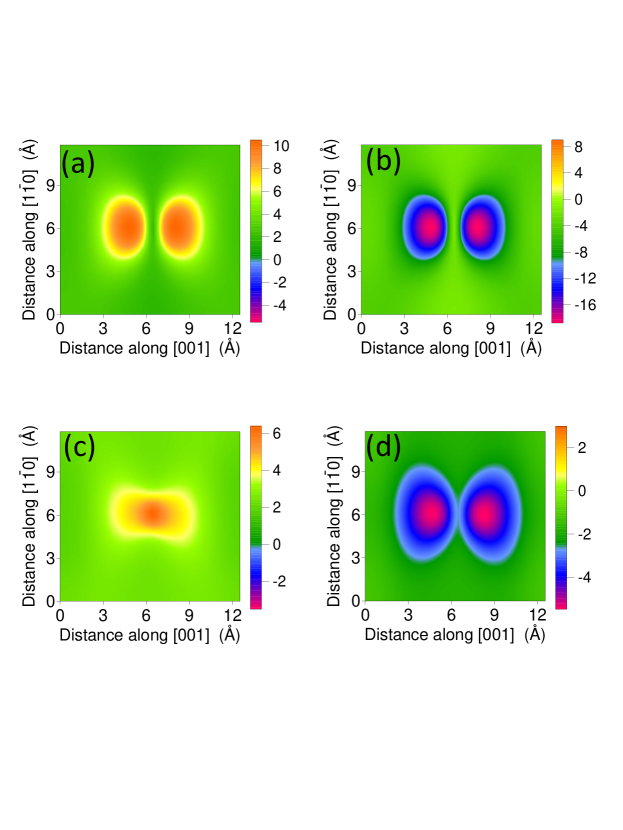
We start by analyzing the spatial distribution of the conductance change for the O molecule. A schematic diagram of the vibrational modes is depicted in Fig. 5. Figures 4 (a) and (b) show that the symmetrical O–O stretch mode leads to a decrease of conductance over the adsorbed molecule. In agreement with the experiment, the maximum absolute value of conductance change is displaced from the center of the oxygen atoms in the same way as the constant current STM image. This is reminiscent of the orbital, showing that the conductance decrease due to this vibrational mode can be understood within the framework of a single level resonant with the Fermi energy. Model calculations Persson demonstrated that the presence of a substantial density of states at the Fermi energy of large molecular character leads to an important IETS signal of negative sign, i. e. a reduction of conductance over the vibrational threshold, as observed here.
The antisymmetric stretch mode is more interesting. Here, the oxygen atoms move vertical to the surface with opposite phases. Again, in good agreement with the experiment, we find that while the change in conductance is negative away from the molecular center, it is positive at the molecular center [Figs. 4 (c) and (d)]. In contrast to the O–O stretch mode, this behavior implies that the IETS signal involve the coupling with various molecular orbitals and, therefore, we should go beyond the single-level model to understand this IETS image.
Simulations performed for the center-of-mass mode show a negative conductance change image rather similar to the one obtained for the O-O stretch mode. The maximum conductance decrease however is a factor of 5 lower in the center-of-mass, what explains the absence of signal in the experiments for this mode. The simulated efficiency for the hindered rotation mode, in which the atoms try to move opposite to each other along the surface direction, is even smaller: less than 0.8% of conductance change. Neither is this mode observed in the recorded IETS data.
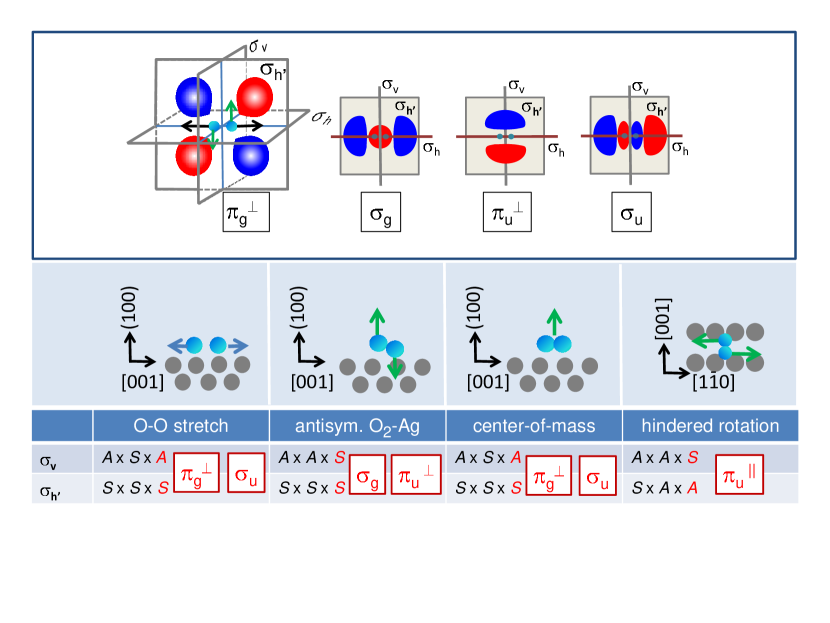
All the above results can be understood with the help of Eqs. (1) and (II.3). As the is the only MO at resonance with the Fermi level, the topography of the conductance changes is determined by the molecular orbitals coupling with such single resonance, i.e., by those MOs contributing with nonzero matrix elements in Eqs. (1) and (II.3). The symmetry analysis summarized in the table of Fig. 5 provides a preliminary idea of the MOs that can couple with the for each vibrational mode. The weight of these couplings in the IETS image will ultimately depend on the orbitals energies and on the strength of the electron-vibration coupling , as discussed below.
There are two well defined symmetry planes in this system: the plane perpendicular to the molecular axis and the plane normal to the surface that contains the molecular axis . The regions where the wave functions take positive and negative values are schematically depicted for each MO in the upper panel of Fig. 5 with blue and red colors, respectively. As written in the table, the is antisymmetric () respect to and symmetric () respect to . Since the O–O stretch mode is symmetric respect to both planes, the coupling electronic states should respectively be and . These conditions are only satisfied by the and the orbitals. The same conclusion is obtained for the center-of-mass mode, which is also symmetric respect to both planes. The and characters of the antisymmetric O2–Ag stretch mode respect to and , force the coupling of with the and the orbitals. Finally, the excitation of the hindered rotation mode, which presents a fully antisymmetric character, couples the with the orbital only.
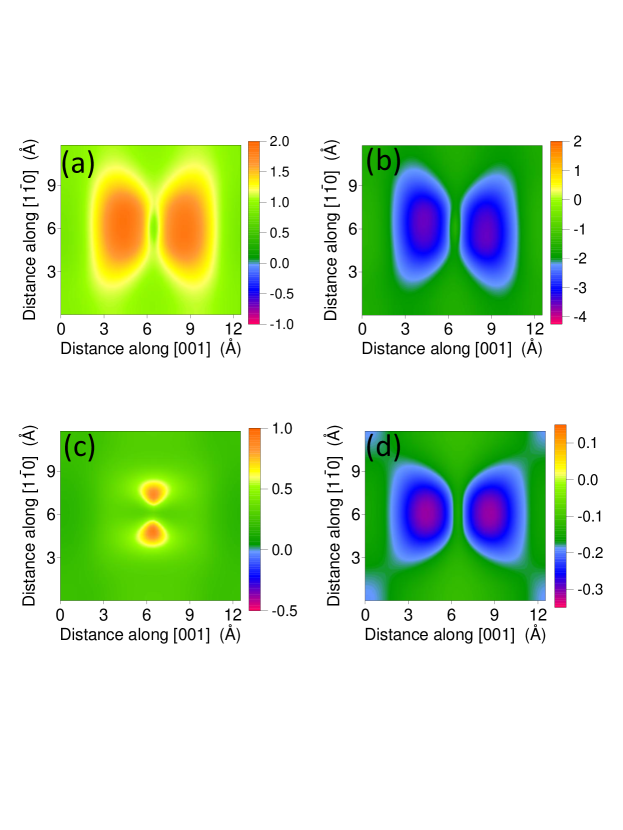
Once we know which orbitals are coupled by each vibrational mode, the topography of the IETS signal is better understood if the conductance change is divided in its inelastic contribution due to the opening of a new channel, hence positive, and the renormalization of the elastic channel due to the presence of the vibration that leads to a negative contribution. Figures 6 and 7 show the inelastic (left panels) and elastic (right panels) contributions for the four vibrational modes. According to Eqs. (1) and (II.3), the main difference between them despite their sign, is that the inelastic part involves all possible intermediate electronic states, while the states contributing to the elastic part are restricted by the extra -function to an energy interval of the order of the mode frequency about the Fermi energy. This strict energy restriction explains that in all cases the , being the only orbital at resonance with the Fermi level, dominates the topography of the elastic contribution.
In contrast, the inelastic image can be composed by all the coupling states that according to the symmetry analysis contribute with nonzero matrix elements in Eq. (1). The weight of each coupling state in the IETS image is partially determined by the denominator of Eq. (1), penalizing the orbitals that are energetically distant from . The effect of the different weighting is reflected in the simulations of the inelastic contributions. Figs. 6 (a) and 7 (a) show that the inelastic contribution is due to the (at resonance with ) and not to the energetically distant in the O–O stretch and center-of-mass modes. Otherwise, there would be a certain intensity modulation along the molecular axis caused by the nodes of the orbital. Similarly, the absence of nodes along the molecular axis and the maximum intensity obtained at the center of the molecule in Fig. 6 (c) show that the image is basically due to the and not to the in the antisymmetric stretch mode. In the hindered rotation mode, Fig. 7 (c) shows that the inelastic contribution is uniquely formed by the as predicted by the previous symmetry analysis.
Now we have all the ingredients necessary to understand the IETS data recorded for the O molecule. In the O–O stretch mode, the elastic and inelastic contributions are only due to the orbital. As the elastic part is much larger than the inelastic one, the excitation of this vibration leads to an overall reduction in conduction except between the O atoms where the orbital presents a nodal plane. Compared with the O–O stretch mode, the smaller elastic and inelastic contributions obtained in the center-of-mass mode are due to the weaker electron-phonon coupling, as can be roughly inferred from the different vibrational energy of each mode (see table 1). In consequence, no IETS signal is observed in the center-of-mass mode, despite its symmetry similarities with the O–O stretch mode. The antisymmetric O2–Ag mode is more complex because involve different orbitals: the inelastic part is dominated by and the elastic part by the . The rich structure observed in this mode is a consequence of the different nodal structure of the two orbitals. The total conductance change is positive in the region between the two oxygen atoms because the elastic contribution is zero whereas the inelastic one is maximal. On the contrary, the conductance change is negative out of the internuclear region because there the elastic part is maximal and the inelastic part minimal. Finally, the absence of IETS signal for the hindered rotation mode is a consequence of two factors: the low DOS with character around and the weak electron-phonon coupling of this mode.
We also perform simulations of the conductance changes for the O chemisorption state. The absence of experimental IETS signal is in agreement with our calculations that show changes of about 1% at most. The reason behind this low conductance changes is clear: as the is practically occupied, the probability to excite any vibrational mode by tunneling trough this MO is small.
V Bias dependence of IETS: a self-consistent Born approximation study
In order to compute the bias dependence of the inelastic signal, we use the self-consistent Born approximation SCBA. Briefly, the SCBA consists in using the Born expression for the electron-vibration self-energy (lowest order in the electron-vibration matrix element) replacing the free-electron Green’s function by the full Green’s function Jauho . This last function is unknown, hence an iterative process is used where the starting step is the free-electron Green’s function, and the second step uses the self-energy computed with the Green’s function obtained from the first step. This self-consistent procedure is stable and has the virtue of generating high-order terms in the electron-vibration coupling.
The SCBA has been implemented in DFT based approaches Reimers . But it is a costly method for evaluating STM scans as the ones shown herein. It is however feasible for a single STM conformation, where the bias is ramped and a spectrum is obtained. Here, we have simplified the problem and taken the tight-binding parametrization of Ref. Monturet08, .
As discussed in Ref. Ness, , the SCBA fails in the limit of large electron-vibration coupling. The main reason is because the SCBA fails in taking into account the correct contribution of the number of excited modes. Indeed, H. Ness Ness shows that SCBA yields the same result as an exact calculation if the electron-vibration matrix elements did not depend on the number of excited modes. If the average number of excited modes is in the order of one, then the SCBA gives a very good account of the vibrational excitation even in the case of extraordinary vibronic effects Frederiksen08 . Approaches going beyond SCBA are available Galperin06 ; Thoss and are necessary for exploring realistic situation where the electron-vibration coupling is strong enough to excite several overtones.
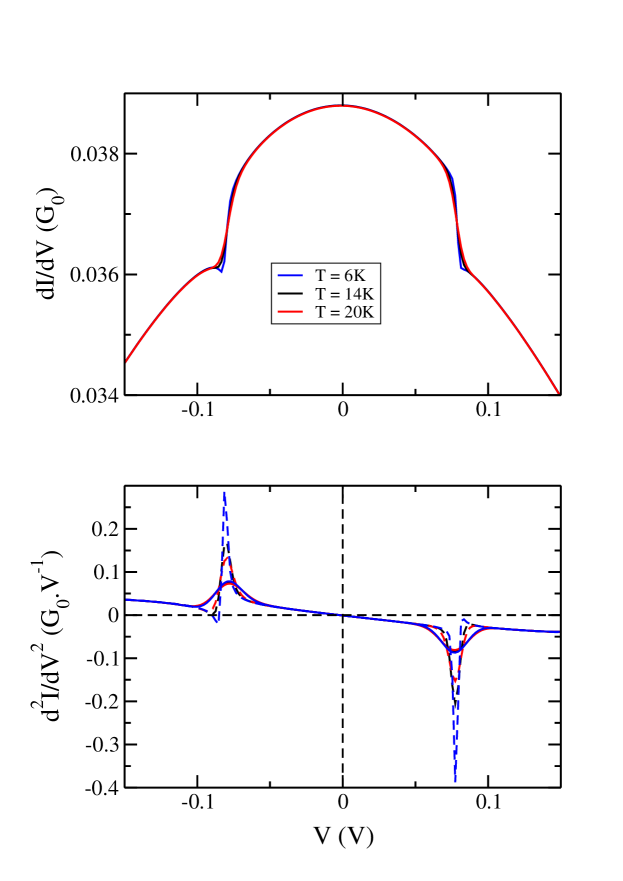
Figure 8 shows the results of the SCBA for the O–O stretch mode. Panel (a) shows the conductance, mainly given by the molecular resonance about the Fermi energy, and two sharp Stokes and anti-Stokes changes in conductance. In (b) the conductance derivative or is shown. In both cases three different temperatures are used, 6 K, 14 K and 20 K. At low temperatures the shows a Fano profile as has already been discussed for the excitation of vibrations by electronic currents Galperin04 , however as the temperature increases, the peak becomes broadened and closer to a simple Lorentzian peak. It is the modulation voltage used in the lock-in detection that finally broadens and removes any particular detail from the excitation peak. Figure 8 (b) shows in full line the peaks after convolution Frederiksen07b using a modulation voltage of 7 mV rms as in the experiment Hahn .
VI Conclusions
We have conducted STM-IETS simulations, based on the DFT+ electronic structure and applying an extension of the Tersoff-Hamman theory to the presence of inelastic effects Lorente2000 ; Lorente2004 . Our results are able to reproduce the experimental IETS recorded by Hahn et al. Hahn ; hahoprl01 : (i) the negative conductance changes observed in the vibrational spectra of the O molecule, (ii) the spatial distribution of the conductance changes recorded over the O molecule for the O–O stretch and the antisymmetric O2–Ag stretch vibrations, (iii) the absence of signal for the center-of-mass and hindered rotation modes, and (iv) the lack of IETS signal for the molecule chemisorbed along the direction. These results permit us to give an enhanced description of the IETS signals in terms of the molecular symmetries of the adsorbed system. Leading to the conclusion that a multi-orbital description is mandatory and that the simulation is able to capture the complex increases and decreases of conductance depending on the STM tip location over the molecule.
The good agreement of the simulations with the experiment validates the results of the electronic structure as computed with DFT+. In particular, DFT+ shows that out of the two possible molecular conformations on the surface, only the one along the direction is paramagnetic.
The inclusion of the correction does not alter the values of the other DFT parameters such as the molecular geometry and vibrational structure. Regarding vibrations, in order to attain reliable numerical values of the molecular frequencies, we have used a Morse potential to fit the DFT potential energy surface because anharmonicities rapidly set in and good frequency values are difficult to obtain.
Finally, Fano-like profiles are revealed for the IETS as a function of the bias voltage, however the two main sources of experimental broadening (temperature and more importantly the lock-in modulation voltage) erases any information of the actual spectral line shapes.
Acknowledgements.
We acknowledge financial support from the Spanish MICINN (No. FIS2007-066711-CO2-00 and No. FIS2009-12721-C04-01), and the Basque Government - UPV/EHU (grant No. IT-366-07). Computational resources were provided by the Centre de Calcul de Midi-Pyrénées, the DIPC and the SGI/IZO-SGIker.References
- (1) B. C. Stipe, M. A. Rezai, and W. Ho, Science 280, 1732 (1998).
- (2) W. Ho, J. Chem. Phys. 117, 11033 (2002).
- (3) T. Komeda, Progress in Surf. Sci. 78, 41 (2005).
- (4) N. Okabayashi, Y. Konda and T. Komeda, Phys. Rev. Lett. 100, 217801 (2008).
- (5) H. Gawronski, M. Mehlhorn and K. Morgenstern, Science 319, 930 (2008).
- (6) B. C. Stipe et al. Phys. Rev. Lett. 78, 4410 (1997).
- (7) M. Ohara, Y. Kim, S. Yanagisawa, Y. Morikawa, and M. Kawai, Phys. Rev. Lett. 100, 136104 (2008).
- (8) P. A. Gravil, D. M. Bird, and J. A. White, Phys. Rev. Lett. 77, 3933 (1996).
- (9) M. Alducin, H. F. Busnengo, and R. Díaz-Muino, J. Chem. Phys. , (2008).
- (10) L. Vattuone, C. Boragno, P. Restelli, M. Pupo, M. Rocca, and U. Valbusa, Phys. Rev. Lett. 72, 510 (1994).
- (11) A. Raukema, D. A. Butler, F. M. A. Box, and A. W. Kleyn, Surf. Sci. 347, 151 (1996).
- (12) F. Buatier de Mongeot, M. Rocca, and U. Valbusa, Surf. Sci. 363, 68 (1996).
- (13) F. Bartolucci, R. Franchy, J. C. Barnard, and R. E. Palmer Phys. Rev. Lett. 80, 5224 (1998).
- (14) J. R. Hahn, H. J. Lee, and W. Ho, Phys. Rev. Lett. 85, 1914 (2000).
- (15) J. R. Hahn and W. Ho, Phys. Rev. Lett. 87, 196102 (2001).
- (16) J. R. Hahn and W. Ho, J. Chem. Phys. 122, 244704 (2005); J. Chem. Phys. 123, 214702 (2005).
- (17) M. Alducin, D. Sánchez-Portal, A. Arnau, and N. Lorente to be published in Phys. Rev. Lett.
- (18) B.N.J. Persson and A. Baratoff, Phys. Rev. Lett. 59, 339 (1987).
- (19) N. Lorente and M. Persson, Phys. Rev. Lett. 85, 2997 (2000).
- (20) M. Paulsson, T. Frederiksen, H. Ueba, N. Lorente and M. Brandbyge, Phys. Rev. Lett. 100, 226604 (2008).
- (21) O. Tal, M. Krieger, B. Leerink and J. M. van Ruitenbeek, Phys. Rev. Lett. 100, 196804 (2008).
- (22) N. Lorente, Appl. Phys. A 78, 799 (2004).
- (23) G. Kresse and J. Hafner, Phys. Rev. B 47, 558 (1993); 48, 13115 (1993); G. Kresse and J. Furthmüller, Comput. Mater. Sci. 6, 15 (1996); Phys. Rev. B 54, 11169 (1996).
- (24) G. Kresse and D. Jourbert, Phys. Rev. B 59, 1758 (1998).
- (25) J. P. Perdew, J. A. Chevary, S.H. Vosko, K. A. Jackson, M.R. Pederson, D. J. Singh, and C. Fiolhais, Phys. Rev. B 46, 6671 (1992).
- (26) S. L. Dudarev, G. A. Botton, S. Y. Savrasov, C. J. Humphreys, and A. P. Sutton, Phys. Rev. B 57, 1505 (1998).
- (27) M. Cococcioni and S. de Gironcoli, Phys. Rev. B 71, 035105 (2005).
- (28) Richard Martin, Electronic Structure: Basic Theory and Practical Methods, Cambridge University Press, Cambridge (2004).
- (29) B. A. Sexton and R. J. Madix, Chem. Phys. Lett. 76, 294 (1980).
- (30) C. Backx, et al., Surf. Sci. 104, 300 (1981).
- (31) S. Monturet and N. Lorente, Phys. Rev. B 78, 035445 (2008).
- (32) M. Galperin, M. A. Ratner, and A. Nitzan, J. Chem. Phys. 121, 11965 (2004).
- (33) T. Frederiksen, M. Brandbyge, N. Lorente, and A.-P. Jauho, Phys. Rev. Lett. 93, 256601 (2004).
- (34) G. C. Solomon, A. Gagliardi, A. Pecchia, T. Frauenheim, A. Di Carlo, J. R. Reimers, and N. S. Hush, J. Chem. Phys. 124, 094704 (2006).
- (35) D. A. Ryndyk, M. Hartung. and G. Cuniberti, Phys. Rev. B 73, 045420 (2006).
- (36) The integration up to of the PDOS corresponding to the orbitals gives values of 1.35 in O and 1.8 in the O.
- (37) F. E. Olsson, N. Lorente, and M. Persson, Surf. Sci. 522, L27 (2003).
- (38) The coupling of the with the is less efficient because of the large energy difference between the two states.
- (39) H. Haug, A.-P. Jauho, Quantum kinetics in transport and optics of semiconductors, Springer-Verlag, Berlin, Heidelberg, (1996).
- (40) M. Galperin, A. Nitzan, and M. A. Ratner, Phys. Rev. B 73, 045314 (2006).
- (41) R. Härtle, C. Benesch and M. Thoss, Phys. Rev. Lett. 102, 146801 (2009).
- (42) J. R. Reimers, G. C. Solomon, A. Gagliardi, A. Bilić, N. S. Hush, T. Frauenheim, A. Di Carlo, and A. Pecchia, J. Phys. Chem. A 111, 5692 (2007).
- (43) H. Ness, J. Phys.: Condens. Matter 18, 6307 (2006).
- (44) T. Frederiksen, K. J. Franke, A. Arnau, G. Schulze, J. I. Pascual, and N. Lorente, Phys. Rev. B 78, 233401 (2008).
- (45) T. Frederiksen, M. Paulsson, A.-P. Jauho, and M. Brandbyge, Phys. Rev. B 75, 205413 (2007).
| Mode | Å | Å | Å | Experiment |
|---|---|---|---|---|
| O–O stretch | 91.5 | 89.7 | 90.4 | 82.0 Hahn |
| antisym. O2-Ag | 42.0 | 31.8 | 33.6 | 38.3 Hahn |
| center-of-mass | 35.2 | 22.5 | 25.1 | 30 Sexton ; Backx |
| hindered rotation | 34.5 | 37.8 | 34.5 | - |
| O–O | O–Ag | O2–surface | magnetization | ||||
|---|---|---|---|---|---|---|---|
| state | calculation | (Å) | (Å) | (Å) | () | ||
| O | GGA | 1.43 | 2.35 | 1.34 | 0.0 | ||
| GGA + = 3 eV | 1.41 | 2.37 | 1.34 | 0.54 | |||
| O | GGA | 1.45 | 2.36 | 1.12 | 0.0 | ||
| GGA + = 3 eV | 1.48 | 2.35 | 1.12 | 0.0 |