Hysteresis in the magneto-transport of Manganese-doped Germanium: evidence for carrier-mediated ferromagnetism
Abstract
We report the fabrication of Ge:Mn ferromagnetic semiconductors by Mn-ion implantation into Ge followed by pulsed laser annealing. Benefiting from the short time annealing, the hole concentration in Mn-implanted Ge has been increased by two orders of magnitude from 1018 to over 1020 cm-3. Likely due to the high hole concentration, we observe that the longitudinal and Hall resistances exhibit the same hysteresis as the magnetization, which is usually considered as a sign of carrier-mediated ferromagnetism.
I Introduction
Diluted ferromagnetic semiconductors (FMS) are considered to be promising materials for spintronic applications. FMS exhibit strong magneto-transport effects, namely negative magnetoresistance (MR) and the anomalous Hall effect (AHE).Ohno et al. (1992); Ferrand et al. (2001) GaAs:Mn has been intensively investigated during the last 20 years and is considered as the prototype FMS. Practically, it is desirable to have a FMS compatible with silicon technology. Manganese-doped germanium prepared using low-temperature molecular-beam epitaxy (LT-MBE) proves to be most promising due to the effective suppression of precipitate formation.Park et al. (2002); Jamet et al. (2006); Bougeard et al. (2006); Li et al. (2007) Two conclusions have been well established: (i) Mn segregation is unavoidable even at growth temperatures below 70 ∘C.Park et al. (2002); Jamet et al. (2006); Bougeard et al. (2006); Li et al. (2007); Devillers et al. (2007) (ii) Mn-rich precipitates, mainly Mn5Ge3 and Mn11Ge8, form inside the Mn-diluted Ge matrix when the growth temperature is higher than 70 ∘C Li et al. (2005a); Ahlers et al. (2006a) or during ion implantation at elevated temperatures Zhou et al. (2009a). On the other hand, various experiments evidence that diluted Mn ions are in the 2+ state Kang et al. (2005); Picozzi et al. (2005); Gambardella et al. (2007) and act as double acceptors in Ge. A substitutional occupation of Fe, Cu, and Ag in Ge was confirmed recently. Decoster et al. (2009) Thus, Mn-rich regions are embedded inside the Ge matrix together with substitutional Mn ions. The appearance of Mn-rich regions can be demonstrated by transmission electron microscopy and by zero-field-cooling/field-cooling (ZFC/FC) magnetization measurements. Jamet et al. (2006); Li et al. (2005a); Bougeard et al. (2006)
We notice that pronounced MR and AHE in the Ge:Mn system have been reported.Park et al. (2002); Tsui et al. (2003); Jamet et al. (2006); Li et al. (2007); Zeng et al. (2008); Deng et al. (2009) However, there are fundamental open questions. First of all, the correlation between magnetization, MR, and AHE, which is a hallmark of the GaAs:Mn FMS,Ohno et al. (1992); Ferrand et al. (2001) has not been proven for Ge:Mn so far. For isotropic and anisotropic magnetic samples the MR and AHE curves measured in van der Pauw geometry always reflect the field dependence of magnetization perpendicular to the sample surface. For example, GaAs:Mn grown on GaAs(001) has its hard axis of magnetization perpendicular to the sample surface. As expected the corresponding AHE curve does also not show an open hysteresis loop and is perfectly correlated with the hard axis magnetization perpendicular to the sample surface.Ohno et al. (1996) The reported MR and AHE in Ge:Mn are likely caused by superparamagnetic Mn ions or precipitates Riss et al. (2009) or by a two-band-like conduction.Zhou et al. (2009b) Note that only paramagnetic coupling between Mn impurities in Ge:Mn was revealed by X-ray magnetic circular dichroism Gambardella et al. (2007). Secondly, measurements of the resistivity versus temperature often reveal a small activation energy of several meV at low temperatures, Park et al. (2002); Tsui et al. (2003); Pinto et al. (2005); Riss et al. (2009) which is much smaller than the thermal ionization energy of Mn in Ge. Woodbury and Tyler (1955) Thirdly, the AHE curves measured above 10 K usually reveal a reversal in slope. Tsui et al. (2003); Jamet et al. (2006); Li et al. (2005b); Zeng et al. (2008) On the other hand, below 10 K the AHE has been reported to be absent. Riss et al. (2009)
We believe that the origin of these puzzling observations lies in the less effective substitution of Mn at Ge sites, which results in too low a hole concentration, making carrier-mediated ferromagnetism impossible. In previous work, the ferromagnetism in Ge:Mn has been non-quantitatively but plausibly explained by the formation of bound magnetic polarons (BMP). Park et al. (2002); Li et al. (2005b, a); Bougeard et al. (2006) According to the model of Kaminski and Das Sarma Kaminski and Das Sarma (2003) for GaAs:Mn with 8.5% Mn (Ref. Yuldashev et al., 2004) the critical hole concentration for percolation at 10 K amounts to 31019 cm-3. The hole concentrations realized in Ge:Mn grown by LT-MBE Park et al. (2002); Li et al. (2007); Tsui et al. (2003); Jamet et al. (2006); Ahlers et al. (2006b); Pinto et al. (2005) are mostly well below the threshold value of 31019 cm-3, which indicates the possible unsuitability of the LT-MBE approach to achieve a large hole concentration in Ge:Mn.
In this article we show that the hole concentration in Mn-implanted Ge can be strongly increased by short-time annealing. The largest hole concentration achieved is around cm-3 in samples after pulsed laser annealing (PLA), showing negative MR and AHE with the same hysteresis as the magnetization at low temperatures.
II Experimental
Nearly intrinsic, n-type Ge(001) wafers were implanted with Mn ions. The implantation energy and fluence were 100 keV, 30 keV and 5 cm-2, 1 cm-2, respectively, resulting in a box-like distribution of Mn ions with concentration around 10 % over a depth of 100 nm. During implantation the wafers were flow-cooled with liquid nitrogen to avoid the formation of any Mn-rich secondary phase. Pulsed laser annealing was performed using a laser ASAMA 80-8 and an optical system VOLCANO from INNOVAVENT GmbH. The pulse duration was 300 ns at a wavelength of 515 nm. The introduced energy density was 1.5 J/cm2. During annealing, the sample surface was scanned by a laser beam which was focused to a 2 mm40 m large stripe with a frequency of 50 kHz, instead of a large, symmetric laser spot of 55 mm2 used for GaAs:Mn. Bürger et al. (2010); Scarpulla et al. (2008) Structural analysis were performed using secondary ion mass spectrometry (SIMS) and transmission electron microscopy (TEM, FEI Titan). Magnetization properties were investigated with a superconducting quantum interference device (SQUID, Quantum Design MPMS) magnetometer. Magneto-transport was measured with a magnetic field applied perpendicularly to the film plane in van der Pauw geometry.
III Results and Discussion
III.1 Structural properties
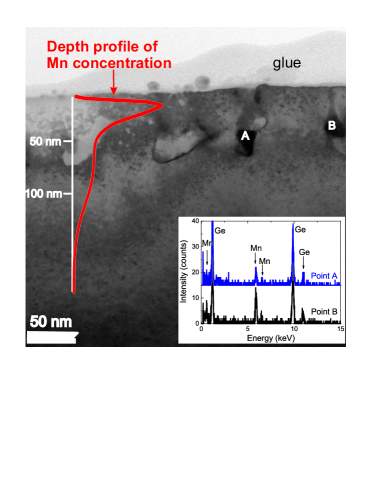
Fig. 1 shows the cross-sectional TEM image. In a ca. 60 nm thick top layer there are some tadpole-like regions with a size of 10–20 nm. Relative composition measurements by means of energy dispersive spectroscopy (EDS) reveal that those tadpole-like regions are Mn-rich (inset of Fig. 1). For instance, there are around 19 at.% and 26 at.% Mn in region A and B, respectively. This large Mn concentration does not correspond to any known Ge-Mn phase Jamet et al. (2006). On the other hand, the Mn-rich regions in the top layer are not percolating. Using high-resolution TEM, we found that the areas between the Mn-rich structures and the regions in the depth of 60–100 nm are coherent with the single crystalline Ge matrix. Using SIMS (shown as the read curve along the depth scale in Fig. 1), we observed an accumulation of Mn in the ca. 40 nm thick top layer after PLA. In the depth between 50–100 nm, Mn ions are uniformly distributed. We do not have an accurate absolute calibration, but the measurement is consistent with a Mn concentration of a few percent in this region. Therefore, by structural analysis we can conclude that after PLA the near-surface layer of Mn-implanted Ge contains Mn-rich tadpole-like regions, while most of the Mn is incorporated in a single crystalline Ge:Mn matrix.
III.2 Magnetism and Magneto-transport
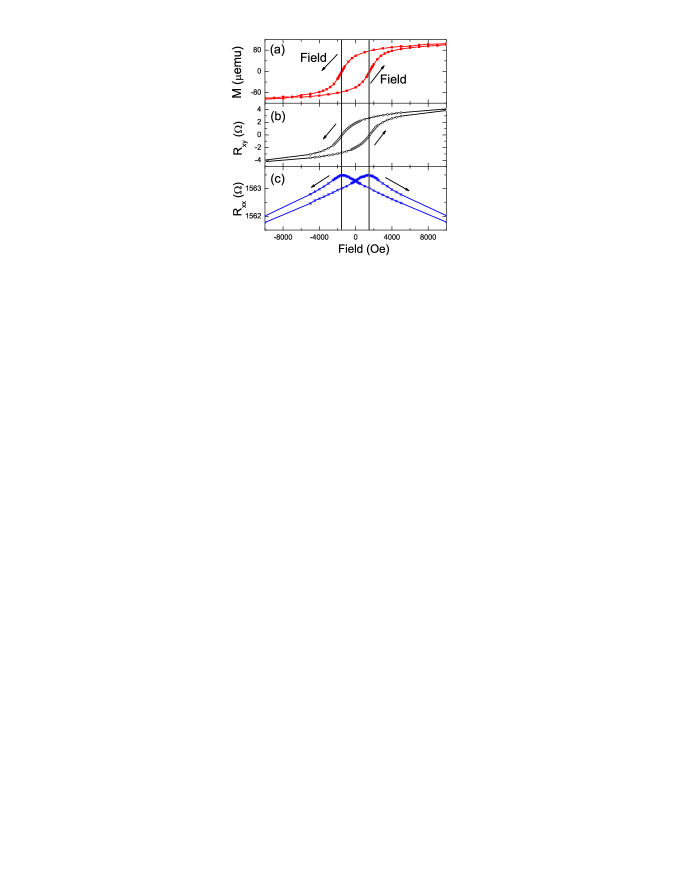
Fig. 2 shows the comparison of the field-dependent magnetization, Hall resistance, and longitudinal resistance at 5 K measured on the Ge:Mn sample after PLA, and represents a central result of the current paper. The involvement of holes in the ferromagnetism is unambiguously confirmed by the appearance of the AHE, and, especially, by the clear hysteresis loop in the Hall resistance. Note that the presence of ferromagnetic characteristics in SQUID measurements alone could also be caused by ferromagnetic precipitates, e.g., Mn5Ge3, in addition to or instead of a FMS. At low temperature, hysteresis appears in both the Hall and longitudinal resistance curves, with the same coercive field as in the magnetization. Such a correlation between AHE, MR, and magnetization is usually considered as the signature of FMS, Ohno et al. (1992); Ferrand et al. (2001) where the same set of holes contribute to ferromagnetism and transport Dietl et al. (2000). This also has been observed in compensated GaAs:Mn Yuldashev et al. (2004) and insulating GaP:Mn. Scarpulla et al. (2005) However, to our knowledge, the correlation between AHE, MR, and magnetization has never been observed for other Ge:Mn samples.
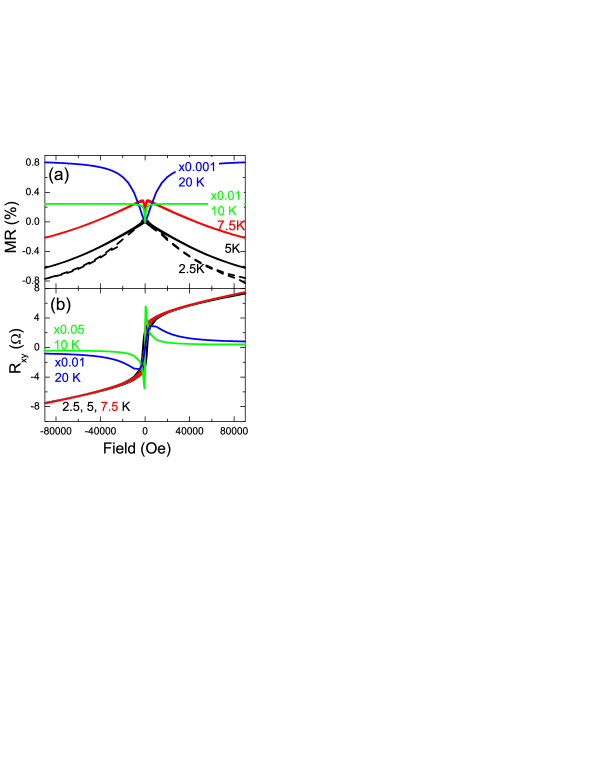
Here we point out that the hysteretic MR and AHE behavior only persists up to around 7.5 K as shown in Figs. 3(a) and (b). By a linear fitting of the Hall curves at large fields [Fig. 3(b)], we can calculate the hole concentration to be 2.11020 cm-3, which does not change between 2.5 and 7.5 K. However, the hole concentration could be largely underestimated due to the influence of the AHE, as in the case of the GaAs:Mn system. Omiya et al. (2000) Nevertheless, if we compare the hole concentration with the implantation fluence, we find that approximately 3.5% of the Mn atoms result in electrically active holes by neglecting any compensation effect from interstitial Mn. Above 7.5 K the sample only shows positive MR and AHE without hysteresis, similar as reported in the literature. Park et al. (2002); Tsui et al. (2003); Jamet et al. (2006); Li et al. (2005b); Riss et al. (2009); Zeng et al. (2008) In Ref. Jamet et al., 2006, an extensive discussion is given to understand the large positive MR in Ge:Mn. We proposed that a two-band-like conduction could induce the large positive MR and anomalous Hall resistance. Watts et al. (2000); Zhou et al. (2009b)
Above 7.5 K, the carriers contributing mainly to the electrical transport are not involved in carrier-induced ferromagnetism. Thus, the Hall effect behaves differently from the magnetization which exhibits hysteresis. As shown in Figs. 4, at 5 K both M and Rxy curves overlap with each other, while above 7.5 K there is no correlation between M and Rxy.
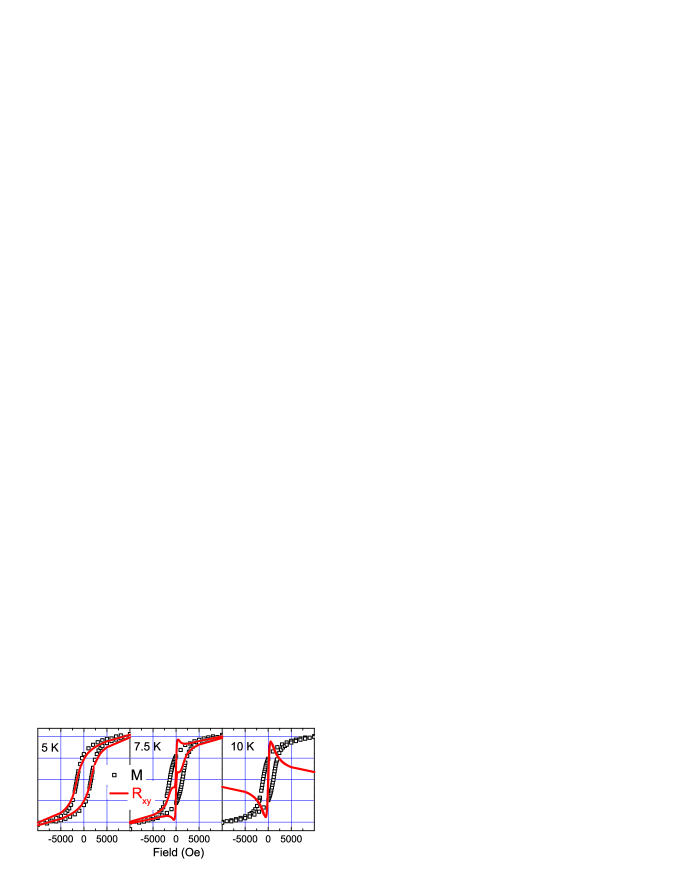
Fig. 5 shows the temperature-dependent magnetization at 10000 Oe and the coercive field, as well as the ZFC/FC curves at 50 Oe. We notice three distinct temperature regimes: (i) a weak temperature dependence of the coercive field below 10 K, (ii) a large drop of coercive field above 10 K, and (iii) a large drop of magnetization (in a field of 10000 Oe) at around 100 K. Together with the ZFC/FC curves, we can infer the following: Below 10 K, magnetic percolation occurs through the whole sample. Between 10 and 60 K, individual Mn-rich regions are spontaneously magnetized, and by applying a large field, the magnetization of the entire sample decreases only slightly with increasing temperature. Above the peak in the ZFC/FC curves, the ferromagnetic exchange collapses in most of the Mn-rich regions and the magnetization drops quickly with increasing temperature. We would like to point out, however, that concerning its magnetization properties the sample is still ferromagnetic above 100 K, as reported in the literature. Jamet et al. (2006); Li et al. (2005b); Bougeard et al. (2006); Li et al. (2007); Jaeger et al. (2006)
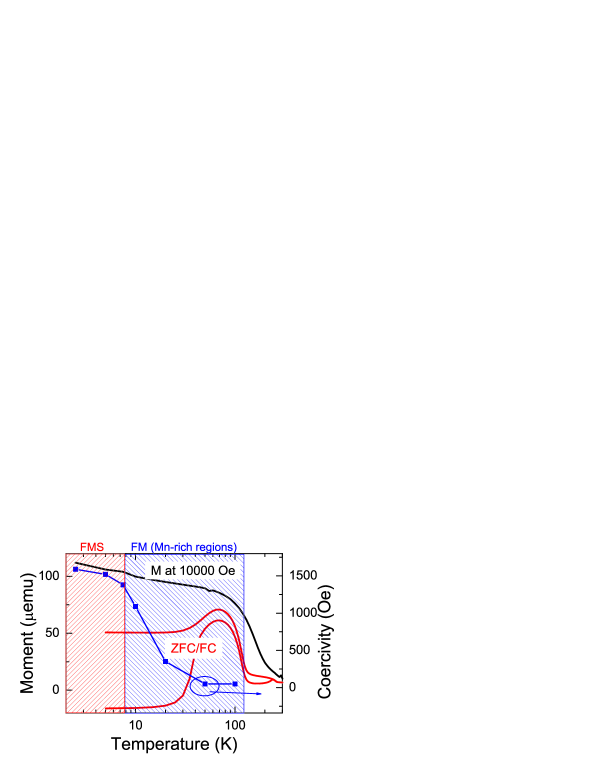
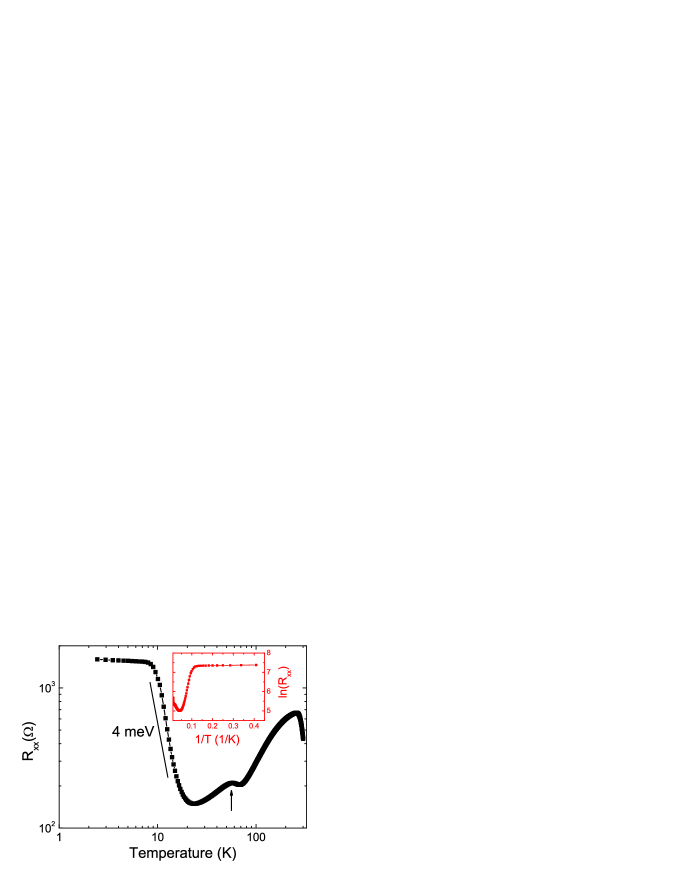
The most noticeable feature is the ZFC peak in the temperature range from 60 to 70 K. The peak position does not change upon increasing the field up to 500 Oe (not shown). For normal magnetic nanoparticles the corresponding ZFC peak moves to lower temperatures when applying a larger magnetic field. Zhou et al. (2008) Therefore, the Mn-rich regions are different from crystalline secondary phases. Such Mn-rich regions in Ge were also observed by other groups, Park et al. (2002); Bougeard et al. (2006); Li et al. (2005b) but the magnetic-field-independent ZFC peaks were found at a much lower temperature around 18 K. The ferromagnetism in those regions is believed to be hole-mediated. Bougeard et al. (2006); Li et al. (2005b) The ZFC/FC peaks in our samples occur at higher temperatures, which indicates a stronger ferromagnetic coupling inside the Mn-rich regions. According to the model of Kaminski and Das Sarma, Kaminski and Das Sarma (2003) the ferromagnetic transition in these regions leads to an immediate decrease in the hopping energy which gives rise to a non-monotonic temperature dependence of the sample resistance. A resistance peak at around TC of Mn-rich regions has been observed experimentally by Li et al. Li et al. (2005b) and is in fact also visible in the temperature-dependent resistance as shown in Fig. 6. At low temperature, there are two regions of fundamentally different behavior: Below 10 K, the resistance is nearly constant, i.e., quasi metallic. From 10 to 20 K the resistance decreases steeply with an activation energy of 4 meV. Such a temperature dependence appears to be a rather universal feature of Mn-doped Ge, Park et al. (2002); Tsui et al. (2003); Pinto et al. (2005); Riss et al. (2009) and is attributed to impurity band conduction. Pinto et al. (2005); Jamet et al. (2006); Riss et al. (2009) We will discuss below that this activation energy of 4 meV is related with the temperature-dependent occupation of the ground and first excited state of the Mn double acceptor which form impurity bands in Ge:Mn.
III.3 Theoretical picture of Ge:Mn
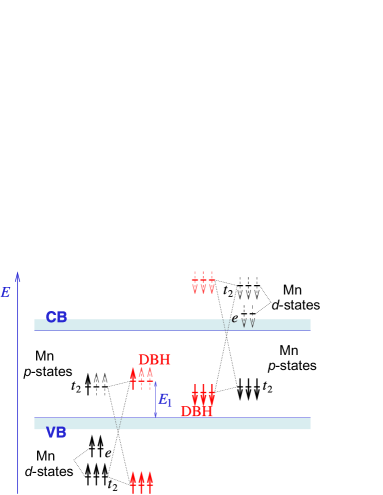
In analogy to substitutional Mn in GaAs:Mn, Mahadevan and Zunger (2003) we discuss the microscopic picture of substitutional Mn in Ge. The three Mn p-orbitals form the bound acceptor states of Mn and are subject to a crystal field of tetrahedral symmetry. They belong to the three-dimensional () representation of the tetrahedral group , which can be interpreted as a state with orbital angular momentum . Together with the spin , one finds that the acceptor state is sixfold degenerate. In the same crystal field, the five Mn d-orbitals split into three orbitals with character and two with character. In accordance with Hund’s rules for small crystal fields, all five are singly occupied and the electron spins are aligned. Let us assume that the d-shell spin is pointing upward. The five Mn d-orbitals with the d-shell spin pointing downward are unoccupied. The separation between the spin upward and spin downward Mn d-orbitals (Fig. 7) is mostly due to the on-site Coulomb repulsion. The -type spin-up d-orbitals hybridize with the -type spin-up acceptor states. This leads to level repulsion, which shifts the spin-up acceptor states (”dangling-bond hybrid”, DBH) upward in energy, as shown in Fig. 7. Analogously, level repulsion between the unoccupied spin-down d-orbitals and the spin-down acceptor states shifts the latter downward in energy. Mn is a double acceptor. The hole binding energy is found to be 0.16 eV from the valence band and 0.37 eV from the conduction band for the neutral and singly charged acceptor, respectively. Woodbury and Tyler (1955) In Fig. 7 the neutral acceptor is represented as two bound holes going into the single-particle states of highest electronic energy. Consequently, two spin-up electrons are missing and the total spin is reduced from what one would get from the Mn p-orbitals and d-orbitals alone. In this sense, the exchange interaction between the Mn d-states and acceptor p-states is antiferromagnetic.
To obtain the full picture, many-particle effects and spin-orbit coupling have to be taken into account. In the neutral Mn double acceptor with two bound holes, i.e., the complex likely relevant here, the electrons should combine to give a total angular momentum of magnitude according to Hund’s rules. Due to the antiferromagnetic interaction with the Mn d-shell spin we obtain a total angular momentum with in the ground state and in the first excited state. The splitting between the ground-state doublet and the excited state quartet has not been determined so far. We attribute the thermal activation energy of 4 meV from 10 to 20 K as shown in Fig. 6 to the transition between the total angular momentum states and of neutral Mn double acceptors. The exchange interaction can be written as Consequently, the splitting between the ground state (, and ) and the first excited state (, and ) is 4 meV and the exchange constant is 2.7 meV. This is comparable to in GaAs:Mn amounting to 2.5–5.5 meV. Dietl et al. (2000) Furthermore, independently of the third Hund coupling compared to , the calculated spin polarization of the holes in the ground state amounts to -0.33. If the third Hund coupling is small compared to , as is likely the case, the calculated spin polarization in the first excited state amounts to -0.44. Due to the increased spin polarization in the first excited state compared to the ground state, the hole mobility in the first excited state is likely also higher than in the ground state due to the suppression of spin-flip scattering. We therefore propose that the thermally activated behavior seen in Fig. 6 around 10–20 K is due to the first excited state becoming accessible, which opens another conducting channel with a larger mobility. However, a definite explanation for the resistance drop is not possible at present due to the strong anomalous Hall effect, which inhibits a complete determination of carrier concentration and mobility as a function of temperature.
Note that the microscopic picture of an antiferromagnetic coupling between holes and Mn ions is consistent with the macroscopic picture of the
BMP theory proposed by Kaminski and Das Sarma. Kaminski and Das Sarma (2003) When the temperature is low, the ferromagnetic transition will first
occur locally in the regions with larger carrier concentration. As the temperature decreases, these finite-size regions, which have random
shapes and positions, grow and merge, and finally percolation over the whole sample occurs. Therefore, the Ge:Mn FMS material will be rather
described as a combination of Mn-rich and Mn-poor regions with diluted Mn ions. The substitutional Mn ions introduce holes, acting as seeds for
BMPs. The number and size of BMPs increase with the hole concentration and with decreasing temperature, respectively. Within such a picture we
can understand the investigated Ge:Mn sample and also shed light on the absence of hysteretic MR and AHE in the literature. The hole
concentration is the critical parameter for FMS behavior, as seen for GaAs:Mn. Yuldashev et al. (2004) A large enough hole concentration
(2.11020 cm-3) gives rise to the carrier-mediated ferromagnetism throughout the Ge:Mn sample presented here. In addition to
the sample discussed here, we also investigated Ge:Mn samples with lower hole concentration. In those samples we observed ferromagnetism up to
around 100 K, but no hysteretic magneto-transport down to 5 K. Zhou et al. (2010) This appears similar to Refs.
Jamet et al., 2006; Li et al., 2005b; Bougeard et al., 2006; Li et al., 2007; Jaeger et al., 2006, where a ferromagnetic phase with a high TC was
reported due to the Mn-rich regions, but the hysteretic magneto-transport was absent, most likely due to the low hole concentration.
IV Conclusion
In conclusion, using the approach of Mn-ion implantation into Ge and subsequent pulsed laser annealing, we have been able to increase the hole concentration by two orders of magnitude compared to LT-MBE growth. Below 10 K, we observe negative magnetoresistance and anomalous Hall effect, exhibiting the same hysteresis as the magnetization. In contrast, such effects are absent in samples with a smaller hole concentration. The magnetic and magneto-transport properties can be qualitatively well explained within a picture of dopant segregation and the formation of bound magnetic polarons.
Acknowledgements.
Financial support from the Bundesministerium für Bildung und Forschung (FKZ13N10144) is gratefully acknowledged.References
- Ohno et al. (1992) H. Ohno, H. Munekata, T. Penney, S. von Molnár, and L. L. Chang, Phys. Rev. Lett. 68, 2664 (1992).
- Ferrand et al. (2001) D. Ferrand, J. Cibert, A. Wasiela, C. Bourgognon, S. Tatarenko, G. Fishman, T. Andrearczyk, J. Jaroszyski, S. Koleśnik, T. Dietl, et al., Phys. Rev. B 63, 085201 (2001).
- Park et al. (2002) Y. D. Park, A. T. Hanbicki, S. C. Erwin, C. S. Hellberg, J. M. Sullivan, J. E. Mattson, T. F. Ambrose, A. Wilson, G. Spanos, and B. T. Jonker, Science 295, 651 (2002).
- Jamet et al. (2006) M. Jamet, A. Barski, T. Devillers, V. Poydenot, R. Dujardin, P. Bayle-Guillemaud, J. Rothman, E. Bellet-Amalric, A. Marty, J. Cibert, R. Mattana, S. Tatarenko, Nat. Mater. 5, 653 (2006).
- Bougeard et al. (2006) D. Bougeard, S. Ahlers, A. Trampert, N. Sircar, and G. Abstreiter, Phys. Rev. Lett. 97, 237202 (2006).
- Li et al. (2007) A. P. Li, C. Zeng, K. van Benthem, M. F. Chisholm, J. Shen, S. V. S. N. Rao, S. K. Dixit, L. C. Feldman, A. G. Petukhov, M. Foygel, H. H Weitering, Phys. Rev. B 75, 201201 (2007).
- Devillers et al. (2007) T. Devillers, M. Jamet, A. Barski, V. Poydenot, P. Bayle-Guillemaud, E. Bellet-Amalric, S. Cherifi, and J. Cibert, Phys. Rev. B 76, 205306 (2007).
- Li et al. (2005a) A. P. Li, J. Shen, J. R. Thompson, and H. H. Weitering, Appl. Phys. Lett. 86, 152507 (2005a).
- Ahlers et al. (2006a) S. Ahlers, D. Bougeard, N. Sircar, G. Abstreiter, A. Trampert, M. Opel, and R. Gross, Phys. Rev. B 74, 214411 (2006a).
- Zhou et al. (2009a) S. Zhou, A. Shalimov, K. Potzger, N. M. Jeutter, C. Baehtz, M. Helm, J. Fassbender, and H. Schmidt, Appl. Phys. Lett. 95, 192505 (2009a).
- Kang et al. (2005) J.-S. Kang, G. Kim, S. C. Wi, S. S. Lee, S. Choi, S. Cho, S. W. Han, K. H. Kim, H. J. Song, H. J. Shin, A. Sekiyama, S. Kasai, S. Suga, B. I. Min, Phys. Rev. Lett. 94, 147202 (2005).
- Picozzi et al. (2005) S. Picozzi, L. Ottaviano, M. Passacantando, G. Profeta, A. Continenza, F. Priolo, M. Kim, and A. J. Freeman, Appl. Phys. Lett. 86, 062501 (2005).
- Gambardella et al. (2007) P. Gambardella, L. Claude, S. Rusponi, K. J. Franke, H. Brune, J. Raabe, F. Nolting, P. Bencok, A. T. Hanbicki, B. T. Jonker, C. Grazioli, M. Veronese, C. Carbone, Phys. Rev. B 75, 125211 (2007).
- Decoster et al. (2009) S. Decoster, S. Cottenier, B. De Vries, H. Emmerich, U. Wahl, J. G. Correia, and A. Vantomme, Phys. Rev. Lett. 102, 065502 (2009).
- Tsui et al. (2003) F. Tsui, L. He, L. Ma, A. Tkachuk, Y. S. Chu, K. Nakajima, and T. Chikyow, Phys. Rev. Lett. 91, 177203 (2003).
- Zeng et al. (2008) C. Zeng, Z. Zhang, K. van Benthem, M. F. Chisholm, and H. H. Weitering, Phys. Rev. Lett. 100, 066101 (2008).
- Deng et al. (2009) J. X. Deng, Y. F. Tian, S. M. He, H. L. Bai, T. S. Xu, S. S. Yan, Y. Y. Dai, Y. X. Chen, G. L. Liu, and L. M. Mei, Appl. Phys. Lett. 95, 062513 (2009).
- Ohno et al. (1996) H. Ohno, A. Shen, F. Matsukura, A. Oiwa, A. Endo, S. Katsumoto, and Y. Iye, Appl. Phys. Lett. 69, 363 (1996).
- Riss et al. (2009) O. Riss, A. Gerber, I. Y. Korenblit, A. Suslov, M. Passacantando, and L. Ottaviano, Phys. Rev. B 79, 241202(R) (2009).
- Zhou et al. (2009b) S. Zhou, D. Bürger, M. Helm, and H. Schmidt, Appl. Phys. Lett. 95, 172103 (2009b).
- Pinto et al. (2005) N. Pinto, L. Morresi, M. Ficcadenti, R. Murri, F. D‘Orazio, F. Lucari, L. Boarino, and G. Amato, Phys. Rev. B 72, 165203 (2005).
- Woodbury and Tyler (1955) H. H. Woodbury and W. W. Tyler, Phys. Rev. 100, 659 (1955).
- Li et al. (2005b) A. P. Li, J. F. Wendelken, J. Shen, L. C. Feldman, J. R. Thompson, and H. H. Weitering, Phys. Rev. B 72, 195205 (2005b).
- Kaminski and Das Sarma (2003) A. Kaminski and S. Das Sarma, Phys. Rev. B 68, 235210 (2003).
- Yuldashev et al. (2004) S. U. Yuldashev, H. C. Jeon, H. S. Im, T. W. Kang, S. H. Lee, and J. K. Furdyna, Phys. Rev. B 70, 193203 (2004).
- Ahlers et al. (2006b) S. Ahlers, D. Bougeard, H. Riedl, G. Abstreiter, A. Trampert, W. Kipferl, M. Sperl, A. Bergmaier, and G. Dollinger, Physica E 32, 422 (2006b).
- Bürger et al. (2010) D. Bürger, S. Zhou, M. Pandey, C. Viswanadham, J. Grenzer, O. Roshchupkina, W. Anwand, H. R. V. Gottschalch, M. Helm, and H. Schmidt, Phys. Rev. B 81, 115202 (2010).
- Scarpulla et al. (2008) M. A. Scarpulla, R. Farshchi, P. R. Stone, R. V. Chopdekar, K. M. Yu, Y. Suzuki, and O. D. Dubon, J. Appl. Phys. 103, 073913 (2008).
- Dietl et al. (2000) T. Dietl, H. Ohno, F. Matsukura, J. Cibert, and D. Ferrand, Science 287, 1019 (2000).
- Scarpulla et al. (2005) M. A. Scarpulla, B. L. Cardozo, R. Farshchi, W. M. H. Oo, M. D. McCluskey, K. M. Yu, and O. D. Dubon, Phys. Rev. Lett. 95, 207204 (2005).
- Omiya et al. (2000) T. Omiya, F. Matsukura, T. Dietl, Y. Ohno, T. Sakon, M. Motokawa, and H. Ohno, Physica E 7, 976 (2000).
- Watts et al. (2000) S. M. Watts, S. Wirth, S. von Molnár, A. Barry, and J. M. D. Coey, Phys. Rev. B 61, 9621 (2000).
- Jaeger et al. (2006) C. Jaeger, C. Bihler, T. Vallaitis, S. T. B. Goennenwein, M. Opel, R. Gross, and M. S. Brandt, Phys. Rev. B 74, 045330 (2006).
- Zhou et al. (2008) S. Zhou, K. Potzger, J. von Borany, R. Grötzschel, W. Skorupa, M. Helm, and J. Fassbender, Phys. Rev. B 77, 035209 (2008).
- Mahadevan and Zunger (2003) P. Mahadevan and A. Zunger, Phys. Rev. B 68, 075202 (2003).
- Zhou et al. (2010) S. Zhou, D. Bürger, C. Baumgart, A. Mücklich, W. Skorupa, C. Timm, P. Oesterlin, M. Helm, and H. Schmidt (2010), unpublished.