A detailed study of the accretion disk surrounding the high-mass protostar NGC 7538 S
Abstract
We present deep high angular resolution observations of the high-mass protostar NGC 7538 S, which is in the center of a cold dense cloud core with a radius of 0.5 pc and a mass of 2,000 M⊙. These observations show that NGC 7538 S is embedded in a compact elliptical core with a mass of 85 - 115 M⊙. The star is surrounded by a rotating accretion disk, which powers a very young, hot molecular outflow approximately perpendicular to the rotating accretion disk. The accretion rate is very high, 1.4 – 2.8 10-3 M⊙ yr-1. Evidence for rotation of the disk surrounding the star is seen in all largely optically thin molecular tracers, H13CN J = , HN13C J = , H13CO+ J = , and DCN J = . Many molecules appear to be affected by the hot molecular outflow, including DCN and H13CO+. The emission from CH3CN, which has often been used to trace disk rotation in young high-mass stars, is dominated by the outflow, especially at higher K-levels. Our new high-angular resolution observations show that the rotationally supported part of the disk is smaller than we previously estimated. The enclosed mass of the inner, rotationally supported part of the disk (D 5′′, i.e 14,000 AU) is 14 - 24 M⊙.
Subject headings:
ISM: clouds – (stars:) circumstellar matter – stars: formation – stars: pre-main sequence – submillimeter1. Introduction
How high-mass stars are formed is still under debate. High-mass stars are believed to form the same way as low mass stars, i.e. with a rotating accretion disk and driving an outflow, but in denser environments and with much higher accretion rates (Wolfire & Cassinelli, 1987; Stahler et al., 2000; Norberg & Maeder, 2000; McKee & Tan, 2002; Keto, 2003, 2007). However, others argue that high-mass stars are most likely formed by competitive accretion in a clustered environment (Bonnell & Bate, 2006), or by adiabatic accretion of gas from the surrounding cluster to densities such that stellar collisions are likely to occur (Clarke & Bonnell, 2008).
Accretion disks are ubiquitous in young low- and intermediate-mass stars, i.e. T Tauri and Herbig Ae stars (Simon, Dutrey & Guilloteau, 2000; Mannings & Sargent, 1997; Najita et al., 2003), which have sizes of one to a few hundred AU and appear to be in Keplerian rotation. Disks are also common in Class I objects, i.e. younger, more heavily embedded low- and intermediate mass pre-main-sequence stars (Brown & Chandler, 1999), but there are very few examples of confirmed disks for the very earliest stages of a low-mass protostar, the Class 0 phase (Jørgensen, 2004; Chandler et al., 2005). At the Class 0 phase, the temperature of the protostellar disk is of the same order of that of the collapsing cloud core, and it is therefore an observational challenge to get enough contrast between the disk and the cloud core.
The situation is even worse for high-mass stars, because they form in much denser environments and always in clusters or small groups. The survival time of disks in high-mass stars is furthermore expected to be much shorter, because once the star is formed it will quickly photo evaporate the disk as soon as the accretion from the surrounding cloud starts to diminish, therefore allowing the uv-photons to reach the disk surface. Yet there are several detections of disks around early B-stars; Lkh 101 (Spectral class B0) (Tuthill et al., 2002), MWC297 (B1.5) (Manoj et al., 2007), MWC 349 A (B [e]) (Weintroub et al., 2008), clearly confirming that disks do exist around relatively massive stars.
Most young high-mass stars appear to drive outflows (Shepherd & Churchwell, 1996; Zhang et al., 2001, 2005; Beuther et al., 2002b), but whether they also have accretion disks is less clear. There have been many reports of disks around high-mass stars, but only a few which appear well supported. Two of the most clearcut cases are IRAS (Cesaroni et al., 1997, 1999, 2005; Zhang et al., 1998), and AFGL 490 (Schreyer et al., 2006). IRAS has a luminosity of 1.3 104 L⊙ suggesting an early B star. The star drives a parsec scale CO outflow (Wilking et al., 1990; Shepherd et al., 2000), and is surrounded by a rotating accretion disk with a diameter of 15,000 A.U. (Cesaroni et al., 2005). The observed rotation curve for an edge-on Keplerian disk corresponds to 7 M⊙. The luminosity of AFGL 490, L 2 103 L⊙ also suggests an early B-star. It drives a more compact outflow, 0.3 pc (corrected for inclination) (Lada & Harvey, 1981; Snell et al., 1984) and is surrounded by a nearly face-on disk with a radius 1600 AU, which has a disk mass of 1 M⊙ and appears to be in Keplerian rotation (Schreyer et al., 2006). Another, even younger high-mass protostar, NGC 7538 S, with a luminosity of 1.5 104 L⊙, which is surrounded by a large, nearly edge-on disk with a radius of 15,000 AU and a disk mass of 100 M⊙ was reported by Sandell, Wright & Forster (2003). The disk drives a compact molecular outflow with a size of 0.1 - 0.4 pc and shows a Keplerian-like rotation.
This disk is the target for our studies. In this paper we present follow-up BIMA spectral line observations of several molecules in the 3 and 1 mm bands, which were chosen to measure the rotation of the disk surrounding NGC 7538 S. In a companion paper (Corder et al., in preparation; hereafter Paper II) we discuss high-angular resolution continuum observations of NGC 7538 S and the Ultra-Compact H II regions NGC 7538 IRS 1 - 3 with BIMA, CARMA, and the VLA, which provide us with better mass estimates of the disk/envelope surrounding the star.
2. Observations and Data Reduction
2.1. BIMA array observations
Between 2002 and 2004 we obtained more observations on NGC 7538 S with the BIMA array at 86 and 89 GHz. These observations are summarized in Table 1. At 3.4 mm (87 GHz) we combined additional data obtained in the B, C and D array configurations with the data reported by (Sandell, Wright & Forster, 2003) to produce deep high fidelity maps in H13CN , HCO+ , SO and NH2D 1. We also improved the H13CO+ , HN13C , and SiO , by adding a B-array track to the existing C-array data. All these observations use the same correlator setup and were reduced as described in Sandell, Wright & Forster (2003).
Table 2 summarizes the spectral line observations at 1.4 mm (220 GHz), which we obtained with BIMA during the same time frame as the 3.4 mm observations. These 1.4 mm observations were obtained in the B and C configurations, and provide similar angular resolution as the 87 GHz data sets. In this paper we discuss the results from DCN J = and CH3CN J = (K = 0 to 5), which were expected to be optically thin and hence good tracers of the accretion disk. Our observations also included SO J = , H2CO 3 and 3, and 13CO J = (Table 2), but the lines are optically thick and self-absorbed and do not provide us any information on the deeply embedded accretion disk. We therefore leave the discussion of these lines to a later paper.
The 1 mm data were reduced and imaged in a standard way using MIRIAD software (Sault, Teuben & Wright, 1995). The quasar 0102584 was used as phase calibrator and Mars and/or 3C84 for passband and flux calibration. The uncertainty in the absolute amplitude scale is 20% at 1.4 mm, but the relative amplitude of the spectral lines observed simultaneously is 5 %.
The BIMA array, like every interferometer, will filter out extended, relatively uniform emission, resulting in an underestimate the total emission (missing flux). Furthermore, extended emission will cause negative features in the spectra, which may look like self-absorption. Since we expect to see self-absorption if the protostellar disk is warmer than the surrounding cloud, it becomes difficult, if not impossible, to judge what features are real, and what are artifacts, unless we fill in missing short uv-spacings. We therefore carried out observations with FCRAO at 3.4 mm band and with JCMT at 1.4 mm to provide missing short spacings for several key molecules.
| Molecule | transition | rest frequency |
|---|---|---|
| [GHz] | ||
| Frequency setting: H13CN ; Array configurations BCD, | ||
| HPBW = 60 57 pa = -25.8∘ | ||
| Observing dates: 01/27/02, 01/31/02, 05/03/02, 08/09/03, | ||
| 11/04/03, 12/11/0312/12/03, 12/31/03 | ||
| NH2D | 1 F′ - F′′ = 0 - 1 | 85.924747 |
| NH2D | 1 F′ - F′′ = 2 - 1 | 85.925684 |
| NH2D | 1 F′ - F′′ = 2 - 2/1 - 1 | 85.926263 |
| NH2D | 1 F′ - F′′ = 1 - 2 | 85.926858 |
| NH2D | 1 F′ - F′′ = 1 - 0 | 85.927721 |
| SO | 86.09355 | |
| H13CN | F = 1 - 1 | 86.338767 |
| H13CN | F = 2 - 1 | 86.340184 |
| H13CN | F = 0 - 1 | 86.342274 |
| HCO+ | 89.188518 | |
| Frequency setting: H13CO+ ; Array configurations BC, | ||
| HPBW = 79 69 pa = -23.8∘ | ||
| Observing dates: 12/03/01, 01/10/04 | ||
| H13CO+ | 86.754294 | |
| SiO | v=0 | 86.846998 |
| HN13C | F = 0-1 | 87.090735 |
| HN13C | F = 2-1 | 87.090859 |
| HN13C | F = 1-1 | 87.090942 |
| Molecule | transition | rest frequency |
|---|---|---|
| [GHz] | ||
| Frequency setting: H2CO 3; array configurations: BC | ||
| HPBW = 66 57 pa = 78.4∘ | ||
| Observing dates: 10/9/02, 10/16/02 | ||
| SO | 215.22065 | |
| H2CO | 3 | 218.22219 |
| H2CO | 3 | 218.47564 |
| Frequency setting: DCN ; array configurations: BC | ||
| HPBW = 29 24 pa = 22.2∘ | ||
| Observing dates: 10/13/02, 04/19/03, 05/01/03, 10/10/03, | ||
| 10/25/03, 01/03/04, 01/05/04 | ||
| DCN | 217.23853 | |
| 13CO | 220.39869 | |
| CH3CN | 12 | 220.74727 |
| CH3CN | 12 | 220.74302 |
| CH3CN | 12 | 220.73027 |
| CH3CN | 12 | 220.70903 |
| CH3CN | 12 | 220.6793 |
| CH3CN | 12 | 220.64109 |
| CH3CN | 12 | 220.59443 |
| CH313CN | 12 | 220.62108 |
| CH313CN | 12 | 220.59994 |
2.2. FCRAO observations
The observations were carried out on November 9, 2004 by Dr. Mark Heyer with the 14-m Five College Radio Astronomy Observatory (FCRAO) telescope using the SEQUOIA 16 beam array receiver. The weather conditions were excellent, resulting in a system temperature, Tsys 120 K. We used the dual channel correlator (DCC) with a 50 MHz bandwidth and a spectral resolution of 48.8 kHz ( 0.16 km s-1). The DCC was configured to simultaneously cover H13CN and HCO+ . At 86 and 89 GHz the half-power beam width (HPBW) is 58′′ and 57′′, respectively, while the main-beam efficiency, 0.50. The observations were performed using on-the-fly (OTF) mapping, covering a 9′ 9′ area centered at = 23h 13m 454, = 61∘ 28′ 105, and covering the whole molecular cloud associated with NGC 7538. The OTF maps were re-gridded to a cell size 20′′. Both data sets were merged with our BIMA data using the MIRIAD task IMMERGE and assuming the HPBWs and efficiencies for FCRAO quoted above. The single dish and interferometer data were compared in the Fourier domain in a range of overlapping spatial frequencies corresponding to 6-10m to align the flux calibration scales.
2.3. JCMT observations
Complementary single dish observations (projects m04ai09 and m05ai07) were carried out in service mode on the James Clerk Maxwell Telescope (JCMT)111The JCMT is operated by the Joint Astronomy Centre, on behalf of the UK Particle Physics and Astronomy Research Council, the Netherlands Organization for Scientific Research, and the Canadian National Research Council. on Mauna Kea, Hawaii, between April 2004 and May 2005. With JCMT we obtained fully sampled maps of DCN , H2CO 3 and 3, 13CO , and C18O , as well as long integration (10 - 30 min) single spectra at the center position (NGC 7538 S). We also took deep (long integration) spectra of 12CO and C17O . All these observations used receiver RxA3, a single beam SiS mixer covering the 1.3 mm spectral window. At 217 GHz the measured HPBW is 223 and the main beam efficiency, = 0.70. All maps were made in OTF-mode with heavy oversampling; 5′′ sampling interval with an integration time of 5 second per resolution element. The maps have a size 55′′ 45′′. We used the Digital Autocorrelator Spectrometer (DAS) with 125 MHz bandwidth (13CO and C18O) or 250 MHz bandwidth (DCN, H2CO) providing us with spectral resolutions 78.1 kHz and 156.2 kHz, respectively. Most of the observing was in wet weather conditions, resulting in system temperatures, Tsys of 400 - 450 K. The receiver calibration was regularly checked on planets (Uranus or Mars) and we always took reference spectra on NGC 7538 IRS 1.
Our DCN setup also included the SiO transition at 217.10494 GHz. In total we acquired 10 maps, because the line is rather faint. Some scans had poor baseline stability and had to be thrown out, and for most of the observations we had to use high order polynomials for baseline subtraction. During the data reduction we discovered an additional line in our spectra, which we identified as the SO2 13 at 225.153689 GHz, i.e. in the upper sideband. SiO and SO2 show broad line wings, indicating that the emission is strongly affected by the outflow. The DCN-map shows that the emission is rather compact with a size 30′′. When we add it to the BIMA data, we do not see any changes in the morphology of the DCN emission. However, since the combined map had poorer signal to noise due to insufficient integration time, we make use of only the high-angular resolution BIMA map in this paper.
Both H2CO transitions were observed simultaneously. We obtained three maps with good quality. The coadded map matched well the noise level in our BIMA data. At 13CO we obtained a total of 7 maps, largely because we needed good SNR on the faint wings from the outflow. The coadded map was of very good quality and was successfully added to our BIMA data on 13CO. For C18O we obtained 4 maps, also of good quality. Since we never mapped NGC 7538 S with BIMA in C18O, we have used this map stand-alone to look at the large scale morphology of the cloud core.
| Molecule | Transition | HPBW | |||
|---|---|---|---|---|---|
| [ ′′ ′′] | [K km s-1] | [km s-1] | [km s-1] | ||
| C18O | 21.6 21.6 | 33.44 0.21 | 4.68 0.03 | 56.42 0.01 | |
| aaFit to self-absorption component | 1.22 0.11 | 2.10 0.20 | 55.73 0.11 | ||
| C17O | 21.2 21.2 | 9.53 0.03 | 5.04 0.18 | 56.42 0.02 | |
| H13CO+ | 7.9 6.9 | 14.73 1.00 | 4.20 0.36 | 55.96 0.14 | |
| HN13Cbb and from method hfs in CLASS, see Section 3. | 7.8 7.1 | 5.40 0.17 | 3.60 0.10 | 55.91 0.36 | |
| SiOccThis is the cloud component only. SiO is dominated by high velocity emission, which has a line integral of 16.6 K km s-1 and a line width of 13.6 km s-1. | 8.2 7.1 | 7.85 0.90 | 3.73 0.33 | 56.23 0.13 | |
| H13CNd,ed,efootnotemark: | 5.8 5.7 | 37.00 0.70 | 4.70 0.10 | 56.20 0.13 | |
| H13CNffFit with hyperfine components locked in velocity separation to the main hyperfine line. | 4.0 3.7 | 24.86 0.22 | 5.85 0.05 | 55.97 0.12 | |
| NH2DffFit with hyperfine components locked in velocity separation to the main hyperfine line. | 1 | 12.1 11.9 | 5.30 0.06 | 1.35 0.10 | 56.28 0.06 |
| DCN | 2.9 2.4 | 21.69 0.84 | 6.89 0.18 | 55.56 0.18 | |
| aaFit to self-absorption component | 2.88 0.70 | 2.65 0.01 | 54.85 0.21 |
3. Results and Analysis
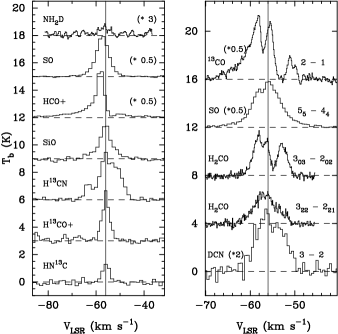
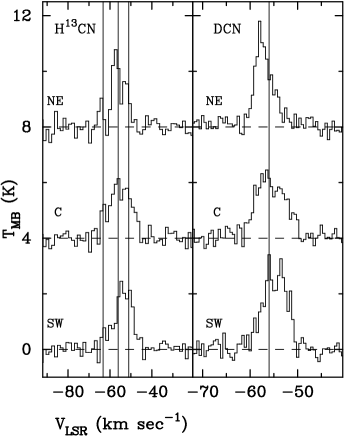
In Figure 1 we show spectra towards NGC 7538 S of all the molecular transitions, which have been observed with BIMA in the 3 mm and 1 mm band, except the CH3CN J = 11 10 lines, which we will cover in Section 3.4.3. Although some of the changes in the line profiles are due to different spatial resolution, this effect is rather minor, especially since most of the spectral lines have been observed with roughly the same angular resolution (Table 1 & 2). Most of the differences in line shape results from whether the lines are optically thick or thin, and whether they originate from the disk, the outflow, or the cloud envelope. Almost all the lines observed in the 1 mm band are optically thick, have strong line wings, and show deep self-absorption from the surrounding cloud envelope. The same is also true for HCO+ , SiO , and SO in the 3 mm band. In this paper we are focusing on the accretion disk. We therefore limit our analysis to high density tracers, which have dipole moments of 3 Debye or larger, and which can be assumed to be optically thin or at least have only moderate optical depths. Of the molecules we have observed, H13CN, HN13C, DCN, H13CO+, CH313CN, and CH3CN, all fall into this category. These molecules are expected to be good tracers of the gas in the dense disk surrounding NGC 7538 S. Most of them are isotopomers, which have molecular abundance ratios of 10-10 compared to H2. One would therefore expect them to be optically thin, but as we will see later, this is not the case for all of the lines. Several of them are also affected by emission from the molecular outflow. We have therefore carefully inspected each image to see whether the line emission originates from the disk, the outflow, or whether both the disk and the outflow contribute to the emission. The gas in the surrounding cloud core is also very dense, and colder than the gas in the disk. It can therefore absorb some of the emission from the disk. However, since the surrounding envelope is much more extended than the disk and relatively uniform, it is largely filtered out in these interferometer observations, but may nevertheless add some contribution to the line profiles observed towards the accretion disk.
In order to determine the systemic velocity of the disk, we extracted spectra from our BIMA images for all optically thin or moderately optically thin molecules (see Table 3) at the center of the accretion disk. These spectra were imported into the IRAM single dish spectral line reduction package CLASS, which is part of the GILDAS software suite222http://www.iram.fr/IRAMFR/GILDAS. CLASS has very good line fitting routines and can also handle molecules with hyperfine splitting. The “method hfs” allows fitting for optical depth of lines with hyperfine structure, and one can derive more accurate radial velocities by locking the velocity separation for satellite lines to the main emission component as long as all the spectral transitions are observed within a single band. We also fitted deep, single dish JCMT spectra of the CO isotopomers C18O, and C17O J = to determine the systemic velocity of the cloud.The results of these Gaussian fits are given in Table 3. C18O and DCN show a narrow self-absorption feature at the cloud velocity or at slightly red-shifted velocities, suggesting that both have an optical depth of at least one in the surrounding cloud core. H13CN shows evidence for self-absorption in the main hyperfine component at high angular resolutions, see Section 3.4.1. Even C17O J = shows a weak hint of self-absorption and a fit to the hyperfine splitting of the molecule (method hfs) gives an optical depth 0.25. The results from Table 3 suggest a systemic velocity of 56.0 0.2 km s-1 . This agrees very well with what we derive from the rotation curve of H13CN , while the DCN rotation curve would suggest a slightly more red-shifted systemic velocity, 55.7 km s-1.
3.1. The NGC 7538 S star forming cloud core
The NGC 7538 S star forming core is a cold, dense cloud core 80′′ south of NGC 7538 IRS 1 (Werner et al., 1979; Zheng et al., 2001; Sandell & Sievers, 2004). Here we have assumed a distance of 2.8 kpc for easy comparison with earlier work, although recent trigonometric parallax observations (Moscadelli et al., 2009), result in a slightly smaller distance, 2.65 0.12 kpc. The star forming core has a luminosity of 104 L⊙ and harbors at least one massive protostar, NGC 7538 S (Sandell, Wright & Forster, 2003). Zheng et al. (2001), who mapped the NGC 7538 molecular cloud in NH3 with the VLA at high angular resolution, found the strongest ammonia emission towards NGC 7538 S, in good agreement with the sub-mm continuum imaging by Sandell & Sievers (2004). In the vicinity of NGC 7538 S Zheng et al. found the NH3 emission to be optically thick with a temperature of 25 K.
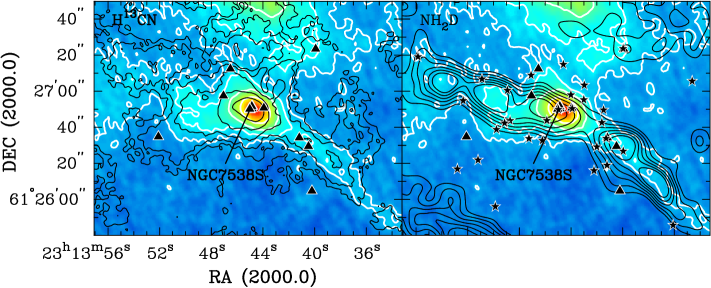
Our H13CN map with FCRAO and BIMA is in good agreement with the dust continuum and the NH3 results. Overall we find H13CN to show the same cloud morphology as the dust continuum. This is shown in Figure 2, where we overlaid the integrated H13CN emission from our combined FCRAO and BIMA map on the 450 m SCUBA continuum map from Sandell & Sievers (2004) for the region around NGC 7538 S. The dust continuum and the H13CN emission both peak on NGC 7538 S and the narrow south-western filament shows up clearly in both images. The dust emission appears somewhat more extended than H13CN to the east of NGC 7538 S, and there are also some differences to the north, i.e. the southernmost part of the NGC 7538 IRS 1 cloud core. Most of these differences are most likely due to difference in temperature of the emitting gas and dust. Since Zheng et al. (2001) found very strong, cold NH3 emission towards NGC 7538 S, we decided to look for NH2D emission as well, which we could observe with the same frequency setup as H13CN and HCO+ (Section 2.1, Table 1). The NH2D emission is quite faint, especially towards NGC 7538 S, but the narrow, lumpy, southwestern filament shows up very well in the integrated NH2D emission (Figure 2b). However, the NH2D emission is even stronger to the east of NGC 7538 S, where it shows a “continuation” of the southwestern filament, which is not evident in dust continuum, nor is it seen in H13CN or any other of the molecules that we have imaged towards NGC 7538 S. Examination of NH2D spectra along the filaments show broadened lines at the positions of the knots in the filaments and sudden, small velocity shifts between the knots, suggesting that these “clumps” maybe gravitationally unstable and that they may already have formed stars. The only exception is the NH2D clump at the tip of the eastern filament. This is where we find the strongest NH2D emission, but the lines are very narrow (v = 0.9 km s-1), suggesting that this condensation is a very cold, prestellar core.
We can use our high-quality spectral line and continuum data to estimate the size and total mass of the NGC 7538 S star forming core. Sandell & Sievers (2004) quoted a radius of 0.4 pc (30′′) and a total mass of 750 M⊙, assuming an average dust temperature of 30 K. If we use our combined FCRAO and BIMA H13CN map and radially average the data from the center of the proto-star, we find that the emission is relatively flat at small radii, has a steeper fall-off to a radius of 18 - 20′′ and gets even steeper at larger radii until it flattens off at 38′′ from the cloud center. The emission stays roughly constant at larger radii until it start to rise again when we pick up emission from the IRS 1 core. If we radially average the 450 m map (Figure 2), we find a core size of 34′′. The 850 m image, however, has better sensitivity than the 450 m-map, and here the radially averaged dust emission suggests a core radius of 40′′, which agrees well with H13CN after correcting for the difference in HPBW. The dust emission therefore has a similar distribution to H13CN, although it falls off less steeply at larger radii, see Figure 3. Both dust and gas therefore predict a core radius of 0.5 pc (38′′). If we assume an average gas temperature of 25 K, consistent with the temperature derived from NH3, and an abundance ratio for H13CN similar to the OMC-1 extended ridge (Blake et al., 1987), i.e. [HCN]/[H2] = 5 10-9, and an isotope ratio333The 12C/13C abundance is strongly fractionated in cold cloud cores and 40 throughout OMC-1, see e.g. Blake et al. (1987). It therefore appears more appropriate to use this isotope ratio for the NGC 7538 molecular cloud, rather than 85, which was used by Sandell, Goss & Wright (2005) in their study of the IRS 9 cloud core. The observed 12CO/13CO ratios at high velocities suggest that the isotope ratio could be slightly higher, 60. [12CO]/[13CO] = 40, we obtain a total mass of 2,000 M⊙.

As discussed above the core size is the same for the dust emission as found for H13CN, even though there are differences in the morphology on smaller scales. If we assume that the gas and dust is thermalized at 25 K , and take a -index of 1.5, the SCUBA maps give a total mass of 2,000 M⊙, which is in excellent agreement with H13CN. The JCMT C18O map, however, gives a mass of only 1,000 M⊙, if we assume that C18O is optically thin. We know that this assumption is not true near the core center, and the total mass will therefore be somewhat underestimated. However, the main reason for low mass derived from CO is that a large fraction of the CO is frozen onto dust grains, resulting in a depletion of the CO gas phase abundance. Mitchell et al. (1990) found 10% of the CO to be tied up into ice in the NGC 7538 IRS 9 cloud core. Since the NGC 7538 S cloud core is even colder than the IRS 9 cloud, the fraction of solid to gas phase CO is likely to be higher. The low core mass deduced from C18O is therefore a result of CO depletion and optical depth. We therefore conclude that the total mass of the NGC 7538 S cloud core is 2,000 M⊙, corresponding to an average gas density of 6 104 cm-3.
3.2. The position of the central protostar, NGC 7538 S
NGC 7538 S was detected in deep IRAC images with the Spitzer Space Observatory at 4.5, 5.8, and 8 m (Paper II). In paper II we also present VLA observations, which show that the star drives a highly collimated thermal jet, with the strongest emission knot coinciding with the IRAC position to within 01. In this paper we have therefore adopted the VLA position of NGC 7538 S as: = 23h 13m 4498, = 61∘ 26′ 497 444Recent sub-arcsecond continuum imaging at 110 and 224 GHz with CARMA (Paper II) resolve the elliptical core into three compact sources, all of which are almost certainly protostars. The strongest one of the three sources agrees within 015 with the adopted position for the high-mass protostar.. This position coincides within errors with the strongest OH maser spots (Argon et al., 2000), the position of the Class II CH3OH maser (Pestalozzi et al., 2006), as well as with the dominant cluster of H2O masers (Kameya et al., 1990). Furthermore, it places NGC 7538 S on the symmetry axis of the compact bipolar outflow imaged in HCO+ and at the dynamical center of the rotating disk (Section 3.4.1).
3.3. Outflow and Accretion
We will discuss the molecular outflows in the NGC 7538 molecular cloud in more detail in (Corder et al, in preparation). In this section we re-examine the outflow, since it is intimately connected to the thermal jet and both must be powered by the accretion disk. The outflow parameters derived by Sandell, Wright & Forster (2003) are incorrect, because they were derived from HCO+ observations with the assumption that the outflow is cold and that the HCO+ abundance is the same as in quiescent molecular cloud cores. However, Sandell, Goss & Wright (2005) analyzed the outflow from NGC 7538 IRS 9 and showed that the HCO+ abundance is enhanced by more than a factor of 30 compared to the “standard” OMC-1 ridge abundance. It is therefore clear that the HCO+ abundances are likely to be enhanced in the NGC 7538 S outflow as well.

3.3.1 Outflow morphology
For NGC 7538 S we have many data sets that probe the outflow. Here we will largely restrict the discussion to CO , CO , HCO+ and SiO . CO is a very good outflow tracer and chemically much more robust than HCO+, although at near cloud velocities the emission can be optically thick. Figure 4 shows long integration spectra of CO , , and 13CO , all obtained with JCMT. What we immediately see from these spectra is that the outflow is an extreme high-velocity outflow (Choi, Evans, & Jaffe, 1993), because we see high-velocity wings extending to velocities 55 km s-1 in both the blue- and the red-shifted side of the CO and spectra. The emission is strongly skewed to blue-shifted velocities, because of strong self-absorption. The self-absorption is even more extreme in HCO+ , where the red-shifted wing is almost completely absent (Figure 1) due to the strong accretion flow, see Section 3.3.3. The strong emission peak at 49 km s-1, which dominates the emission on the red-shifted side of the CO lines, is due to the extended “49 km s-1” molecular cloud component, which is seen over most of the NGC7538 molecular cloud. The strong red-shifted self-absorption and the “49 km s-1” cloud make it difficult to derive accurate parameters for the red-shifted lobe and we will therefore restrict most of our discussion to the blue-shifted lobe.
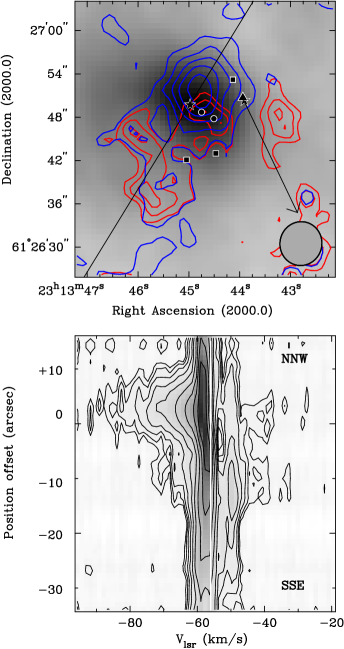
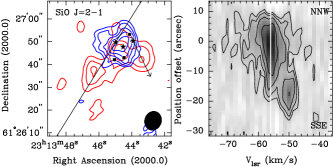
Figure 5 shows the outflow imaged in HCO+. The outflow is clearly bipolar and very compact, suggesting that we are seeing a very young outflow. The position angle (p. a.) of the outflow determined from the HCO+ high velocity emission is 148∘ 4∘, i.e. roughly perpendicular to the position angle we derive for the accretion disk from H13CN (Section 3.4.1). The position angle of the outflow agrees with the position angle of the thermal jet (Paper II, see also Figure 9), 145∘ 2∘, which is to be expected if the outflow is powered by the jet. The blue-shifted lobe is extremely compact and extends only 8′′ to the NNW. The counter flow to the SSW contains both blue-and red-shifted high velocity gas, suggesting that the red-shifted lobe is somehow closer to the plane of the sky. The red-shifted lobe is more extended and less collimated. It looks more like a half shell without a clear front, suggesting that it has cleared the dense core and is expanding into a lower density regime. The extent of the red HCO+ lobe is 16 - 17′′ and brighter on the western side. Examination of our CO map (Figure 6) shows a similar size in CO. The SiO outflow, however, appears more jet-like and extends to 22′′ from the central protostar (Figure 7).
HCO+ and SiO show a red-shifted lobe of another outflow west of NGC 7538 S. It is also seen in our CO map, especially at high red-shifted velocities. It does not stand out very clearly in our single dish corrected HCO+ image (Figure 5), which shows a strong broad red-shifted emission peak at 10′′ west of NGC 7538 S. Inspection of the HCO+ data sets and the SiO image, however, suggests that it has a p.a. of 205∘ and that it is brighter on the western side in HCO+. In Figure 5 this outflow is shown with an arrow outlining the origin, extent ( 17′′), and p.a. of the outflow. This red-shifted outflow has a rather high outflow velocity, 25 - 30 km s-1, in both HCO+ and SiO. It is almost certainly powered by the bright IRAC and H2O maser source, IRS 11 S (Corder, 2008, Paper II). There is no clear sign of a blue-shifted counter flow, although such a flow would overlap with the blue outflow lobe from NGC 7538 S.
3.3.2 Physical properties of the outflow
The high velocity emission is much stronger in CO than in (Figure 4), which indicates that the outflow is hot. Since the beam size is smaller for the CO than the transition, the higher intensities in CO than in are partly due to better coupling to the beam, but detailed analysis shows that the observed intensity ratios require the high velocity emission to have temperatures of 100 K or more. We do have maps of both CO J = and CO J = and we do know the size of the blue outflow lobe, enabling us to correct for beam filling. Nevertheless, it is difficult to derive an accurate temperature from only two CO transitions. We therefore prefer to use the ratio of the two formaldehyde transitions, H2CO, J = 3 and 3, which were observed simultaneously with both BIMA and JCMT. These observation are therefore insensitive to calibration and pointing errors, and even though the line wings are much fainter in H2CO than in CO we get a more accurate determination of the gas temperature in the outflow. The ratio Tb()/Tb() is very sensitive to temperature, especially if the gas is not too hot (Mangum & Wootten, 1993). If we integrate the blue-shifted wing from 59 km s-1 to 63 km s-1, we find a ratio of 2.65 at the position of the protostar and 2.9 in the blue outflow lobe. These line ratios correspond to kinetic temperatures of 120 K at the position of the protostar and 100 K in the outflow lobe (Mangum & Wootten, 1993). For the red-shifted outflow lobe integrated over the velocity range 53 km s-1 to 50.5 km s-1 the ratios are 2.5 and 3.2, i.e. 140 K - 80 K, at the position of the protostar and at the peak of the outflow lobe, respectively. The H2CO data therefore confirm what we already saw from CO, i.e. the temperature of the gas in the outflow 100 K. A population diagram analysis of methylcyanide, CH3CN , which also traces the high velocity gas (see Section 3.4.3), gives a rotational temperature of 147 40 K, in good agreement with what we derive from CO and H2CO. Our H2CO data suggest that the high velocity gas in the blue outflow is hotter near the surface of the disk and somewhat colder in the outflow lobe. The data also suggest that the blue-shifted gas could be somewhat hotter in the blue-shifted gas than the red-shifted gas, but this should be viewed with caution, since the red-shifted emission is affected by self-absorption from the infalling envelope.
Since the HCO+ is often enhanced in outflows, it is not a good mass tracer (Sandell, Goss & Wright, 2005). We therefore prefer to use 12CO, which is more chemically robust. We have maps of the whole NGC 7538 S region in 12CO , i.e. the map published by Davis et al. (1998), 13CO , and in 12CO . We also have long integration spectra towards NGC 7538 S in 12CO , 13CO , and 12CO (Figure 4). Even though the 12CO goes deeper and has better spatial resolution than the 12CO map, we will use the latter, because we have only a 13CO map in , which allows us to estimate the optical depth in the outflow. The long integration 13CO spectrum shows high velocity wings over the velocity range 70 km s-1 (possible even 80 km s-1) to 38 km s-1, confirming that most of 12CO emission is optically thick. The main disadvantage of using single dish 12CO data, is that the CO emission is very strong and extended over a large velocity range, from about 65 km s-1 to 48 km s-1, even though the blue outflow lobe can be seen in channel maps at lower velocities (Figure 6). In order to capture the low velocity gas we have therefore subtracted out the extended background emission from the compact outflow emission. The background emission was estimated in several areas and normalized to the same area we integrated over in the map. For analysis of the long integration spectra, we average spectra in the same background regions and integrated the background spectrum over the same velocity range. Since the 12CO map has relatively poor signal-to-noise, we found that we get more accurate mass estimates by using the long integration CO spectra rather than integrating over the map, since the outflow is very compact and we know the size very well from our BIMA imaging in HCO+. Furthermore, using long-integration CO spectra allows us to trace the outflow to much higher velocities, which is important for estimating the energy of the outflow. Because we had to create reference spectra in both 12CO and 13CO from positions outside the outflow, the biggest uncertainty in our mass estimate is due to the opacity correction at low velocities, which depends on how well we subtracted out the extended cloud emission. If we assume that the bulk of the gas has a temperature of 100 K, and a [CO/H2] = 10-4, our 12CO data give an outflow mass of 6.5 M⊙, over the velocity range 60 km s-1 to 111 km s-1. About 75% of this mass resides at low outflow velocities, 10 km s-1. The momentum of the blue outflow lobe, Pblue 50 , and since it is natural to assume that the momentum is conserved, we get P 100 for the whole outflow. These values are not corrected for the inclination of the outflow. We should note, however, that the blue outflow lobe most likely also includes the outflow from other sources in NGC 7538 S (see paper II), and perhaps even the IRS 11 S outflow, see Section 3.3.1.
Since we now have mass estimates of the outflow from CO, we can determine how much the HCO+ abundance is enhanced in the outflow using our combined BIMA and FCRAO outflow map. If we assume normal HCO+ abundances, i.e. [HCO+/H2] = 2.8 10-9, and optically thin HCO+ emission (Hogerheijde et al., 1998), we get an outflow mass of 31.6 M⊙, suggesting that HCO+ is enhanced by about a factor of five. This enhancement is more modest than in the IRS 9 outflow, where Sandell, Goss & Wright (2005) found HCO+ enhanced by a factor of 30. However, if we only compare the mass estimates at high velocities, we find that the HCO+ abundance is enhanced by a factor of 20 - 40, suggesting that enhancement of HCO+ is caused by shocks from the high velocity outflow.
In order to determine the mass loss rate and energetics of the outflow, we need to know the age of the outflow. The age is typically determined from the dynamical time scale, corrected for the inclination of the outflow (Cabrit & Bertout, 1990). It is difficult to accurately estimate the inclination of the outflow. However, since we have a wide-angled outflow and there is some overlap between the blue and the red-shifted outflow lobe, a comparison of the different model cases computed by Cabrit & Bertout (1990), suggests an inclination angle between 40∘ - 60∘. In the following we assume an inclination angle of 50∘. If we take the mass weighted outflow velocity for the blue outflow lobe, which is V = 7.3 km s-1, we get dynamical time scale, td = 12,200 yr. This is likely to be an under-estimate, since it does not account for the time it has taken the outflow to expand into the massive, dense cloud core surrounding the outflow. We will therefore also examine the red outflow lobe. Here we cannot derive a reliable mass estimate, because the red-shifted gas velocity gas is heavily self-absorbed, especially at low velocities. We therefore use the terminal velocity at the tip of the flow, 0.3 pc from the star (22′′), which is 17 km s-1 for HCO+ . In this case we get a dynamical time, td = 14,000 yr, about the same as we derived for the blue outflow lobe. It is probably an under-estimate, because the mass-weighted velocity is likely to be lower than the terminal velocity that we used. We can get a third estimate of the outflow rate from theoretical models of collapsing cloud cores, which suggest that outflows form at about 0.6 times the free-fall time, (Tomisaka, 1998). The average gas density in the elliptical core surrounding NGC 7538 S is 107 cm-3, resulting in = 2.5 104 yr, which would suggest that the outflow started about 15,000 yrs ago, in reasonable agreement with what we deduced from the dynamical time scales. If we assume an outflow age of 15,000 yr, we find a mass loss rate of 4.3 10-4 , if the red outflow lobe has a similar mass as the blue lobe. With these assumptions we derive a momentum flux, F = 1.0 10-2 , a mechanical luminosity of 14.2 L⊙, and a kinetic energy of 1.3 103 or 2.6 1046 ergs. The derived momentum flux would suggest that the exciting star or stars have a bolometric luminosity of 104 L⊙, if we use the correlation by Beuther et al. (2002a) derived for Class I and young high-mass objects, which is close to the observed luminosity. For Class 0 objects Bontemps et al. found an an outflow efficiency 10 higher than for Class I objects, but this is not true for NGC 7538 S, even though in any other respect it appears to be a Class 0 object. It is possible that this relationship does not hold for extremely young outflows, which are still density bounded.
3.3.3 Accretion flow
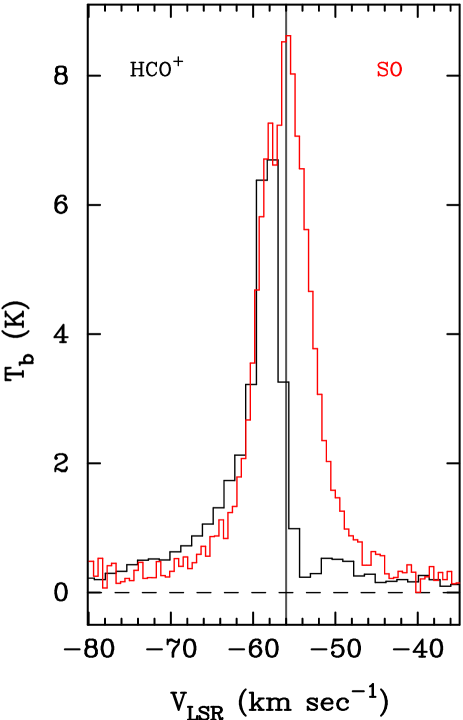
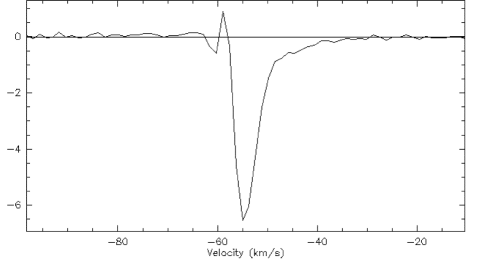
The red-shifted outflow wing is almost completely absent in HCO+ (Figure 1), suggesting that it is self-absorbed by the cold, infalling cloud envelope. We know that NGC 7538Ṡ is surrounded by a dense, cold ( 25 K) massive envelope ( 2,000 M⊙), where most molecules (including HCO+) are optically thick (Section 3.1). If the cloud core was in thermal equilibrium, one would therefore expect to see a symmetric line profile around the systemic velocity of the cloud core, but the absorption appears to affect only the red-shifted velocities. Our long integration CO spectra, Figure 4, see Section 3.3.1, show that the outflow velocities are the same in the blue- and the red-shifted wing. Therefore the absence of red-shifted HCO+ emission is not because the red-shifted emission is absent, but because it is self-absorbed by the outflow. This is confirmed by our observations of SiO , and SO J = , which both show symmetric high velocity wings over the velocity interval, where emission from HCO+ is very weak or absent. Since the SiO and SO transitions come from much higher energy levels, the absence of self-absorption in these lines suggest that they are not sufficiently excited in the cold surrounding cloud envelope to cause self-absorption against the hot outflow. The red-shifted self-absorption, which is so striking in HCO+ must therefore be caused by infall of the cloud core surrounding NGC 7538 S. To illustrate this more clearly, we have taken the SO J = line, which was observed with a similar beam size as HCO+ and scaled it, so that it roughly matches the HCO+ profile (Figure 8). From this figure we can see that infall starts to affect the red-shifted outflow from velocities 40 km s-1. We can directly create an infall profile by fitting two Gaussians (one for the cloud core and one for the outflow) to the blue-shifted side of the HCO+ profile and blanking out the part of the spectrum which is likely to be affected by self-absorption. If we subtract the fit from the observed spectrum, we get the absorption profile shown in Figure 8, which confirms that we can see the infall to at least 16 km s-1. At the systemic velocity, HCO+ is optically thick. The ratio of the the peak intensity of HCO+ to H13CO+ (Table 3, Figure 8) is 2, if we use the fitted peak for HCO+, 6.5 K, and ignore any differences in beam size. This corresponds to an optical depth of 20 (for a [12C/13C] abundance of 40). At the peak of the absorption profile we therefore have an optical depth of 10. Inspection of position velocity plots (Figure 5) and spectra around NGC 7538 S indicates that we see narrow self-absorption out to a radius of at least 15′′ while the self-absorption at high velocities is only seen in the immediate vicinity of NGC 7538 S, indicating that the accretion flow is accelerating. In order to estimate the mass of the infalling cloud envelope, we somewhat arbitrarily divide the absorption profile into two parts: an extended low velocity component (V 54 km s-1) with a FWHM of 6′′, and an unresolved component extending to velocities 40 km s-1. The low velocity infall component has an integrated intensity of 14 K km s-1 and an assumed average optical depth of 3, while the integrated intensity of the unresolved “high velocity” infall is 23.5 K km s-1. Since we see the gas in absorption, it must have an optical depth about one or more. If we sum up the gas seen in absorption, we get 125 K km s-1, which is half the infalling gas, since we have an equal amount from the backside of the cloud. If we adopt an [HCO+/H2] abundance of 2.8 10-9 and a kinetic temperature of 25 K, we get a mass of 21 M⊙, which is strictly speaking a lower limit. If we assume that the time scale for accretion is the same as for the outflow, i.e. 15,000 yr, we get a mass accretion rate 1.4 10-3 M⊙ yr-1.
A more common way to estimate the accretion rate is to assume that the outflow rate is proportional to the accretion rate, see e.g. Beuther et al. (2002a). If we assume that the ratio of the outflow rate and the accretion rate is approximately 0.3 (Tomisaka, 1998; Shu et al., 1999) we get an accretion rate of 1.4 10-3 M⊙ yr-1, the same as what we got from our direct estimate of the infalling cloud mass. The agreement is probably fortuitous, because both estimates have an uncertainty of at least a factor of two or three.
Another way to estimate the accretion rate is to assume that we have a steady state accretion flow with an infall velocity, vinf, onto a uniform disk with a radius, R, and a surface density, , see e.g. Beltrán et al. (2004). In this case the mass accretion rate, , can be expressed as: = 2Rvinf. Allen et al. (2003), who did numerical simulations of the collapse of a magnetized molecular cloud core assumed to undergo rigid rotation, show that in such a case the infall velocity is the same as the rotation velocity of the disk. Since we measure a rotational velocity of 1.3 km s-1 at a radius of 7000 AU (Section 4.1) and with a surface density, = 2.1 g cm-2, deduced from our H13CN observations of the disk (Section 3.4), we find an accretion rate, = 2.8 10-3 M⊙ yr-1, twice as large than our two other estimates, but well within the errors of each method.
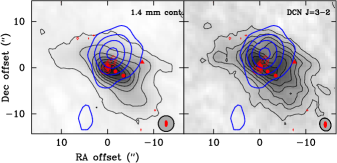
3.4. The compact core and the accretion disk
Both DCN and H13CN show an elliptical source approximately centered on NGC 7538 S superposed on more extended fainter emission. In the left panel of Figure 9 we show the integrated DCN emission, overlaid with the 3.6 cm continuum emission from Paper II, and the blue-shifted HCO+ emission, which show how the jet and the outflow relate to the disk-like structure seen in the integrated DCN image. In the right panel of Figure 9 we show the 1.4 mm continuum emission (Paper II), also overlaid with the blue-shifted HCO+ emission. The dust continuum and the DCN emission look very similar, although there appears to be more structure in the DCN emission than in the dust continuum emission, even though both have been imaged with very similar spatial resolution. The integrated DCN emission shows a ridge-like structure extending to the northwest 45 west of NGC 7538 S. This ridge or DCN “clump” is not seen in the dust continuum, but it does show up in H13CN, but only at high spatial resolution (Figure 10, right panel). As we can see from Figure 9 this DCN condensation borders the western side of the blue outflow, and could therefore be a dense gas clump compressed by the outflow (Section 3.4.2). A few arcseconds west of the DCN clump is another IRAC (mid-infrared) source, IRS 11 S, but the DCN clump is rather compact ( 3′′) and the positional offset is too large to suggest an association with this source. IRS 11 S is is clearly another young star, because it excites an H2O maser and powers a small outflow.
Gaussian fits to the dust continuum and to the integrated H13CN emission give a size for the compact core of 10′′ 4′′ at p.a. 58∘ 3∘, centered 2′′ southwest of the center of the accretion disk. If we assume a gas temperature of 35 K, and an [H13CN/H2] abundance of 1.25 10-10, i.e. the same abundance that we assumed for the NGC 7538 S cloud core, see Section 3.1, we obtain a total mass of 85 M⊙. This mass estimate is very similar to what we derive from our dust continuum observations, 125 M⊙ (Paper II). Even though we do not have a good estimate for the gas temperature in the compact core, our assumed temperature appears reasonable. The lowest measured gas temperature comes from ammonia, 25 K. This gives a lower limit to the gas temperature. The temperature of the disk is certainly 50 K (see Section 3.4.3). Since the gas mass scales roughly linearly with temperature, the largest error in our gas mass estimate is due to the uncertainty of the H13CN abundance.
Of all the molecules that we have observed in the 3 mm band, it appears that the best molecular tracer of the disk is H13CN . As far as we can tell, the H13CN emission is only weakly contaminated by the high-velocity outflow, and we have sensitive maps obtained with relatively high spatial spatial resolution ( 39). We also observe a clear velocity gradient along the major axis of the disk in HN13C and H13CO+ in the same direction as in H13CN, i.e. blue-shifted emission to the northeast and red-shifted emission to the southwest. A position-velocity cut of H13CO+ along the outflow direction shows blue-shifted emission to the northwest and red-shifted emission to the southeast, i.e. H13CO+ is clearly affected by the outflow, which makes it very difficult with this angular resolution to dis-entangle how much of the observed velocity gradient comes from the disk and how much of it is due to the outflow. For these lines we have only one B- and one C-array track giving us an angular resolution of 78 (Table 1). Since the data are rather noisy and have poorer spatial resolution than H13CN, we will not discuss them further in this paper.
At 1.4 mm we have high signal-to-noise maps in DCN and CH3CN , with even higher spatial resolution ( 26) than H13CN . However, although DCN appears to trace the accretion disk, the emission is rather strongly affected by emission from the outflow, making it difficult to accurately determine the rotation curve for the disk, although the values we derive are in reasonable agreement with what we find from H13CN (Section 3.4.1). Although Cesaroni et al. (1999, 2005) find CH3CN to be a good disk tracer for the young high-mass star IRAS , we find that CH3CN is dominated by emission from the outflow, which effectively masks any emission from the underlying accretion disk (Section 3.4.3).
Below we discuss in detail the findings for these three molecules.
| PositionaaPositions southwest and northeast are at 25 from the center at a p.a. of 58∘. | ||
|---|---|---|
| [km s-1] | [km s-1] | |
| HPBW = 6.0 5.7 | ||
| northeast | 56.59 0.06 | 3.9 0.1 |
| center | 55.98 0.07 | 4.7 0.1 |
| southwest | 55.19 0.16 | 4.6 0.4bbAt the southwest position the red-shifted emission from the disk is blended by emission from the surrounding cloud core, resulting in uncertain velocities and broadened line widths. |
| HPBW = 4.0 3.7 | ||
| northeast | 57.34 0.11 | 3.1 0.3 |
| center | 55.97 0.12 | 5.5 0.1 |
| southwest | 54.17 0.59 | 4.4 0.6bbAt the southwest position the red-shifted emission from the disk is blended by emission from the surrounding cloud core, resulting in uncertain velocities and broadened line widths. |
| HPBW = 3.5 3.3 | ||
| northeast | 57.76 0.21 | 2.3 1.0 |
| centerccThe line is too deeply self-absorbed to result in a successful fit. | ||
| southwest | 54.33 0.89 | 5.5 0.8bbAt the southwest position the red-shifted emission from the disk is blended by emission from the surrounding cloud core, resulting in uncertain velocities and broadened line widths. |
3.4.1 H13CN
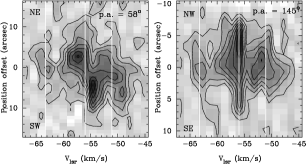
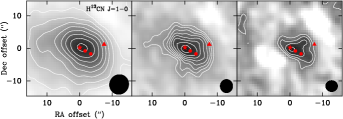
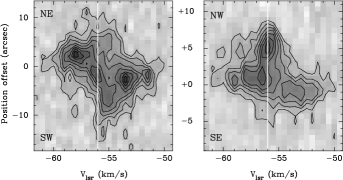
Emission from H13CN is widespread over the whole NGC 7538 molecular cloud, with the strongest emission in the whole cloud being centered on NGC 7538 S. Here we are interested only in emission from the disk, and we would prefer to completely filter out all the extended emission surrounding the accretion disk. We have therefore created several images, where we have excluded short spacings, and we have also experimented with weighting the uv-data in different ways. However, since most of our data come from relatively short spacings, this has a severe penalty in signal-to noise. Figure 10 shows the integrated H13CN emission with three different angular resolutions. We will base most of our analysis on the central image, which was created by excluding all uv-spacings shorter than 5 k and using robust weighting, giving an angular resolution of 40 37, p.a. = 0.2∘, and still resulting in a good signal-to-noise ratio. Figure 11 shows position velocity plots along the disk-plane (p.a. = 58∘) and in the outflow direction (p.a. = 145∘). The H13CN emission shows a very distinct velocity gradient over the disk, with blue-shifted emission to the northeast and red-shifted emission to the southwest. At the center of the accretion disk the main hyperfine component (F = ) appears to be self-absorbed. The self-absorption is hardly visible in spectra at lower angular resolution, i.e our naturally weighted map (Figure 1), while the line is almost completely absent at our highest angular resolution. The highest blue- and red-shifted emission peaks 25 from the center of the disk, suggest a diameter of 5′′ or 14,000 A.U. for the rotating disk. DCN gives similar results for the disk size (Section 3.4.2).
We made Gaussian fits of spectra extracted from all three images in order to more precisely quantify the velocity gradient. These Gaussian fits were made using method hfs in CLASS, which results in very reliable velocity information, since it uses the information from all three hyperfine lines. We also made Gaussian fits by locking the hyperfine lines to the main line, but since the lines are blended this require us to keep the line width constant in order to get reliable fits. The two methods give similar results to within 0.1 km s-1. In Table 4 we give the results obtained with method hfs. We can see from this table that higher spatial resolution results in larger velocity shifts at the edge of the disk and narrower line widths, as one would expect, because we get less velocity smearing within the beam. At the western side of the disk the emission from the surrounding cloud core is blended with the emission from the disk. This is seen better in DCN , which has negligible hyperfine splitting, see Figure 12.
As we can see from the position velocity plot along the outflow (Figure 11), even H13CN shows some emission from the outflow, because the emission northwest of the disk is blue-shifted, while there may be some red-shifted emission to the southeast.
3.4.2 DCN
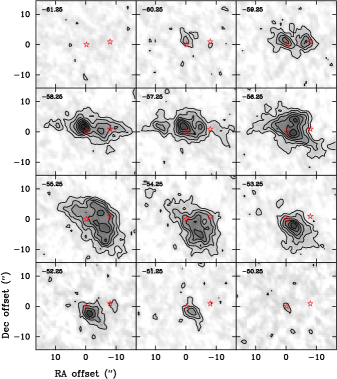
The emission from DCN is more compact than H13CN and also appears more lumpy than the H13CN emission, c.f. Figures 9 & 10. To some extent this is to be expected, since the spatial resolution is much higher in DCN than in H13CN (Tables 1 & 2). At the highest angular resolution, 35, that we could achieve from our H13CN observations (Figure 10, right panel), H13CN does appear to show a second condensation 45 west of NGC 7538 S, which is also seen in DCN. However, the difference in morphology between the DCN emission and H13CN emission is too large to be a result from angular resolution alone. To get a better idea where the DCN emission comes from, we created a set of images with 1 km s-1 spacing over the whole velocity range where we see DCN emission. These channel maps are shown in Figure 13. At the highest red- and blue-shifted velocities, the emission peaks on or near the center of NGC 7538 S, while at near cloud velocities the emission is stronger to the NE or the SW of the protostar, depending on whether we look at blue-shifted or red-shifted emission. At slightly blue-shifted velocities ( 58 km s-1) DCN shows an E-W ridge with three dominant peaks. The strongest one is slightly north northwest, 1 - 2′′, of NGC 7538 S, with another fainter core at +9′′,+2′′ relative to NGC 7538 S. To the west there is another peak at 5′′,+1′′ and an even fainter one at 10′′,+1′′. None of the DCN peaks, except the central one, coincide with any known object in the NGC 7538 S cloud core. The H2O maser and IRAC source, IRS 11 S, the other known young active object in the vicinity of NGC 7538 S, is roughly halfway between the two western cores. At the cloud velocity the strongest emission is 2′′ west of S, but here we see another very strong peak at 3′′,+4′′. The line at this position is centered at the cloud velocity (56 km s-1), and has a very narrow line width, 1 km s-1, with a faint blue-shifted shoulder. At red-shifted velocities most of the DCN emission comes from an extended ( 10′′) region southwest of NGC 7538 S. Although each velocity interval shows several red-shifted DCN clumps, the position of these clumps move when going from one velocity to the next, suggesting velocity gradients or turbulent gas. This is also seen in spectra from the southwestern part of the core, which are much broader with line widths of 4 - 5 km s-1.
If we integrate over 5.5 km s-1 centered on Vlsr = 56 km s-1, i.e. roughly the velocity spread that we see in H13CN, we see a central “disk-like” feature, similar to what we see in H13CN, but with a northwestern ridge curving up from the southwestern edge of the “disk” , i.e. very similar to the integrated DCN emission shown in Figure 9. However, the channel maps show that this is not really a ridge, but a blending of the DCN clump at 5′′,+1′′. The double-peaked “disk”, however, is centered about somewhat west ( 1′′) of the protostar. Even though this “disk” has roughly the same position angle as the continuum and H13CN disk, it is also shifted about one arcsecond to the north, making it questionable whether it is really a disk.
We have therefore made position velocity plots centered on the protostar along the disk plane and in the outflow direction (Fig 14), i.e. the same cuts as we did for H13CN. These position velocity plots clearly demonstrate that DCN is strongly affected by the outflow. The total velocity extent of the DCN emission is 11 km s-1, which is far more than we would expect to see from a rotating Keplerian disk. Furthermore, the cut along the outflow shows that the blue-shifted emission is to the north-west and the red-shifted emission is to the south-east of NGC 7538 S. The “high-velocity” DCN outflow is much more compact, only a few arcseconds , than the outflow we see in HCO+, which extends 8′′ to the northwest and even further in the red-shifted outflow lobe. However, at low blue-shifted velocities, DCN has a similar extent as HCO+. In the cut along the disk, there is a clear blue-shifted velocity gradient to the northeast, and red-shifted to the southwest. The red-shifted emission to the southwest of the disk center is partly suppressed by red-shifted self-absorption, see Figure 1 and Table 3, which quenches the emission on the red-side. There is apparently a velocity component at 55 km s-1 extending 10′′ to the southwest, which gives the appearance of a velocity gradient across the disk. However, the velocity feature we would associate with the disk, is the strongest red-shifted peak 26 to the southwest at a velocity of 53.5 km s-1. The corresponding blue-shifted peak is at 25 to the northeast at a velocity of 58.0 km s-1. There is, however another fainter even more red-shifted (Vlsr 51.5 km s-1) peak 2′′ to the southwest, which is probably from the outflow.
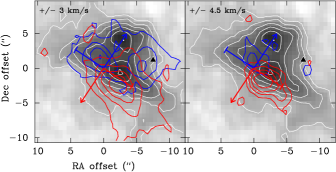
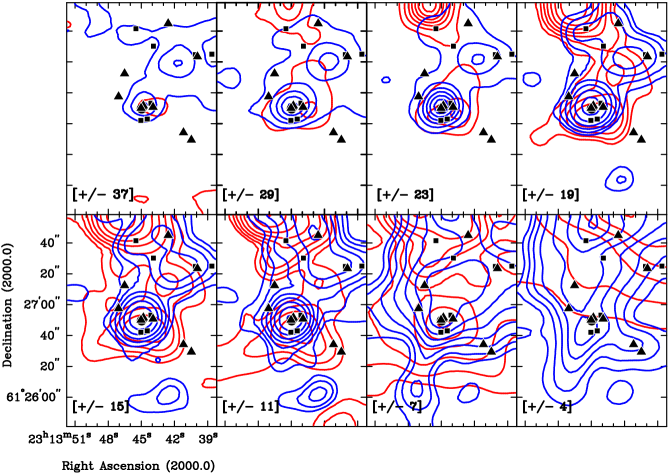
To get a better idea of where the blue- and red-shifted emission comes from, we overlaid the blue- and red-shifted DCN emission in two different velocity intervals on the integrated DCN emission of the cloud core (Figure 15). At a velocity offset of 3 km s-1 most of the blue-shifted emission is to the north northwest, i.e. what one would expect if the emission comes from the disk surface and/or the shearing layer between the outflow and the surrounding cloud. There is also a clear north-east southwest gradient, although with a somewhat different position angle, p.a. 40∘, than what we deduced from H13CN. At higher velocities, 4.5 km s-1 the blue- and red-shifted DCN emission moves more in the outflow direction, suggesting that most of the emission originates from the outflow. In both velocity intervals, however, we see very little red-shifted emission to the east. This could suggest that some of the red-shifted emission is neither associated with the disk nor the outflow from NGC 7538 S, but instead comes from more red-shifted gas clumps in the cloud core.
Since DCN is strongly affected by the outflow, it is not an ideal disk tracer. If the dominant velocity peaks seen in the position velocity plot along the disk plane at 25 originate from a rotating disk, the DCN emission would suggest a systemic velocity of 55.8 km s-1, a velocity shift of 4.5 km s-1 for a disk size of 51, i.e. very similar in size to what we get from H13CN, but with a larger velocity difference. We can also see this in Figure 12, where we show spectra of both H13CN and DCN in three positions of what we interpret as the rotating accretion disk surrounding NGC 7538 S. Both molecules are blue-shifted to the northeast, both show some evidence for slightly red-shifted narrow self-absorption towards the center of the disk and red-shifted emission to the southwest,. Here we have ignored the strong, relatively narrow emission at 56 km s-1, which is seen in DCN, but which is far less evident in H13CN. The velocity gradient is larger in DCN than in H13CN, which could result from the higher angular resolution in DCN compared to H13CN.
3.4.3 CH3CN J = 12 11
| K level | |||
|---|---|---|---|
| [km s-1] | [km s-1] | [K km s-1] | |
| HPBW = 2.76 2.36aaImage containing K-levels 0 to 3 have better uv-coverage than images containing K levels 4, 5, and 6, and the K = 2 and 3 transitions of CHCN. The latter data set has instrumental problems causing the data to be excessively noisy. | |||
| 0 | 56.4 0.1 bbCLASS fit by keeping velocity separations between K-levels to their theoretical values and forcing the line width to be the same for all transitions. | 5.35 0.17 | 16.6 0.9 |
| 1 | 11.6 0.8 | ||
| 2 | 9.4 0.8 | ||
| 3 | 12.0 0.9 | ||
| HPBW = 3.16 2.42aaImage containing K-levels 0 to 3 have better uv-coverage than images containing K levels 4, 5, and 6, and the K = 2 and 3 transitions of CHCN. The latter data set has instrumental problems causing the data to be excessively noisy. | |||
| 4 | 56.9 0.5 | 6.2 1.3 | 5.4 0.9 |
| 5 | 55.3 1.3 | 7.3 4.1 | 4.3 1.6 |
| 6 | 56.6 0.4 | 1.8 1.2 | 1.1 0.4 |
| CHCN | |||
| 2 | 56.3 1.6 | 7.5 3.5 | 2.7 1.1 |
| 3 | 55.8 0.6 | 2.8 1.2 | 1.2 0.5 |
In this section we discuss the structure, kinematics, opacity and temperature of CH3CN. We show that although there is CH3CN emission from the accretion disk, emission from the outflow dominates and hence prevents CH3CN from being a good disk tracer for NGC 7538 S.
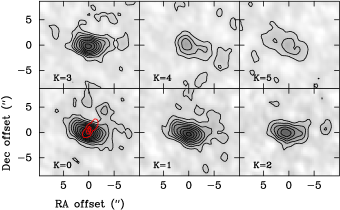
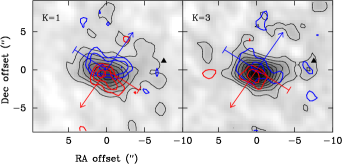
The emission from CH3CN J = 12 11 is confined to the immediate vicinity of NGC 7538 S (Figure 16). The emission is well resolved and shows an elliptical source centered at 02 003, 04 01, relative to our nominal position for NGC 7538 S, i.e. slightly south of the stellar position. At K = 0, which has an excitation energy of 68.9 K above ground, the size of the CH3CN emission is 49 15 with a p.a. of 70∘. The emitting region gets progressively smaller for higher K levels, suggesting that the gas is hotter closer to the star. At K = 3, which has an excitation energy of 132.9 K, the size of the emitting region 40 15 with a p.a. of 84∘. At higher K-levels the emission is faint and the source size more uncertain, but appears to follow the same trend seen for lower K-levels, i.e. the emission becomes more compact and we see a gradual increase in the position angle. It would therefore appear that CH3CN traces the accretion disk, although at low K-levels the position angle of the emission differs from what what we observe in dust continuum and H13CN. At higher K-levels the CH3CN emission becomes even more misaligned, which we would not expect to observe if the emission originates in the accretion disk, unless the inner disk is warped relative to the colder, more extended disk. As we will see below, the CH3CN emission is dominated by the outflow.
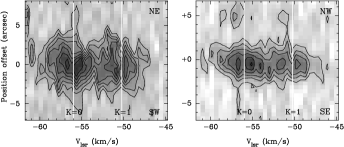
In Figure 18 we plot the integrated red- and blue-shifted emission of the K = 1 and 3 transitions and overlay them on the integrated emission from the line core of these lines, shows that the CH3CN emission is dominated by the outflow. This is even more striking for the K = 3 transition, where the blue- and red-shifted line emission is well separated and aligned with the outflow. The cut along the disk-plane (Figure 19), however, shows only a marginal velocity gradient over the disk, yet, as we already seen, both H13CN and DCN show a strong velocity gradient over the disk. Although this is somewhat surprising, it does not contradict our earlier results. CH3CN is strongly dominated by the outflow, which may mask the emission from the accretion disk.
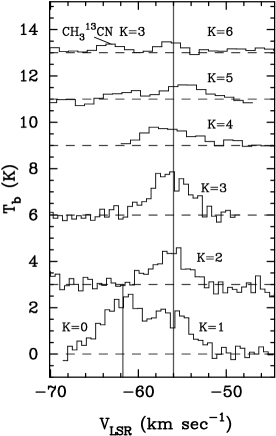
It is also possible that the CH3CN emission is optically thick, which will make it difficult to see rotation of the disk. CH3CN spectra towards the center of NGC 7538 S are shown in Figure 17. We detected all the K transitions, K = 0 to 6, and the K = 2 and 3 transitions of CH313CN, which were included in our frequency setting (Table 2). In Table 5 we give results from Gaussian fits to the spectra presented in Figure 17. We fitted the K = 0 to 3 levels simultaneously by keeping the separation between the K components to their theoretical value, but allowed the FWHM to be a free parameter and constrained to be the same for all these K values. The K-levels 4 to 6 were fitted individually. It is clear from these fits that the line widths gets broader for increasing K-value, which is what one would expect, since these lines probe the hot outflow. The line profiles are not well fitted with a single Gaussian, because they have a broader underlying pedestal from the outflow. If we fit the K = 3 transition with a two-component Gaussian, we find that the integrated intensity of the broader component, v = 9.3 km s-1, is almost twice the value of the narrow (disk-)component. There is also a hint of a narrow self-absorption feature in the K = 0 to K = 3 transitions (Figure 17), suggesting that there is cold, somewhat optically thick CH3CN gas in the surrounding cloud core. This self-absorption is also seen in the position velocity plots (Figure 19), confirming that it is real and not an artifact. Narrow self-absorption is also seen in the K = 3 transition, but slightly more red-shifted.
Since we detected emission from the K = 2 and 3 transitions of CH313CN, we can use the line ratios to check whether CH3CN is optically thin or thick. The ratios of the integrated CH3CN/CH313CN line intensities are about 3 - 10, which strongly suggests that the CH3CN lines are optically thick. Although CH3CN is often optically thin in hot, dense molecular cloud cores, see e.g. Araya et al. (2005), it is not uncommon to find optically thick CH3CN, especially in high-mass star forming regions (Pankonin et al., 2001; Watson et al., 2002; Remijan et al., 2004; Beltrán et al., 2005), when they are observed with high spatial resolution.

CH3CN is traditionally analyzed using a rotational temperature equilibrium (RTE) analysis (Loren & Mundy, 1984; Araya et al., 2005, and references therein). However, we know that some of the K-transitions are optically thick and that the source size changes as a function of K-level. Furthermore, we also know that we have some contribution from both the disk and the outflow, especially at low K-levels. An RTE or population-diagram analysis assumes that the gas is optically thin and in LTE at a single temperature, none of which is strictly true in this case. Nevertheless, it is instructive to look at the results of such an analysis. Since Araya et al. (2005) have done a recent in depth discussion of population-diagram analysis for CH3CN, there is no reason for us to repeat any of the discussion here. Following Araya et al. (2005) we do a least squares fit linear fit of the equation
where Z = . To minimize the effect from the change in source size, we use the measured antenna temperatures for the peak position of CH3CN ignoring any difference due to coupling of the source, except for a small correction for the K = 4 and K = 5 levels , which were imaged with a slightly different beam size (Table 5). Here we took the square of the ratio of the beam size, resulting in a correction factor of 0.83. The results of this analysis is shown in Figure 20. The population-diagram indicates that the CH3CN emission cannot be characterized with a single rotational temperature. We have therefore separately done a least squares fit to the three lowest K-transitions, K = 0 to 2, for which the emission is likely to include a non-negligible contribution from the accretion disk, and for K = 2 to 5, for which we seen that the outflow is dominates. The fit to the low K-transitions give Trot = 52 10 K, while the high K-transitions give Trot = 147 40 K. Neither of these temperatures are very accurate. The low K-transitions are definitely optically thick, which will lead to an overestimate of the rotational temperature. Contribution from the outflow will also raise the temperature. The temperature of the disk is certainly less than 50 K and higher than 25 K, the temperature of the surrounding cloud core, since we see some self-absorption from virtually every molecule tracing the disk. The temperature of the outflow is not well constrained by our observations, because we have poor signal-to-noise at high K-levels, which could more accurately constrain the temperature of the outflow. However, analysis of the two H2CO transitions 3 and 3, which are dominated by the outflow, also indicate a temperature of 100 K, in good agreement with what we derive from CH3CN. Kalenskii et al. (2000), who did single dish observations of NGC 7538 S in the and transitions of CH3CN with a beam size of 40′′, derived a rotation temperature of 40 K, much lower than what we observe. They also measure a different radial velocity, -55.4 km s-1, while we find a radial velocity of -56.3 km s-1 (Table 5). Since their beam covers most of the cold cloud core surrounding NGC 7538 S, it appears that the CH3CN emission they observe is dominated by the cloud core, which we filter out in our BIMA observations.
4. Discussion
4.1. Is NGC 7538 S surrounded by a rotating accretion disk?
NGC 7538 S powers a highly collimated thermal jet and drives a very young, hot molecular outflow, suggesting that it must be surrounded by a rotating accretion disk. We have shown that the star is embedded in a compact elliptical cloud core, which is approximately perpendicular to the thermal jet and the associated molecular outflow. High angular resolution observations tracers like H13CN , HN13C , H13CO+ , and DCN , which all are largely optically thin, show blue-shifted line emission to the northeast of NGC 7538 S and red-shifted to the southwest, with the highest velocities towards the center of the protostar. Such a velocity signature is characteristic for a rotating Keplerian disk. However, some of the velocity broadening seen towards the center of the protostar might be caused by the outflow powered by the disk, instead of originating in the faster rotating inner part of the disk. We therefore have to review our observational results with caution. We know that the outflow is much hotter than the bulk of the gas in the disk. It therefore tends to dominate the emission even for molecules, which are normally believed to be good disk tracers like CH3CN (Cesaroni et al., 1997, 2005; Beltrán et al., 2004, 2005; Patel et al., 2005; Furuya et al., 2008). In Section 3.4.3 we show that for NGC 7538 S the CH3CN emission originates from the dense outflow gas near the surface of the disk, where the outflow is launched. The emission from CH3CN therefore appears roughly orthogonal to the outflow.
Based on our discovery of a Keplerian like rotation in NGC 7538 S using H13CN (Sandell, Wright & Forster, 2003), we thought that DCN might work equally well and would provide us higher spatial resolution, if we observed the transition at 1.4 mm. However, as we saw in Section 3.4.2, the DCN transition is clearly affected by the outflow. Even though it also traces the dense gas in the disk, the relatively strong emission from the outflow makes it difficult to reliably separate the outflow emission from that of the disk. For estimating a Keplerian mass, we therefore only use the results from H13CN , because H13CN appears least affected by the outflow, and therefore provides the best information about the kinematics of the neutral gas surrounding NGC 7538 S. However, because NGC 7538 S is surrounded by a very dense cold cloud core, all our high density tracers, including H13CN, are affected by self-absorption. Most of this self-absorption is likely to originate in cold dense gas in the surrounding cloud envelope, but some of it could also originate in the colder outer portions of the disk, because the self-absorption becomes much more prominent at the center of the disk at the highest spatial resolutions. Since the self-absorption is slightly red-shifted (Figure 11, right panel), and almost certainly dominated by the accretion flow towards the central protostar, it makes the line emission appear more blue-shifted. Southwest of NGC 7538 S there is also an extended cloud component roughly at the systemic velocity of the cloud, see Section 3.4.2 and Figure 13. This emission blends in with the red-shifted emission from the rotating disk, which together with an unknown amount of red-shifted self-absorption results in uncertain velocities in the red-shifted side of the disk.
Despite these difficulties, our new observations clearly confirm a velocity gradient in the dense gas disk surrounding NGC 7538 S. Position velocity plots of H13CN and DCN show a roughly Keplerian like rotation curve centered on the protostar with a diameter of 5′′ (14,000 AU). If we assume that the disk is rotationally supported and take the velocities derived from H13CN, we derive an enclosed mass of 14 M⊙, uncorrected for inclination. The inclination angle of the disk is 50∘. Therefore the enclosed mass of the disk and the central protostar is 24 M⊙. We do not have a mass estimate for the central protostar, but based on the bolometric luminosity, 104 L⊙, it is probably has a mass of 10 M⊙, or about the same order as the mass of the disk. Such massive disks can be self-regulated at a condition of marginal Jeans stability and still appear to have an approximately Keplerian rotation curve (Bertin & Lodato, 1999).
Cesaroni et al. (2007) argue that disks like the one Sandell, Wright & Forster (2003) discovered around NGC 7538 S should be called toroids rather than disks. They further argue that such toroids may simply be transient structures, which may or may not evolve into a “classical” Keplerian disk. In this follow-up study we show that the Keplerian disk surrounding NGC 7538 S, is much smaller than previously thought and it is therefore not a transient structure. In high-mass protostars, the extreme accretion rates of 10-4 M⊙ yr-1, and the high pressure from the surrounding cloud, may enable such a “disk” to survive long enough to form an O-star. In this respect, NGC 7538 S, could well be a younger analogue of NGC 7538 IRS 1, which by all accounts still appears to be surrounded by an accretion disk (Sandell et al., 2009). In the case of IRS 1, which has a luminosity of an O7 star, but which is still heavily accreting, the disk has probably evolved into a more “classical” thin disk, which is rather hard to image, because the free-free emission from the central O-star is much brighter than the disk at mm-wavelengths, which is the only wavelength regime, where we have arrays with sufficient spatial resolution to potentially resolve and image such a disk.
4.2. Is NGC 7538 S a high-mass star?
Our observations confirm that NGC 7538 S lies in the center of a cold, massive cloud core with a diameter 1 pc, and a mass 2,000 M⊙(Section 3.1), which therefore provides the necessary conditions for the formation of high-mass stars, i.e. essentially the whole core has a surface density, 1 g cm-2 (McKee & Tan, 2002; Krumholz &McKee, 2008). NGC 7538 S coincides within errors with a cold far-infrared source with a luminosity 1.5 104 L⊙ (Werner et al., 1979; Thronson & Harper, 1979), suggesting an early B-star, if it is a single star. IRS 11, the only near-IR source in the vicinity of NGC 7538 S, can only account for about a tenth of this luminosity, and the same is true for the small cluster of Spitzer 8 m sources surrounding IRS 11 (Paper II). Therefore the bulk of the luminosity appears to be generated in the very massive elliptical cloud core ( 100 M⊙) cloud core, in which NGC 7538 S is embedded. Here NGC 7538 S completely dominates the luminosity. It drives a highly collimated thermal jet (Paper II), powers a massive, very young bipolar outflow (Sandell, Wright & Forster, 2003), and excites OH, CH3OH (Class II), and H2O masers (Argon et al., 2000; Pestalozzi et al., 2006; Kameya et al., 1990). OH 1665-MHz masers are only found in young massive star forming regions (Caswell, 1998; Argon et al., 2000), mostly associated with Ultra Compact H II regions. The same is true for Class II CH3OH masers (Minier et al., 2003), i.e. no CH3OH maser have yet been found toward a low or intermediate mass star. Although CH3OH masers sometimes are associated with OH masers, the majority of them are found in weak or radio quiet regions. They are therefore believed to trace a younger, perhaps protostellar phase, in the evolution of high-mass stars (Caswell, 1998; Ellingsen, 2006). The observed accretion rate for the disk surrounding NGC 7538 S is 1 10-3 M⊙ yr-1. Such accretion rates have not been seen in low or intermediate mass protostars, but accretion rates in the range 10-3 - 10-4 M⊙ yr-1 are commonly inferred for young high-mass stars of comparable luminosity (Molinari et al., 1998; Cesaroni et al., 1999; Beuther et al., 2002b; Beuther, Schilke & Stanke, 2003; Fontani et al., 2004). Accretion rates as high as a few times 10-2 M⊙ yr-1 have been reported (Beltrán et al., 2004, 2005), although such high accretion rates are generally only seen towards high luminosity UC H II regions (Hofner, Petersen & Cesaroni, 2003; Zapata et al., 2008). Theoretical models of collapsing clouds show that the accretion rates increase rapidly in the beginning of the collapse phase and decrease monotonically later on (Li, 1998; Yorke & Sonnhalter, 2002), which may be why the observed accretion rate is on the high side for a region which has a total luminosity of 1.5 104 L⊙. Since NGC 7538 S has the luminosity of a high-mass star and excites OH and CH3OH Class II maser emission, which has only been seen in high-mass stars, it must be a high-mass star.
5. Summary and Conclusions
We have carried out extensive observations of the star forming core NGC 7538 S with BIMA in mostly optically thin tracers with spatial resolutions ranging from 3′′ to 8′′. Additionally we have acquired complementary observations with FCRAO and JCMT to fill in lacking short spacing in our BIMA observations, which are needed to improve the image fidelity and reliability of our images of molecules like HCO+, H2CO, and H13CN, which are spatially very extended.
We confirm that there is a very young high-mass (proto)star in the compact elliptical core, which has a size of 8′′ 3′′ and a mass of 85 - 115 M⊙. Recent sub-arcsecond continuum imaging at 110 and 224 GHz with CARMA (Paper II) resolve the elliptical core into three compact sources, all of which are almost certainly protostars. The strongest one of the three sources agrees within 015 with the adopted position for the high-mass protostar, which is 2′′ to the northeast from the center of the compact elliptical core. The protostar is seen as a faint, extremely obscured mid-IR source, which coincides with a VLA thermal jet, and an OH and a CH3OH class II methanol maser. The star is surrounded by a massive, rotating accretion disk, which drives a highly collimated thermal jet and powers a very compact, hot molecular outflow. We see clear evidence for accretion towards the protostar. Almost all molecular transitions that we have observed, show red-shifted self-absorption, which can be explained only by infall motions of the gas in front of the protostar. The accretion signature is very strong in the optically thick HCO+ transition, which shows infall velocities up to 15 km s-1. We have used this accretion profile to derive a direct estimate of the accretion rate towards the disk, and find an accretion rate 10-3 M⊙ yr-1. We also estimated the accretion rate by assuming that the accretion rate is about three times the outflow rate, and by assuming a steady state infall to the disk, with an infall velocity equal to the observed rotation velocity of the disk at the radius R. All three methods give very similar results. Such high accretion rates are sufficient to quench the formation of an H II region and allow the central protostar to continue to grow in mass (Walmsley, 1995; Keto, 2003, 2007).
The rotating accretion disk is best seen in H13CN . H13CN is only marginally affected by emission from the intense hot outflow, while the emission from the outflow may dominate or severely hinder us from seeing the disk in many of the molecular transitions that we have observed. We found that DCN , which we expected to be an equally good disk traces as H13CN, is strongly affected by the outflow. Due to the high angular resolution, 26 (Table 2), we can separate most of the outflow emission from the disk-emission and therefore confirm that NGC 7538 S is surrounded by a rotating accretion disk. The emission from methylcyanide, CH3CN, however, is largely optically thick and the higher K-levels are completely dominated by the hot outflow emission near the surface of the disk.
BIMA observations of H13CN supplemented with FCRAO data show that the cloud core, in which NGC 7538 S is embedded, has a radius of 0.5 pc, and a mass 2000 M⊙. The size and mass of the core agrees very well with what we derive from analysis of the SCUBA 850 and 450 m data presented by Sandell & Sievers (2004), while the mass estimate from a single dish C18O map is much lower, suggesting that CO is depleted (frozen onto grains) in the cold cloud envelope. The cloud core is dense and massive enough to provide the necessary conditions for high-mass star formation.
References
- Allen et al. (2003) Allen, A., Li, Z.-Y., & Shu, F. H. 2003, ApJ, 599, 363
- Araya et al. (2005) Araya, E., Hofner, P., Kurtz, S., Bronfman, L., & DeDeo, S. 2005, ApJS, 157, 279
- Argon et al. (2000) Argon, A. L., Reid, M. J., & Menten, K. M. 2000, ApJS, 129, 159
- Beltrán et al. (2004) Beltrán, M. T., Cesaroni, R., Neri, R., Codella, C., Furuya, R. S., Testi, L., & Olmi, L. 2004, ApJ, 601, L187
- Beltrán et al. (2005) Beltrán, M. T., Cesaroni, R., Neri, R., Codella, C., Furuya, R. S., Testi, L., & Olmi, L. 2005, A&A, 435, 901
- Beuther et al. (2002a) Beuther, H., Schilke, P., Menten, K. M., Motte, F., M., Shridharan, T. K., & Wyrowski, F. 2002a, ApJ, 566, 945
- Beuther et al. (2002b) Beuther, H., Schilke, P., Sridharan, T. K., Menten, K. M., Walmsley, C. M., & Wyrowski, F. 2002b, A&A, 383, 892
- Beuther, Schilke & Stanke (2003) Beuther, H., Schilke, P., & Stanke, T. 2003, A&A, 408, 601
- Bertin & Lodato (1999) Bertin, G., & Lodato, G. 1999, A&A, 350, 694
- Blake et al. (1987) Blake, G. A., Sutton, E. C., Masson, C. R., & Phillips, T. G. 1987, ApJ, 315, 621
- Bonnell & Bate (2006) Bonnell. I. A., & Bate, M. R. 2006, MNRAS, 370, 488
- Bontemps et al. (1996) Bontemps, S., André, P., Terebey, S., & Cabrit, S. 1996, A&A, 311, 858
- Brown & Chandler (1999) Brown, D. W., & Chandler, C. J. 1999, MNRAS, 303, 855
- Cabrit & Bertout (1990) Cabrit, S., & Bertout, C. 1990, ApJ, 348, 530
- Caswell (1998) Caswell, J. L. 1998, MNRAS, 297, 215
- Cesaroni et al. (1999) Cesaroni, R., Felli, M., Jenness, T., Neri, R., Olmi, L., Robberto, M. Testi, L., & Walmsley, C. M. 1999, A&A, 345, 949
- Cesaroni et al. (1997) Cesaroni, R., Felli, M., Testi, L., Walmsley, C. M., & Olmi, L. 1997, A&A, 325, 725
- Cesaroni et al. (2005) Cesaroni, R., Neri, R., Olmi, L., Testi, L., Walmsley, C. M., & Hofner, P. 2005, A&A, 434, 1039
- Cesaroni et al. (2007) Cesaroni, R., Galli, D., Lodato, D., Walmsley, C. M., & Zhang, Q. 2007, in Protostars and Planets V, Eds. B. Reipurth, D. Jewitt, and K. Keil, (University of Arizona Press:Tucson), p. 197
- Chandler et al. (2005) Chandler, C. J., Brogan, C. L., Shirley, Y. L., & Loinard, L. 2005, ApJ, 632, 371
- Choi, Evans, & Jaffe (1993) Choi, M., Evans II, N.J., & Jaffe, D.T. ,1993, ApJ, 417 ,624
- Clarke & Bonnell (2008) Clarke, C. J., & Bonnell, I. A. 2008, MNRAS, 388, 1171
- Corder (2008) Corder, S. 2008, Ph.D. thesis, California University of Technology
- Davis et al. (1998) Davis, C.J., Moriarty-Schieven, G., Eislöffel, J., Hoare, M. G., & Ray, T.P. 1998, AJ, 115, 1118
- Ellingsen (2006) Ellingsen, S. P. 2006, ApJ, 638, 241
- Fontani et al. (2004) Fontani, F., Cesaroni, R., Testi, L., Molinari, R., Zhang, Q., & Walmsley, C. M. 2004, A&A, 424, 179
- Furuya et al. (2008) Furuya, R. S., Cesaroni, R., Takahashi, S., Codella, C., Momose, M., & Beltrán, M. T. 2008, ApJ, 673, 363
- Hildebrand (1983) Hildebrand, R. H. 1983, QJRAS, 24,267
- Hogerheijde et al. (1998) Hogerheijde, M. R., van Dishoeck, E. F., Blake, G. A., & van Langevelde, H. J. 1998, ApJ, 502, 315
- Hofner, Petersen & Cesaroni (2003) Hofner, P., Petersen, S., & Cesaroni, R. 2003, ApJ, 514, 899
- Jørgensen (2004) Jørgensen, J. K. 2004, A&A, 424, 589
- Kalenskii et al. (2000) Kalenskii, S. V., Promislov, V. G., Alakoz, A. V., Winnberg, A., & Johansson, L. E. B. 2000, A&A, 354, 1036
- Kameya et al. (1990) Kameya, O., Morita, K. -I., Kawabe, R., & Ishiguro, M. 1990, ApJ, 355, 562
- Keto (2003) Keto, E. 2003, ApJ, 599, 1196
- Keto (2007) Keto, E. 2007, ApJ, 666, 976
- Krumholz &McKee (2008) Krumholz, M. R., McKee, C. F. 2008, Nature, 451, 1082
- Lada & Harvey (1981) Lada, C. J., & Harvey, P. M. 1981, ApJ, 245, 58
- Li (1998) Li, Z.-Y. 1998, ApJ, 493, 230
- Loren & Mundy (1984) Loren, R. B., & Mundy, L. G. 1984, ApJ, 286, 232
- Maeder & Behrend (2002) Maeder, A., & Behrend, R. 2002, Ap&SS, 281, 75
- Mangum & Wootten (1993) Mangum, J., & Wootten, A. 1993, ApJS, 89, 123
- Mannings & Sargent (1997) Mannings, V., & Sargent, A. I. 1997, ApJ, 490, 792
- Manoj et al. (2007) Manoj, P., Ho, P. T. P., Ohashi, N., Zhang, Q., Hasegawa, T., Chen, H.-R., Bhatt, H. C., & Ashok, N. M. 2007, ApJ, 667, L187
- McKee & Tan (2002) McKee, C. F., & Tan, J. C. 2002, Nature, 416, 59
- Minier, Booth & Conway (1998) Minier, V., Booth, R. S., & Conway, J. E. 1998, A&A, 336, L5
- Minier et al. (2003) Minier, V., Ellingsen, S. P., Norris, R. P., & Booth, R. S. 2003, A&A, 403, 1095
- Mitchell et al. (1990) Mitchell, G. F., Maillard, J.-P., Allen, M., Beer, R., & Belcourt, K. 1990, ApJ, 363, 554
- Molinari et al. (1998) Molinari, S.,Testi, L., Brand, J., Cesaroni, R., & Palla, F. 1998, ApJ, 505, L39
- Moscadelli et al. (2009) Moscadelli, L., Reid, M. J., Menten, K. M., Brunthaler, A., Zheng, X. W., & Xu, Y. 2009, ApJ, 693, 406
- Najita et al. (2003) Najita, J., Carr, J. S. , & Mathieu, R. D. 2003, ApJ, 589, 931
- Norberg & Maeder (2000) Norberg, P., & Maeder, A. 2000, A&A, 359, 1025
- Pankonin et al. (2001) Pankonin, V., Churchwell, E., Watson, C., & Bieging, J. H. 2001, ApJ, 558, 194
- Patel et al. (2005) Patel, N. A., Curiel, S., Sridharan, T. K., Zhang, Q., Hunter, T. R., Ho, P. T. P., Torelles, J. M., Moran, J. M., Gómez, J. F., & Anglada, G. 2005, Nature, 437, 109
- Pestalozzi et al. (2006) Pestalozzi, M. R., Minier, V., Motte, F., & Conway, J. E. 2006, A&A, 448, L57
- Remijan et al. (2004) Remijan, A., Sutton, E. C., Snyder, L. E., Friedel, D. N., Liu, S,-Y., & Pei, C. -C. 2004, ApJ, 606, 917
- Sandell, Goss & Wright (2005) Sandell, G., Goss, W. M., & Wright, M. 2005, ApJ, 621, 839
- Sandell et al. (2009) Sandell, G., Goss, W. M., Wright, M., & Corder, S. 2009, ApJ, 699, L31
- Sandell & Sievers (2004) Sandell, G., & Sievers, A. 2004, ApJ, 600, 269
- Sandell, Wright & Forster (2003) Sandell, G., Wright, M., & Forster, J. R. 2003, ApJ, 590, L45
- Sault, Teuben & Wright (1995) Sault, R. J., Teuben, P. J., and Wright, M. C. H. 1995, in ASP Conf. Ser. 77: Astronomical Data Analysis Software and Systems IV, Eds. R.A. Shaw, H.E. Payne, and J.J.E. Hayes (Astronomical Society of the Pacific: San Francisco), p. 433
- Schreyer et al. (2006) Schreyer, K., Henning, Th., van der Tak, F. F. S., Boonman, A. M . S., & van Dishoeck, E. F. 2006, ApJ, 637, L129
- Shepherd & Churchwell (1996) Shepherd, D. S., & Churchwell, E. 1996, ApJ, 472, 225
- Shepherd et al. (2000) Shepherd, D. S., Yu, K. C., Bally, J., & Testi, L. 2000, ApJ, 535, 833
- Shu et al. (1999) Shu, F. H., Allen, A., Shang, H., Ostriker, E., & Li, Z.-Y. 1999, in The Origins of Planetary Systems, Eds. C. J. Lada, and N. D. Kyfalis (Kluwer Academic Publishers: Dordrecht), p. 193
- Simon, Dutrey & Guilloteau (2000) Simon, M., Dutrey, A., & Guilloteau, S. 2000, ApJ. 545, 1034
- Snell et al. (1984) Snell, R. L., Scoville, N. Z., Sanders, D. B., & Erickson, N. R.1984, ApJ, 284, 176
- Stahler et al. (2000) Stahler, S., Palla, F., & Ho, P. T. P. 2000, in Protostars and Planets IV, Eds. V. Mannings, A. P. Boss, & S. S. Russell (University of Arizon Press: Tucson), p. 327
- Thronson & Harper (1979) Thronson, H. A., Jr, & Harper, D. A. 1979, ApJ, 230, 133
- Tomisaka (1998) Tomisaka, K., ApJ, 502, L163
- Tuthill et al. (2002) Tuthill, P. G., Monnier, J. D., Danchi, W. C., Hale, D. D. S., & Townes, C. H. 2002, ApJ, 577, 826
- Walmsley (1995) Walmsley, M. 1995, Rev. Mex. AA Ser. Conf., 1, 137
- Watson et al. (2002) Watson, C., Churchwell, E., Pankonin, V., & Bieging, J. H. 2002, ApJ, 577, 260
- Werner et al. (1979) Werner, M. W., Becklin, E. E., Gatley, I., Matthews, K., Neugebauer, G., & Wynn-Williams, C.G. 1979, MNRAS, 188, 463
- Weintroub et al. (2008) Weintroub, J., Moran, J. M., Wilner, D. J., Young, K. H., Rao, R., & Shinnaga, H. 2008, ApJ, 677, 1140
- Wilking et al. (1990) Wilking, B. A., Blackwell, J. H., & Mundy, L. G. 1990, AJ, 100, 758
- Wolfire & Cassinelli (1987) Wolfire, M. G., & Cassinelli, J. P. 1987, ApJ, 319, 850
- Yorke & Sonnhalter (2002) Yorke, H. W., & Sonnhalter, C. 2002, ApJ, 569, 846
- Zapata et al. (2008) Zapata, L. A., Palau, A., Ho, P. T. P., Schilke, P., Garrod, R. T., Rodríguez, L. F., & Menten, K. 2008, A&A, 479, L25
- Zhang et al. (2005) Zhang, Q., Hunter, T. R., Brand, J., Sridharan, T. K., Cesaroni, R., Molinari, S., Wang, J., & Kramer, M. 2005, ApJ, 625, 864
- Zhang et al. (2001) Zhang, Q., Hunter, T. R., Brand, J., Sridharan, T. K., Molinari, S., Kramer, M. A., & Cesaroni, R. 2001, ApJ, 552, L167
- Zhang et al. (1998) Zhang, Q., Hunter, T. R., & Sridharan, T. K. 1998, ApJ, 505, L151
- Zheng et al. (2001) Zheng, X. -W., Zhang, Q., Ho, P. T. P., & Pratap, P. 2001, ApJ, 550, 301