11email: rs@astro.keele.ac.uk 22institutetext: Institute of Astronomy, University of Cambridge, Madingley Road, Cambridge, CB3 0AH
Warm dusty discs: Exploring the A star 24m debris population
Abstract
Aims. Studies of the debris disc phenomenon have shown that most systems are analogous to the Edgeworth-Kuiper Belt (EKB). In this study we aim to determine how many of the IRAS 25m excesses towards A stars, which may be indicative of asteroid belt analogues, are real, and investigate where the dust must lie and so build up a picture of what these systems are like.
Methods. We observe using ground-based mid-infrared imaging with TIMMI2, VISIR, Michelle and TReCS a sample of A and B-type main sequence stars previously reported as having mid-infrared excess. We combine modelling of the emission spectrum from multi-wavelength photometry with a modelling technique designed to constrain the radial extent of emission in mid-infrared imaging to constrain the possible location of the debris.
Results. We independently confirm the presence of warm dust around three of the candidates: HD 3003, HD 80950 and Tel. For the binary HD3003 a stability analysis indicates the dust is either circumstellar and lying at 4 AU with the binary orbiting at 14AU, or the dust lies in an unstable location; there is tentative evidence for temporal evolution of its excess emission on a 20 year timescale. For 7 of the targets we present quantitative limits on the location of dust around the star based on the unresolved imaging. We demonstrate that the disc around HD71155 must have multiple spatially distinct components at 2 and 60AU. We model the limits of current instrumentation to resolve debris disc emission and show that most of the known A star debris discs which could be readily resolved at 18m on 8m instruments have been resolved, but identify several that could be resolved with deep ( 8 hours total) integrations (such as HD19356, HD139006 and HD102647).
Conclusions. Limits from unresolved imaging can help distinguish between competing models of the disc emission, but resolved imaging is key to an unambiguous determination of the disc location. Modelling of the detection limits for extended emission can be useful for targeting future observational campaigns towards sources most likely to be resolved. MIRI on the JWST will be able to resolve the majority of the known A star debris disc population. METIS on the E-ELT will provide the opportunity to explore the hot disc population more thoroughly by detecting extended emission down to where calibration accuracy limits disc detection through photometry alone, reaching levels below 1 zodi for stars within 10pc.
Key Words.:
circumstellar matter – Techniques: high angular resolution – Infrared: stars1 Introduction
Analysis of the IRAS database over the last 20 years has shown that over 300 main sequence stars have dust discs around them. This material is thought to be the debris left over at the end of the planet formation process (e.g. Mannings & Barlow, 1998). The spectral energy distribution (SED) of this excess in the best studied cases (e.g., Vega, Pictoris, Fomalhaut, Eridani) peaks longward of 60m implying that this dust is cool (80K), and so resides in Edgeworth-Kuiper belt (EKB)-like regions in the systems. The EKB-like location and analogy is confirmed in the majority of cases where these discs have been resolved (in thermal emission, e.g. Holland et al. 1998; Greaves et al. 2005; in scattered light imaging, e.g. Kalas et al. 2007; Schneider et al. 2006, 2009), since the dust is shown to lie 40AU from the stars, and its short lifetime means that it must be continually replenished by the collisional destruction of km-sized planetesimals (Wyatt & Dent, 2002). The inner 40AU radius hole is thus thought to arise from clearing by an unseen planetary system, the existence of which is supported by the presence of clumps and asymmetries seen in the structure of the dust rings (e.g. Wyatt et al., 1999; Greaves et al., 1998; Augereau et al., 2001).
On closer examination the inner regions of known cool debris disc systems are much more complex than simply ’dust-free inner holes’. Pictoris has (a relatively small amount of) resolved dust in this inner region (Lagage & Pantin, 1994; Telesco et al., 2005; Boccaletti et al., 2009), thought to be there because this is a young (12Myr, Zuckerman et al. 2001) transitional system in which these regions have yet to be fully cleared by planet formation processes. Absil et al. (2006) have recently presented interferometric data showing Vega (thought to be around 380-500Myr old, Peterson et al. 2006) is likely to possess extended dust emission within 8AU, with evidence for a similar warm dust propulation around Fomalhaut (Absil et al., 2009), and di Folco et al. (2007) have also recently presented evidence for hot dust around the 10Gyr old Ceti. Multiple-component discs mirror our own Solar System, with our debris disc concentrated in the asteroid belt and EKB. It is possible that more sources with known cold discs have dust in the inner system, but the difficulty of separating hot dust emission from the stellar photosphere often limits detection. Chen et al. (2009) presented a sample of 11 debris systems believed to have multiple dust belts, although confirmation of the multiple components via resolved imaging is required for several of these stars.
The presence of excess in the mid-infrared range is of particular interest. The temperature of dust emitting at 24m suggests that it should lie close to the star, in regions of a few to a few tens of AU. These are regions in which we might expect planets to reside (see above), and so the origin of the emission and possible links with any cold debris in the system must be explored. Surveys suggest that 24m excess may be common, with around half of main sequence stars that exhibit excess mid-infrared emission in the IRAS database (Mannings & Barlow, 1998) having an excess at 25m only (Zuckerman, 2001). However, excesses taken from the IRAS database cannot be used at face value. Song et al. (2002), who searched the IRAS database for excess emission towards M-type stars, noted that when searching a large number of stars for excesses close to the detection threshold, a number of false positives must be expected due to noise. There have also been a few instances in which the IRAS excess has been shown to be attributed to background objects that fall within the relatively large IRAS beams (30”; such objects range from highly reddened carbon stars or Class II YSO’s Lisse et al. 2002, to distant galaxies Sheret et al. 2004). Another possible source of mid-infrared excess emission is reflection nebulosity (Kalas et al., 2002). Indeed it is now routine for papers discussing the excess sources found by IRAS to address the possibility that some of these are bogus debris discs (Moór et al., 2006; Rhee et al., 2007).
Recent statistical studies using Spitzer data have revealed a large sample of A stars with excess emission at 24 and/or 70m (Rieke et al., 2005; Su et al., 2006). Spitzer observations benefit from smaller beamsizes and higher resolution compared to IRAS, improving the reliability of excess measurements. The 24 and 70m excesses around A stars have a wide variation in levels amongst systems of similar ages, but overall there is a decrease in the upper envelope of excess inversely proportional to time (Rieke et al., 2005; Su et al., 2006). These features can be interpreted in terms of a steady-state evolution of belt-like planetesimal discs in a collisional cascade, where the fall-off with time is due to the collisional grinding away of material and the variation in excess levels between systems of similar ages can be reproduced by variations in initial disc mass and planetesimal belt radii (Wyatt et al., 2007b). Although recent work by Currie et al. (2008) has shown that excess emission at 24m around A stars increases from 5–10 Myr and peaks around 10–15 Myr before declining with age, which is not predicted by the steady-state model, this can be explained by the delayed formation of Pluto-sized bodies in the disc (Kenyon & Bromley, 2004a). It is only when Pluto-sized bodies are formed that the orbits of planetesimals are stirred to high relative velocities and the steady-state collisional cascade can begin.
However this model does not account for the possibility of multiple belts (see above). There have also been other models proposed to explain the variance in excess levels between similarly aged stars and the variety in the SED slopes of those stars with excess at both 24 and 70m in Rieke et al. (2005), which can be interpreted as evidence for stochastic evolution (Rhee et al., 2007). A collision similar to the Earth-Moon forming massive collision has been proposed as the explanation for the large excess and spectral features observed around HD172555 (Lisse et al., 2009). Similarly short-lived dust production origins have been proposed for dust found close to the central star around several Sun-like stars. For these systems a steady-state collisional cascade production from a spatially coincident planetesimal belt cannot explain the levels of excess (Wyatt et al., 2007a; Löhne et al., 2008). For debris discs with a cold dust population in addition to hot dust emitting at 24m the outer planetesimal belt could be feeding the hot dust population (as has been proposed for Corvi, Wyatt et al. 2007a; Smith et al. 2008, 2009b). However, the mechanism that might be transporting the dust from cold outer regions to the hot inner locations observed at 24m is as yet unclear (possibilities include dynamical scattering by a migrating planet, see e.g. Gomes et al. 2005; Booth et al. 2009).
To tackle these issues regarding the origin of the 24m dust emission, and in particular explore what its presence may reveal about planet formation and as yet undetected planetary populations, this paper looks at the constraints on the true dust distribution around a sample of A stars with 24m excess. This can be assessed indirectly from SED fitting to multi-wavelength infrared photometry, but uncertainties arising from degeneracies in dust model fitting and the possibility of multiple temperatures of dust mean that determining radial location from SED fitting alone is challenging (see discussions of individual sources in section 4). Resolved imaging provides more direct constraints on the dust location.
This paper is structured as follows; In §2 the sample selection is described. In §3 we describe the various observational and analysis techniques employed for the observations, with the results and discussion of individual sources presented in §4. An extension modelling technique is used to explore which of the A star discs in the literature may be fruitful subjects of future imaging in §5. The implications of these and the observational results are discussed in §6. Conclusions are in §7.
2 The Sample
The sample consists of A and B stars with IRAS published detections of excess emission at 12 and/or 25 m.111The sample stars are listed in the Debris Disc Database at http://www.roe.ac.uk/ukatc/research/topics/dust. A first-cut was applied to the list of all published detections to produce a final sample of 11 candidates (Table 1). This first-cut consisted of the analysis outlined below to determine if the excess identified by IRAS was likely to be real.
For each star J, H, and K band fluxes were obtained from 2MASS (Skrutskie et al., 2006) and V and B magnitudes from Tycho2 (Høg et al., 2000). The photospheric emission was then determined by adopting a Kurucz model (Kurucz, 1979) for the appropriate spectral type (as listed in the Michigan Spectral Catalogues or SIMBAD) scaled to the K band flux. IRAS fluxes were extracted using SCANPI (the Scan Processing and Integration tool)222http://scanpi.ipac.caltech.edu:9000/. The expected stellar flux was multiplied by the colour-correction factor (at the levels described in the IRAS Explanatory Supplement333The IRAS Explanatory Supplement is available at http://irsa.ipac.caltech.edu/IRASdocs/exp.sup/) before subtraction from the IRAS flux to determine the excess. The proximity of the IRAS sources to the stars was also checked given the quoted uncertainty error ellipse, since some surveys allowed excess sources to be up to 60 ″offset and have since been shown to not be related (Sylvester & Mannings, 2000).
| Star name | Stellar type | Age | Distancea | IRAS fluxes (mJy)b | |
| Myr | pc | 12m | 25m | ||
| HD 3003 | A0V | 50c | 47 | 148 + 16 (20) | 34 + 241 (20) |
| HD 23281 | A6V | 626d | 43 | 251 + 36 (20) | 59 + 107 (28) |
| HD 23432 | B8V | 100e | 119 | 127 + 256 (43) | 29 + 1159 (42) |
| HD 31295 | A0V | 100e | 37 | 336 + 238 (65) | 78 - 110 (121) |
| HD 38206 | A0V | 9f | 69 | 130 + 7 (23) | 30 + 67 (21) |
| Gemg | A3V | 560f | 29 | 1166 + 214 (28) | 271 + 161 (52) |
| HD 71155 | A0V | 169c | 38 | 675 + 162 (31) | 157 + 249 (41) |
| HD 75416 | B8V | 5f | 97 | 134 + 86 (22) | 31 + 86 (38) |
| HD 80950 | A0V | 80f | 81 | 120 - 5 (26) | 28 + 101 (17) |
| HD 141795 | Am | 450e | 22 | 1154 + 67 (25) | 269 + 141 (28) |
| Teli | A0V | 48 | 263 + 138 (34) | 61 + 394 (22) | |
Notes: a=Distance from parallax in Hipparcos; b=Fluxes are shown as star + excess (error); c=Age taken from Song et al. (2001); d=Age taken from Kunzli & North (1998); e = Age determined from theoretical evolutionary tracks of Song et al. (2001), see discussion in text; f=Age taken from Rieke et al. (2005); g HD 56537; h= =Age from Pictoris association membership, Zuckerman et al. (2001); i HD 181296. For those sources without ages listed in the literature (HD 23432, HD 31295 and HD 141795) the and magnitudes as listed in Hauck & Mermilliod (1998) were used to determine and from the grids of Moon & Dworetsky (1985). Then the theoretical evolutionary tracks of Song et al. (2001) were used to determine the approximate ages for these stars.
3 Observations and Data Reduction
3.1 Observations
Observations were performed using: TIMMI2 on the ESO 3.6m telescope at La Silla (proposals 71.C-0312, 72.C-0041 and 74.C-0070); VISIR on the ESO VLT (proposal 076.C-0305); and Michelle and TReCS on the twin telescopes of Gemini (GN-2005B-Q-15 and GS-2005B-Q-67). All observations used chop-nod pattern to remove sky and telescope emission. A chop of 10″in the North-South direction with a perpendicular 10″nod was used for the ESO observations. The Gemini observations used a 15″chop and parallel nod (also of 15″) at 30∘ East of North. Observations of Gem were performed with a chop at 268∘ to ensure the image of the binary companion would fall on the array.
This chop-nod pattern means that a simple co-addition of the data produces an image with two positive and two negative images of the source for the ESO observations, and one positive and two negative images at half the intensity level for the Gemini observations. A dark current offset is determined from median values for each row and column of the image (excluding pixels on which the source image fell) and subtracted from the final frame. Pixels showing high levels of variation throughout the observation (10 times the average) were masked off. Pixels showing very high or low gain (determined by comparing average sky emission detected across the image to that detected in each individual pixel detection) were also masked. In total an average of around 7% of pixels were removed in the TIMMI2 observations, and around 4% of pixels in the MICHELLE, TReCS and VISIR observations. Calibration observations of standard stars within a few degrees of the science object were taken immediately before and after science observations. The standards were chosen from the list of K and M giants identified by Cohen et al. (1999). In addition to photometric calibration, these standards were used to characterise the PSF and used for comparison with the science sources to detect any extension (see section 3.3).
3.2 Photometry and Background/Companion Objects
The multiple images resulting from the chop-nod pattern were co-added to get a final image by first determining the centroid of each of the individual images. Photometry was then performed using a 1″ radius aperture for the TIMMI2 images and a 05 radius aperture for the VISIR and MICHELLE images. These sizes were chosen to just exceed the full-width at half-maximum (FWHM) found for each instrument (average FWHM: 080 012 in the N band, and 134 010 at Q for TIMMI2; 0465 0161 at N on VISIR, and in the Q band 0597 0166; for Michelle 0557 0107 in N and 0579 0101 in Q; and for the N band observations with TReCS 0475 0054). Note that the filters used in these observations were narrow band and so no colour-correction was applied. Residual statistical image noise was calculated using an annulus centred on the star with inner radius matching the outer radius of the aperture used for the photometry, and outer radius of twice the inner radius (so 2″ for TIMMI2 and 1″ for VISIR and MICHELLE). Typical levels for statistical noise at the 1 level in a half hour observation were 44mJy total in the 10 radius aperture of TIMMI2, 4 mJy and 12mJy for the 05 aperture of VISIR in N and Q respectively, 6mJy in the 05 aperture of MICHELLE and 3 mJy in the 05 aperture of TReCS. Calibration uncertainty was determined from variation in standard star photometry, and was added in quadrature to statistical uncertainty to give the total error on the photometry as listed in Table 2.
Smaller apertures were used to search for background sources and to place limits on undetected sources. The aperture radius was determined through examination of the standard star images. Circular apertures of increasing radius were centered on the standard star images and the radius giving the highest signal-to-noise (statistical noise only, as determined in the annuli listed above) was recorded. For each instrument and observing wavelength the median optimal radius for maximising signal-to-noise on the standard stars was chosen to optimise point source detection. The apertures had radii of: 08 for TIMMI2 observations; 04 for MICHELLE and for TReCS; and 032 and 035 for the N and Q filters for VISIR. Apertures were systematically centred on each pixel of each array to search for detections; where none were found the limits on any background object were based on the 3 uncertainty in the aperture plus calibration uncertainty. For the non-photometric nights, limits were based on calibration to the IRAS flux of the object. The upper limits to background sources are listed in Table 2. These have been translated into a limit on the spectral type of any companion source. These spectral limits assume any companion is a main-sequence star at the same distance as the source, and are given as the hottest star that does not exceed the point source limits found in the imaging.
3.3 Extension testing and limits on disc size
Evidence for extended emission was checked for all science targets. The source’s surface brightness profile was determined by calculating the average surface brightness in a series of annuli centred on the source of 2 pixel thickness by increasing inner radius from 0 to 3″, and this was compared to profiles of the standard targets. Finally the images of the point-like standard stars scaled to the peak of the science images were subtracted from the science images and the residuals checked for consistency with noise levels measured on the pre-subtraction image. A range of regions optimised for different disc geometries were tested for evidence of residual flux indicating spatially extended emission. These optimal regions were determined from extensive modelling work and are outlined in detail in section 4 of Smith et al. (2008).
| Observation | Predicted | Resultsa | ||||||||
| Star | Integration | stellar | Flux, | Total | Stats. | Background limit | ||||
| name | Filter | , m | time, s | Instrument | flux, mJy∗ | mJy | err., mJy | err., mJy | mJyb | Spc. Typec |
| HD 3003 | N9.8 | 9.56 | 1800 | TIMMI2 | 426 | 481 | 87 | 17 | 46 | M3.5V |
| N12.9 | 12.21 | 3600 | TIMMI2 | 262 | 436 | 64 | 10 | 27 | ||
| Q2 | 18.75 | 3100 | TIMMI2 | 112 | 206 | 140 | 44 | 148 | ||
| Si-5 | 11.66 | 3400 | TReCS | 288 | 375 | 34 | 4 | 10 | ||
| Q2 | 18.72 | 2400 | VISIR | 113 | 244 | 27 | 9 | 21 | ||
| HD 23281 | N12.9 | 12.21 | 3200 | TIMMI2 | 243 | 339 | 57 | 10 | 27 | M5V |
| SiC | 11.85 | 3600 | VISIR | 258 | 252 | 13 | 2 | 4 | ||
| Q2 | 18.72 | 3800 | VISIR | 104 | 129 | 9 | 6 | 13 | ||
| HD 23432 | N7.9 | 7.77 | 1800 | TIMMI2 | 299 | 452 | 192 | 192 | 351 | A6V |
| N11.9 | 11.59 | 1800 | TIMMI2 | 136 | 141 | 62 | 14 | 44 | ||
| HD 31295 | N1 | 8.60 | 1800 | TIMMI2 | 648 | 851 | 77 | 13 | 33 | M3V |
| HD 38206 | N9.8 | 9.56 | 1800 | TIMMI2 | 204 | 196 | 48 | 16 | 44 | G3.5V |
| Gem | N1 | 8.60 | 1800 | TIMMI2 | 2244 | 1997 | 167 | 22 | 56 | M5.5V |
| Chop PA | SiC | 11.85 | 540 | VISIR | 1195 | 701 | 9 | 4 | 7 | |
| 268∘ | Q2 | 18.72 | 1880 | VISIR | 484 | 590 | 71 | 6 | 14 | |
| Binary | N1 | 8.60 | 1800 | TIMMI2 | 101 | 68 | 8 | - | ||
| Chop PA | SiC | 11.85 | 540 | VISIR | 54 | 46 | 4 | - | ||
| 268∘ | Q2 | 18.72 | 1800 | VISIR | 22 | 31 | 17 | - | ||
| HD 71155 | N2 | 10.68 | 3060 | TIMMI2 | 850 | 1278 | 215 | 36 | 98 | K4.5V |
| Si-5 | 11.60 | 1410 | MICHELLE | 722 | 1050 | 115 | 12 | 32 | ||
| Qa | 18.50 | 2100 | MICHELLE | 286 | 398 | 99 | 13 | 38 | ||
| Q2 | 18.72 | 3600 | VISIR | 280 | 380 | 36 | 7 | 16 | ||
| HD 75416 | N11.9 | 11.59 | 1800 | TIMMI2 | 144 | 204 | 88 | 15 | 48 | F0V |
| HD 80950 | N11.9 | 11.59 | 3600 | TIMMI2 | 129 | 175 | 16 | 10 | 25 | K4.5V |
| SiC | 11.85 | 1800 | VISIR | 124 | 120 | 23 | 3 | 7 | ||
| Q2 | 18.72 | 3760 | VISIR | 50 | 119 | 11 | 9 | 20 | ||
| HD 141795 | N12.9 | 12.21 | 1200 | TIMMI2 | 1115 | 1138 | 119 | 19 | 49 | M4.5V |
| Qa | 18.50 | 1900 | MICHELLE | 491 | 511 | 39 | 3 | 8 | ||
| Tel | N12.9 | 12.21 | 2500 | TIMMI2 | 254 | 351 | 23 | 10 | 25 | K2V |
| Q2 | 18.75 | 1800 | TIMMI2 | 109 | 391 | 182 | 43 | 136 | ||
∗ The expected photospheric emission is determined by a Kurucz model profile appropriate to the spectral type of the star and scaled to the K band 2MASS magnitude as outlined in section 2 unless otherwise stated in the individual source description. Errors are 1. M band TIMMI2 observations were largely non-photometric and primarily used to improve pointing accuracy and thus are not listed in this table. Notes: a Errors are total errors (inclusive of calibration uncertainty and image noise). b Limits are 3 upper limit to undetected object including calibration errors, or scaled to IRAS fluxes when conditions were non-photospheric. These limits are valid to within 28″of the detected source for TIMMI2 observations, 126 for MICHELLE, 81 for TReCS, and 114 of the source for VISIR observations. c The hottest spectral type of main-sequence star equidistant with the target that would have remained undetected within our field of view. See section 3.2 for details of this limit.
| Star name | Fit as dust disc | Limit on extension | |||||
| Temp, K | AU | ″ | AU | mb | |||
| Photometric confirmation of excess | |||||||
| HD 3003 | 265 | 4.00 | 0.086 | 0.55 | 20.1 | 0.053 | |
| HD 80950 | 180 | 13.6 | 0.17 | 0.01 | 9.62 | 0.544 | |
| Telc | 3.90 | 0.081 | 15.7 | 0.210 | |||
| 21–26 | 0.44–0.54 | - | 13.9 | 12.52 | |||
| Constraints on radial extent of disc | |||||||
| HD 71155 | 500 | 1.98 | 0.052 | - | 8.95 | 0.0034 | |
| 90 | 61.03 | 1.59 | - | - | 1.92 | 7.60 | |
| Gemd | 420 | 2.16 | 0.07 | 0.012 | 5.64 | 0.002 | |
| HD 23281 | 210 | 5.36 | 0.12 | 0.68 | 3.82 | 0.024 | |
| HD 75416 | 250 | 11.1 | 0.11 | - | 7.98 | 2.44 | |
| HD 141795 | 250 | 4.64 | 0.22 | 0.73 | 4.43 | 0.008 | |
| Unconstrained by these observations | |||||||
| HD 31295 | 80 | 52.6 | 1.4 | - | - | 5.85 | 9.216 |
| HD 38206 | 90 | 48.4 | 0.70 | - | - | 15.1 | 84.96 |
Note that the objects with no extension limits have too low a
fractional excess for the extension to have been detected in the
images regardless of size. Estimates of radius are based on blackbody
fits and could be up to three times larger if the grains responsible
for the emission are small. Limits on extension shown here are for a
narrow face-on discs. Errors on this limit arise from 3
photometric errors and errors on the determination of the photospheric
emission at the observed wavelength. These sources are combined to
give 3 uncertainties on , which in turn give a
range of radii at which a disc could have been detected as extended emission.
Horizontal lines indicate division into photometrically
confirmed debris discs, and sources
for which our results provide constraints on the discs (sections 4.1 and
4.2 respectively).
Notes: a See section 6 for details of this limit; b
the minimum grain diameter (for the composition assumed in section
3.3) such that grains at the maximum radius
given by the extension testing limits do not exceed the temperature of
the blackbody fit to the excess emission (where limits on the disc radius
are large compared to the blackbody radius no limit can be placed on the
minimum grain size, as even the smallest grains cannot reach the
fitted temperature at the extension limit radius); c
These disc locations are taken from Smith et al. (2009a); d binary detected.

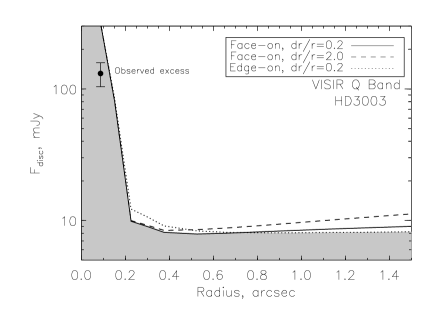

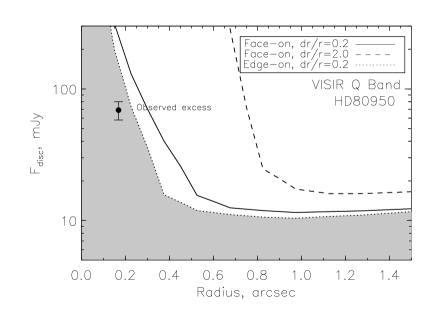
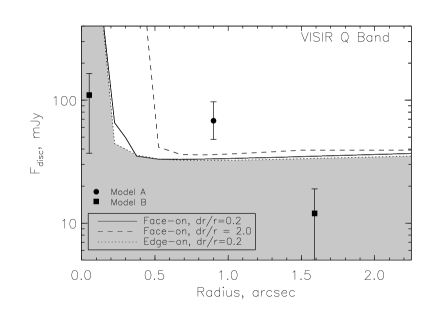
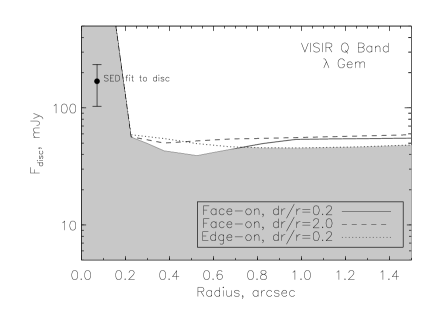
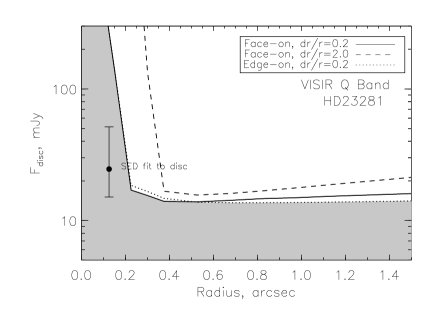
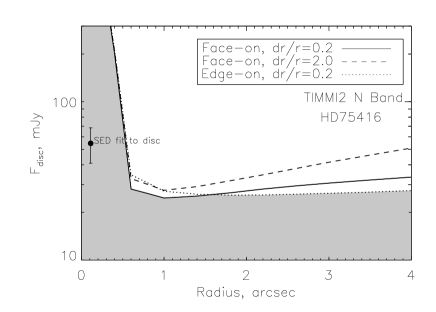
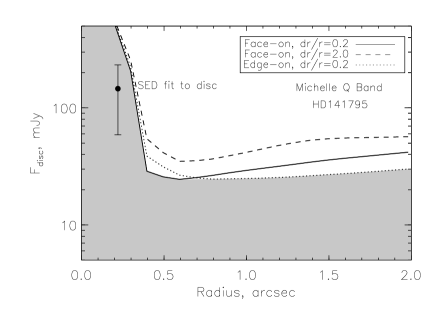
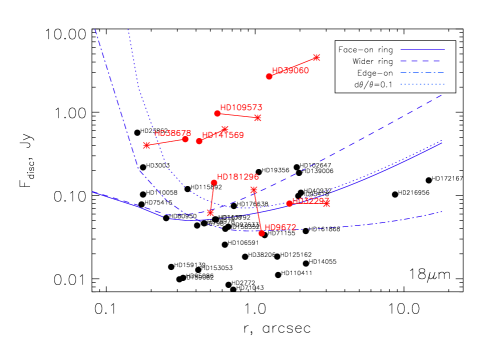
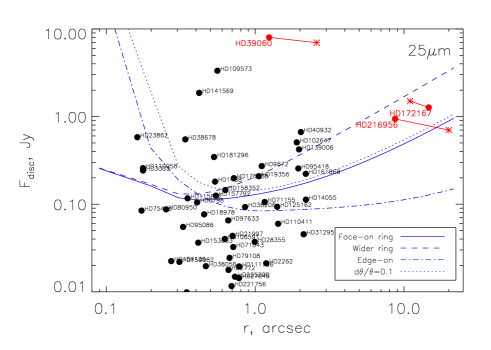
To test the limits we can place on disc extension with unresolved images, we performed the same PSF subtraction and residuals testing on models of stars + discs. The stellar component was modelled as a point source with flux set as predicted for each star in the appropriate filter (see Table 2). Discs with different radii, width and inclination to the line of sight and with different levels of flux were added to the point source. The whole model was convolved with the PSF as modelled by standard star images to create a range of model images. Different standard star images were used to model the effects of PSF variation. This process is described in detail in Smith et al. (2008). The disc geometries considered are simple ring-like discs with uniform brightness, with central radius and width . The limits shown in Figures 1-4 are for disc widths (so a disc extending from to in radius) and (a disc from the central star to ). The central disc radius was varied from 0 to 15 for the observations with VISIR and Gemini, and up to 4″for TIMMI2 observations. The flux of the disc was scaled from 0 to 100% of the total flux of the source in the observed filter. Each model image was subjected to the same testing procedures as the science image itself, testing regions of the point-source subtracted image that had been optimised for the detection of extension for the disc parameters used as input. These optimised regions were based on modelling work described in Smith et al. (2008). Regions above the lines for different disc geometries in Figures 1-4 represent disc models that were detected as extended objects (emission detected in optimal testing regions) at a level of at least 3 (noise included pixel-pixel background noise and noise from PSF uncertainty as detailed in Smith et al. 2008). Regions below the lines (shaded area) represent disc models that were not detected. The resulting limits on detecting extended emission are dependent on PSF stability for discs at small radii, and on the sensitivity of the observation for discs at larger radii (see Figures 2 and 3 of Smith et al. 2008).
As we do not resolve any extended emission in the observations presented in this paper, these limits are compared with the predicted radial location of the disc. The excess emission SED is fitted with a single-temperature blackbody which is converted to a radial offset assuming blackbody-like grains. If the grains which dominate the emission are small they will be inefficient radiators, hotter than blackbody grains at a fixed radial location. Thus the predicted radial location will be an underestimate of the disc offset if small grains dominate the emission (as has been seen in scattered light and thermal imaging of resolved discs, see section 5). Schneider et al. (2006) showed that for the HD181327 system its disc was imaged at a radius corresponding to 3 times that expected from a blackbody fit to the emission spectrum, a fact attributed to the emission from this disc being dominated by small inefficiently emitting but efficiently absorbing grains. Other resolved discs have been shown to have radii that can differ from the blackbody fit by up to a factor of 3 (see Table 4). As the grain properties of the discs are unknown, in the results section the extension limits are compared to the radius suggested by assuming blackbody grains and up to 3 the blackbody radius. In all cases the extension limits are consistent with a disc lying at the blackbody radius (see Table 3) but the discs could also be dominated by smaller grains at a larger radial offset (up to the extension limit). The exception in the single disc case is HD71155, for which the extension limits indicate the disc must have multiple belts (see discussion in section 4.2). We therefore also determine the minimum grain size that will not exceed the temperature fit to the excess emission when at the extension limit listed in Table 3. This calculation requires the assumption of grain composition which we take for reference to be non-porous grains with no ice inclusions with a silicate fraction of 1/3 and 2/3 organic refractory material (see Wyatt & Dent 2002 for details of how grain temperatures were calculated for the assumed composition). These minimal grain sizes are listed as in Table 3. In all cases these grains are smaller than the blowout limit (1.3m for an A0V-type star assuming the grain properties given above, or greater for cooler stars), and so it’s more likely that the true disc radius is smaller than the extension limit given in Table 3.
4 Results
We split our debris disc targets into 3 subgroups based on the observational results: those with excess independently confirmed in our photometry; those for which limits can be placed on the extent of the disc with these observations; and those for which we cannot place limits on the disc with our data (HD 31295 and HD 38206). These categories are identified in Table 3. In addition HD 23432 was found to have excess due to a reflection nebula and not a disc. This source together with HD 31295 and HD 38206 are described in Appendix A. The photometrically confirmed sources and those for which we can place limits on the disc with our observations are described below.
4.1 Photometrically confirmed discs
Tel: The excess emission towards Tel was confirmed in our N band photometry with TIMMI2 at a 4 level of significance (Table 2). Resolved imaging of this target, revealing a two-component disc system with an outer component lying at 24AU resolved at 18m and a further unresolved inner component which SED fitting shows is at 4AU, is presented in detail in Smith et al. (2009a). We shall not discuss this source further in this section, but will include this source in the discussion of the sample in section 6.
HD 3003: This star was identified as having significant 25m excess (see Table 1) by Oudmaijer et al. (1992). This star is a binary: both components are A stars with similar luminosities (, Dommanget & Nys 1994). The B component was listed as being at an offset of 01, 143∘ East of North in 1925. The last confirmed observation of the separate components was in 1964 with the B component at an offset of 01, 171∘ (Mason et al., 2001).
The star was observed with TIMMI2 at N and Q with follow-up on 8m telescopes in both bands (see Table 2). None of the observations resolved the separate stellar components. Excess was confirmed photometrically at Q (detected 24427mJy, expected 1132mJy from photosphere giving an excess of 13127mJy - uncertainty on photosphere taken from fitting Kurucz model profiles to K band flux1 error, and uncertainty on the detected emission and on the photosphere were added in quadrature to give error on excess), although calibration uncertainty prevents confirmation at shorter wavelengths. This is in good agreement with Smith et al. (2006) who presented MIPS 24m confirmation of excess for this source (detected 155 9 mJy after subtraction of the photosphere). The recent 24m and 18m detections presented here suggest a lower excess than that suggested by IRAS photometry (275 20 mJy at 25 m). Though the results are different at the 4 level only, it is possible that the emission from the source may show temporal variance. A dust temperature fit of 265K is consistent with the observed excess and shorter wavelength limits (see Table 3 and SED in Figure 1). Uncertainty on the blackbody temperature fit was taken from temperature range that allows a fit to within 3 for all excess measurements. Undetected background targets within the TReCS field-of-view (section 3) are constrained to 10mJy at N, confirming the excess is centred on the star.


The final images showed no evidence of extended emission at any band. The Q band VISIR images place the tightest constraints on the disc size, putting a limit of 6.5AU on the disc’s extent. If the binary listed in Mason et al. (2001) is a true binary at a separation of 01 (4.7AU at 47pc, Table 1) the stability analysis carried out by Holman & Wiegert (1999) would suggest the disc cannot be circumbinary, as the disc should be at a radius of 024 (11.3AU or greater if the orbital separation is larger or the orbit is eccentric).444We have tacitly assumed here that the dust grains are distributed following the orbits of the parent planetesimals. As dust grains are affected by Poynting-Robertson drag they may have a different spatial distribution to the parent bodies. However, following the equations in Wyatt (2005) we find that the grain collisional lifetime () is shorter than the Poynting-Robertson drag timescale () for all disc radii up to the resolution limit, i.e. that for AU. The dust grains are therefore likely to be collisionally dominated and occupy a spatial distribution similar to the parent population. We conclude that the disc must therefore be circumstellar. Assuming that the dust is around the primary star the temperature fit of 265K translates to an offset of 4AU assuming blackbody grains using (e.g. Backman & Paresce 1993, where is the dust location in AU, is the temperture in Kelvin and is the stellar luminosity in units of ). This assumes the grains are in thermal equilibrium with their environment. Grains smaller than the wavelength at which the excess emission peaks are inefficient emitters and are thus hotter than blackbody temperature at that radial offset from the star. Such grains can be offset by three times the radius suggested by a blackbody approximation (see discussion in section 3.3). Assuming a radius of 4 AU there are then two possibilities for the system: either the dust is in a stable location and the binary must have a semi-major axis of at least 14.4AU (or larger if the binary orbit is eccentric, according to equations of Holman & Wiegert 1999); or the binary is closer to the star and the dust is unstable. Such unstable dust populations have already been detected in a small number of binary systems (Trilling et al., 2007). However, if the dust is in an unstable region this could naturally explain the tentative evidence for temporal evolution in the level of excess. If the dust resides in a stable location, the motion of the binary changing the overall illumination of the system as it travels on its orbit could also possibly explain any temporal evolution. Determining the orbit of the binary will be a crucial step in determining the stability of the dust in this system.
HD 80950: This star was identified by Mannings & Barlow (1998) as a possible host of mid-infrared excess based on the IRAS 25m measurement of its flux (excess 10117 mJy, see Table 1). The source was observed with TIMMI2 at N and VISIR at N and Q, with the Q band photometry allowing a confirmation of the excess (total detected flux 11911 mJy, predicted stellar photospheric emission in this filter 502mJy with uncertainty taken from 2MASS Kband uncertainty, see Table 2). A fit to the Q band excess emission and the 24 and 70m excess reported in Su et al. (2006) suggests a temperature of 180K for the excess emission (uncertainty determined by range of temperature fits that fit all excess measurements to within 3). Morales et al. (2009) used a similar blackbody temperature of 188K to fit the Spitzer MIPS and IRS data on this target. No background/companion sources were detected in any of the images (see Table 2 for brightness limits on such sources). No evidence of extension was detected in any of the images. The resulting limits on possible disc sizes and geometry are relatively broad due to high levels of variation in the PSF during the observations. For face-on discs the limits suggest a disc radius of 24.5AU if the dust is distributed in a narrow ring (at a distance of 81pc, Table 1), or 61AU for a broad face-on disc (see Figure 1). Assuming the grains are blackbody-like suggests an offset of 13.6AU, consistent with these limits for all disc geometries. Grains much smaller than the peak of emission can lying at 3 blackbody radius (see discussion of HD 3003 and section 3.3) would lie at 40.8AU (051) which should be detectable in 8m observations with a more stable PSF. With our current constraints we can say that if very small grains dominate the emission, the dust must be distributed over a broad radial range.
4.2 Limits on disc extension

HD 71155: This star was identified by Coté (1987) as being a host of mid-infrared excess based on IRAS observations (see Table 1). Calibration uncertainty prevented photometric confirmation of the excess in our observations, but we can rule out background objects within the TIMMI2 field of view of 98mJy at N or within the VISIR field-of-view 16mJy at Q (Table 2). We thus confirm any excess should lie on the target. Rieke et al. (2005) and Su et al. (2006) used MIPS photometry to confirm the excess at 24 and 70m. These results suggested somewhat lower excess than found with IRAS, but the difference is not significant at 3. In the following analysis we retain the MIPS 24m result (detected 30219mJy) in preference to the IRAS 25m result to take advantage of the reduced errors.
The more recent measurements (upper limits at N and Q presented in this paper and the MIPS excesses) allow a single temperature dust fit (model A) at 12015K (uncertainty from all temperatures that fits excess data with 3, see Table 3 and Figure 2; temperature similar to the 105K fit suggested by Su et al. 2006). However, if the 12 m excess detected by IRAS is taken into account, which is not ruled out by the limits presented here, then a two-temperature dust model (model B) fits the spectral energy distribution better (500180K and 9020K, see Figure 2). Although no evidence for extension was seen on any of our images, the non-detection in the VISIR Q band image allows us to place constraints on the dust location in the context of the two alternative models making the assumption that the different temperatures represent different radial locations. Figure 2 shows that we should have detected resolved emission if the dust was located at a radius of 34AU (assuming blackbody grains at 120K; model A), regardless of disc geometry. The results therefore support a two component disc model, as was found for Tel (Smith et al., 2009a). The inner component of this model is limited to 8.4AU assuming a face-on orientation (Figure 2). The predicted location of 500K dust assuming blackbody-like grains is 2AU. This predicted location agrees with the results of Moerchen et al. (2009), who found extended emission around this source at 10.4m consistent with a disc at 2AU. The outer component is predicted to be at 61AU (159) where sufficiently deep observations on current instruments could resolve this disc.
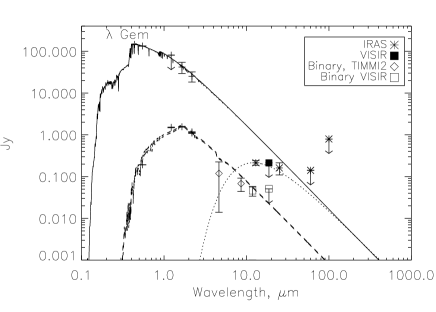
Gem: This source was listed in Cheng et al. (1992), a study of main-sequence A-stars, as having an IRAS excess. This source is notable as having one of the largest 24m excesses amongst older stars (Rieke et al. 2005; stellar age is 560Myr). The star is listed in the Washington Double Star Catalogue as having a visual binary companion at a distance of 96 at a position angle of 33∘ East of North. Additionally, component A has a binary companion confirmed through lunar occultation measurements (Dunham, 1977; Richichi et al., 1999). These measurements show evidence for a binary orbit that changes the companion’s relative position significantly over 20 years (offset 45mas, PA 300∘ in 1977, offset 14mas, PA 120∘ in 1999).


The visual binary was resolved in TIMMI2 and VISIR N band observations at a separation of 983005, PA 301∘ (measured in VISIR image). The secondary component is also resolved at M (central wavelength 4.6m) with a flux of 11935mJy. We do not resolve the separate components of visual component A. Calibration uncertainty was high in the VISIR observations, as indicated by the low flux measured on the primary (Table 2), and thus we do not photometrically confirm the excess. The flux of the binary given in Table 2 and shown on the SED (Figure 3) was scaled to the expected primary photometry (so multiplied by ). The visual binary was fitted with a K7 spectral type to fit the JHK photometry from the 2MASS catalogue. Adopting the parallax distance to the primary of 292 pc the luminosity of the binary is , consistent with a luminosity of typical for K8-type stars.
After subtracting the primary and binary contributions predicted from the SED fitting the IRAS measurements still indicate significant excess at 12 and 25m (see Figure 3 and Table 1). There are no nearby 2MASS or MSX sources likely to be responsible for the excess measurements in the IRAS results, the source is not in the galactic plane (b = 13.2), and no additional sources are detected in our field of view, thus the IRAS excess is not likely to be due to a background source (limits on background sources listed in Table 2). No evidence for extension is found in the images. We should have detected discs larger than 6.1AU assuming a disc flux of 260mJy at Q from a dust temperature fit of 420K (scaled to IRAS 12 and 24m photometry, error on the blackbody fit is 80K from errors on excesses measured in IRAS). Blackbody grains at this temperature would be at an offset of 2.2AU, or if the grains are small and lie at 3 blackbody offset (as discussed in sections 3.3 and 4.1) they would be at 6.6AU, just beyond the limits on disc extension. The excess emission and SED fit should be confirmed before we can interpret these limits in terms of constraints on the emitting grains.
HD 23281: HD 23281 was first identified as a possible host of mid-infrared excess by Shylaja & Ashok (2002). IRAS photometry at 25m is indicative of excess emission at 3.8 significance (Table 1). Our photometric results do not confirm the excess on this target (Q band photometry is consistent with excess but at a level, see Table 2). No additional objects are seen in the field of view, with a limit on undetected sources of mJy at N. There are no bright 2MASS or MSX sources nearby that may have been caught in the IRAS beam and could be responsible for source confusion. There is no indication of extension found on any of the images of this object. Narrow discs at 9.5AU or broader discs 15.9AU should have been detected as extended emission in the VISIR Q band imaging (assuming 24mJy from SED fitting, see Figure 3) . We fit the IRAS 25m photometry and VISIR upper limits on excess with a dust temperature of 210K . Blackbody-like grains at 210K would lie at an offset of 5.4AU, consistent with the limits on extended emission. Very small grains that could lie at 3 this offset (see sections 3.3 and 4.1) should have been detected as extended emission, if = 25mJy although the level of excess and dust temperature fit are currently too uncertain to allow constraints to be placed on the dust properties.
HD 75416: HD 75416 ( Cha) was identified as a possible mid-infrared excess host by Mannings & Barlow (1998) in their study of the IRAS catalogues. It has significant excess at 12m (Table 1). Our observation (TIMMI2, N band) did not confirm the excess (detected 20488mJy, predicted stellar flux is 1446mJy). MIPS photometry at 24m (Rieke et al., 2005) is in good agreement with the IRAS detection at 25 m (MIPS 128 13 mJy photosphere 342 mJy, IRAS 117 38 mJy photosphere 312mJy). Su et al. (2006) presented new 24 and 70m photometry which also confirms the excess. The limit on any background source within the TIMMI2 field-of-view is 48mJy (3 at N), and thus it is very likely the excess is centred on the source. There is no evidence of extended emission in the image, and thus we can place a limit on the disc radius of 55AU on a disc of flux 55mJy in the N band (based on a fit to the MIPS and IRAS photometry). The fit to the excess at a temperature of 250K would translate to 11.1AU for blackbody grains, consistent with the non-detection of extension in the TIMMI2 image (error on blackbody temperature 60K from errors on excess emission). Even very small grains at 3 the blackbody radial offset (see section 4.1) would not be detected as extended emission.
HD 141795: This star was listed as an excess candidate by Shylaja & Ashok (2002). The IRAS 25m measurements of this source’s photometry suggests an excess of 141 28mJy. Calibration uncertainties prevent a photometric confirmation of the excess in the TIMMI2 and Michelle observations of the target (Table 2). Background and companion sources are ruled out at a level of 49mJy (N band, TIMMI2) and 8mJy (Q band, Michelle), and thus any excess is not likely due to detection of an additional source in the IRAS beam.
The images show no evidence for extension, and we place limits on the extension of a disc with flux of 146mJy at Q (estimated from the 25m excess measurement and 12 and 60m upper limits) of 6.2AU (Figure 4). This is consistent with the SED fit which uses a dust temperature of 250K putting the dust at 4.2AU for blackbody grains. However, the true dust temperature and disc flux at Q is highly uncertain (error on blackbody temperature fit is 70K). Photometric confirmation of the excess is necessary to confirm the limits provided by the extension testing.
5 Resolvability of discs in the mid-infrared
We now consider what mid-infrared debris discs could be resolved with currently available instruments and future instrumentation. We use the extension testing method described in section 3.3 and in detail in Smith et al. (2008) with PSF size and sensitivity appropriate to each instrument considered to determine the limiting disc parameters for resolution (disc size and flux for different geometries). A short description of the parameters used for each instrument considered are given in the subsections below, and the limits shown in Figure 5.
| Star | Wavelength | Predicted disc from SED fit | Observed disc | Reference | |||
| HD | Name | m | Radius, ″ | Flux, mJy | Radius, ″ | Flux, mJy | |
| 9672 | 49 Ceti | 18 | 1.42 | 35 | 0.98 | 68 | Wahhaj et al. (2007) |
| 32297 | 18 | 1.7 | 80 | 3.02 | 80 | Moerchen et al. (2007a) | |
| 38678 | Lep | 18 | 0.43 | 475 | 0.18 | 400 | Moerchen et al. (2007b) |
| 39060 | Pic | 18 | 1.59 | 2688 | 2.59 | 4336 | Telesco et al. (2005) |
| 109573 | HR4796 | 18 | 0.51 | 1307 | 1.04 | 807 | Telesco et al. (2000) |
| 141569 | 18 | 0.45 | 549 | 0.63 | 623 | Fisher et al. (2000) | |
| 181296 | Tel | 18 | 0.53 | 142 | 0.5 | 62 | Smith et al. (2009a) |
| 39060 | Pic | 25 | 1.24 | 8005 | 2.59 | 6960 | Telesco et al. (2005) |
| 172167 | Vega | 24 | 14.7 | 1271 | 11 | 1500 | Su et al. (2005) |
| 216956 | Fomalhaut | 24 | 8.7 | 939 | 20 | 700 | Stapelfeldt et al. (2004) |
On each plot we also show a representative sample of A star debris discs for comparison with the determined limits (overplotted with filled circles). This sample is from Wyatt et al. (2007b) and shows A star discs detected at 24 and 70m or 25 and 60m. Disc radii and flux levels are taken from fits to the excess emission with a single temperature blackbody as described in that paper. There are several uncertainties inherent in this fitting. The radii determined for the discs assumes the emitting grains behave like blackbodies, when in reality small grains which are inefficient emitters may dominate the emission and the dust could be up to 3 times further from the star than this blackbody radius. Multi-temperature fits to the excess are possible. Different temperatures could represent different grain populations at one radial location, or could indicate dust at several radial locations (as is the case for Tel, Smith et al. 2009a). In such cases the predicted radial location and the level of disc flux for each component would be different from the simple single temperature fit shown here. The level of disc flux predicted at wavelengths other than 24 and 70m (or 25 and 60m) may be incorrect even in the case that a single temperature is an accurate model for the emission. This is particularly true if spectral features are involved, for example several spectra of debris disc targets with IRS on Spitzer have shown strong silicate features in the N band (see, e.g. Rieke et al., 2005; Chen et al., 2006; Lisse et al., 2009). The effect of these uncertainties can be seen in the discs already resolved (shown in red in Figure 5). The resolved disc locations and fluxes are shown by asterisks and listed in Table 4. The value of (observed disc radius / predicted disc radius) is as high as 2.3 (for Fomalhaut) for the restricted set of discs resolved in the mid-infrared. This ratio is as low as 0.42 for HD38678, which may have a multiple component disc (as suggested by Fitzgerald et al. 2007) which was incorrectly fitted with a single temperature. As a final note of caution, the population shown on these plots is only a sample of known discs detected at 24 and 70m and thus may not be truly representative of the population of discs at 10 and 18m (e.g. hot discs detectable at 10m may not be detected strongly at 70m). Discs around Sun-like stars, which will in general be smaller than the A star discs (as dust must be closer to cooler stars to heat to mid-infrared temperatures) are also excluded from the sample shown. These plots can be used as a guide to the best sources to include in future observational programmes aimed at resolving mid-infrared discs, but only through such resolution can the true disc parameters be known.
Disc resolvability : Gemini, 2 hours on source
Disc resolvability : MIRI, 1 hour on source

Disc resolvability : MIRI and METIS, 1 hour on source
5.1 Gemini instruments
We consider the detection limits achieved in 2 hours of observing at 18 and 25m (2 hours on-source; after overheads and repeated standard star observation to monitor the PSF total observing time approximately 8.5 hours). The PSF model used is a Gaussian with FWHM of 06 at 18m (typical of 18m observations presented here) and 072 at 25m (taken from Telesco et al. 2005). The point source sensitivity follows from the detection levels found in the 05 apertures at 18m and is 1.8mJy in 2 hours on source; extrapolation to 25m (sensitivity 4.8mJy in 2 hours) assumes a factor of 8/3 brightness increase needed for a source to achieve the same signal-to-noise in the Qb filter (25m) of TReCS as in the Qa filter (18m), as outlined on the Gemini website. The detection limits for extended disc emission were determined in the same way as the extension limits for the observations presented in this paper. Models of disc+star emission (with disc geometries and disc flux as described in section 3.3) convolved with the model PSF were treated as model images, and subjected to extension testing. Point-source subtracted model images were tested for significant residual emission in optimal testing regions as described in Smith et al. (2008). Emission above 3 significance was regarded as a detection of extended disc structure. The resulting limits (Figure 5, top line) show that the best targets for resolved disc imaging campaigns are those that have already been resolved (as for Figures 1-4, the region above the lines represents the disc parameter space that would result in a significant detection of extension according to the method outlined in section 3.3 and in detail in Smith et al. 2008). This plot was used to identify Tel, whose excess was independently confirmed in the TIMMI2 data presented here, as a prime target for 8m resolution. The resulting observations presented in Smith et al. (2009a) resolved the outer disc component and highlight the utility of this technique. Of the known A star debris discs population few sources remain that could be resolved in reasonable observing times with current instruments at 18m (those most amenable to resolved imaging are HD19356, HD139006 and HD102647 from current predictions of the disc parameters). More discs could be resolved at 25m, although conditions suitable for 25m observing are more rare.
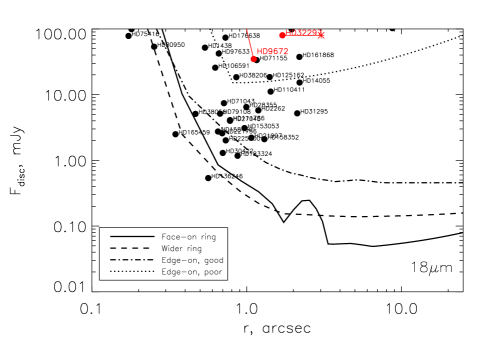
5.2 MIRI on the JWST
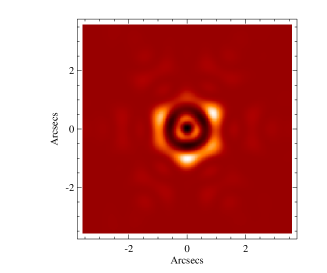
The James Webb Space Telescope is due to be launched in 2013. MIRI, the mid-infrared instrument, will provide vastly greater sensitivity to debris discs in the 5–27m spectral range. Since the primary mirror of the JWST consists of 18 hexagonal segments with the combined collecting area of 25m2 (similar to a 6m circular primary), the shape of the mirror segments is reflected in the shape of the expected PSF. Thus the PSF was taken from the JWPSF tool for an A5 type star (tool at http://www.stsci.edu/jwst/software/, see Figure 6 for PSF). Noise from possible PSF uncertainty was calculated as the differences in residual flux emission found when using different PSF models as determined using the different OPD files available (files represent modelled mirror misalignment and aberrations). We also tested PSF models based on A0 type stars and found no significant difference in the limits achievable. The optimal regions for testing for extension as described in Smith et al. (2008) and used to determine the extension limits on sources in this paper (see section 3.3) were modified to exclude pixels close where differences in the PSF model from different OPD files were high (50% the level of the signal of the PSF model in a pixel). The point source sensitivities were assumed to be 0.7Jy at 10m, 4.3Jy at 18m and 28Jy at 25m (10 in 10,000s) following the guidelines on the JWST webpages (http://www.stsci.edu/jwst/science/sensitivity/). These sensitivities were converted to 1 hour’s on-source integration by assuming that signal-to-noise varies as . Overheads have not been included in this calculation.
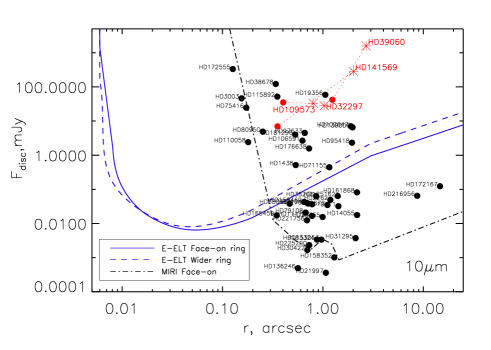
The resulting limits on resolved disc parameter space are shown in Figure 5, middle panel and bottom left for face-on discs at 10m. The increase in sensitivity over current ground-based imaging is clear from the low levels of disc flux for which detection of extended emission is possible in only 1 hours observing. Almost 100% of the A star discs detected at 24 and 70m should be resolvable with MIRI, although the resolution of the discs close to the inner radius limit will strongly depend on accurate PSF calibration (and of course the caveats relating to disc flux / radius predictions from SED fitting must be considered). The resolution of edge-on discs is a strong function of position angle as the PSF is not circularly symmetric. Discs which lie along the direction of the corners of the hexagonal shape (see Figure 6) are more difficult to detect in residual emission as these regions see more noise resulting from mirror misalignment and aberrations; observing at different position angles could mitigate against this issue. The ’bump’ in the detectability limits for face-on ring models also arises from the hexagonal feature of the PSF. Wider rings and discs lying edge-on are less strongly effected by this as their detection depends on less confined radial locations. A four quadrant phase-mask (4QPM) coronagraph will be offered at 3 wavelengths; 10.65, 11.4 and 15.5m (wavelengths optimised for planet detection, Boccaletti et al. 2005). We approximate the effect of including a 4QPM at 10m (bottom panel, Figure 5) by increasing the sensitivity of the observations by a factor of 250 at 0.3/D and 50 at 5/D, falling to a factor of 1 at 10/D (where D is 6.5m). These values are based on Figure 8 of Boccaletti et al. (2005). Including these sensitivity improvements allows the detection of discs of flux down to a limit of 9Jy if the disc is at the optimal detection radius (144, minimum of dot-dashed line in Figure 5 bottom panel). Without the coronograph the minimum disc flux required for the detection of extended emission is 0.013mJy. A Lyot mask optimised at 23m will also be provided, and will be used primarily for the detection of cold circumstellar discs. However, due to the large opaque mask of the Lyot objects at 1″cannot be detected with the Lyot (Boccaletti et al., 2005). As we can explore within this radius with our PSF subtraction method we do not include the effects of a coronagraph in our predictions at longer wavelengths (middle panel, Figure 5).
5.3 METIS on the E-ELT
The European Extremely Large Telescope (E-ELT) is currently planned to have a 42m dish and to start operation in 2018. In the mid-infrared the current proposed first generation instrument is METIS, which will cover the 3-13m range (although formerly Q band was proposed for this instrument, Brandl et al. 2008). We scale our PSF models from 8m instrumentation to a 42m dish giving a FWHM of 006 at 10m. The sensitivity for imaging was assumed to be 8Jy in 1 hour on source (10) as taken from the METIS webpages (http://www.strw.leidenuniv.nl/metis/). To approximate the effect of the inclusion of a coronagraph we assumed that the sensitivity would be improved by a factor of 10 at our hard limit of disc detectability (0006 where we adopted a PSF variation of FWHM which is typical of the level of variation we see in our 8m imaging data). This factor was taken from the increase in sensitivity predicted for planet detection when including a four quadrant phase mask on top of PSF subtraction as given in Brandl et al. (2008). For larger radii we assumed the sensitivity improvement would decrease linearly with radius to a fixed level of 1 at 05 (8 times the FWHM of the assumed PSF). This model is highly over-simplified and does not take into account many issues such as how sensitivity improvements may differ from point source predictions for extended emission . We note that work currently being undertaken by Eric Pantin and collaborators to determine the sensitivity of METIS to disc and planet detection will adopt much more realistic PSF and coronagraph models.
The predictions for resolvable disc parameter space with METIS at 10m are shown in Figure 5 bottom left. The comparison with MIRI on the JWST is representative of the different strengths of ground-based and space-bourne instrumentation. Larger discs with lower surface brightness will be ideal targets for MIRI observations, but a large dish like the E-ELT will be needed to resolve very small discs (03), or indeed structure within larger discs. Although the A star disc sample shown on this plot does not fill much of the small scale region, this is because discs detected at 24 and 70m are cool and thus at large radii. The inner components of multiple dust population discs or dust at 10m around Sun-like stars will live in these small spatial regions (see earlier discussion). This 10m disc population is poorly known as studies of these discs have been limited by calibration accuracy (specifically we cannot detect discs by classical aperture photometry fainter than the level of accuracy with which we know the stellar emission at this wavelength, which is typically 10% of , although interferometric techniques can allow this limit to be surpassed).
METIS on the E-ELT would enable the discovery of disc populations which cannot be detected photometrically (see above) through the detection of extended emission at 10m. At the optimal detection radius (005) METIS should be able to detect extended discs at the level of 6Jy. We can compare this value to the flux expected for an exozodiacal cloud around nearby stars. If a star has 1 zodi of emission between 0-3AU with constant optical depth then it is most likely to be resolved in observations with METIS at 005. We therefore calculate the detectability of exozodiacal emission by assuming this is equivalent to the detectability of a ring at the optimal radius. Taking the optical depth of the zodiacal cloud, (Dermott et al., 2002a), and assuming a ring of width gives a fractional luminosity of . If we consider a sunlike star at 10pc, the optimal detection radius would be centered at AU. Adopting the blackbody temperature for this dust (, see section 4.1) then the observed flux from exo-zodiacal dust should be 10Jy at 10m (using equation 6 of Wyatt 2008: where is the Planck function, is the wavelength of observation assumed here to be 10m and is the distance to the star here assumed to be 10pc) with higher flux for closer stars. Thus we could expect to resolve discs down to 1 zodi out to 10pc. This result is consistent with the previous expectations of the performance of METIS (as discussed in section 2.3.3 of Brandl et al. 2008, METIS is expected to be able to resolve the exozodiacal emission in the 1AU region around stars at 10pc.) We will also be able to resolve details of the strucutre of the few bright discs already known at 10m, such as those around HD69830 and Corvi (K0V and F2V) which are believed to have dust in the terrestrial planet regions (1AU, Smith et al. 2009b).
6 Discussion
This sample contains 7 sources with excess infrared emission confirmed either in this paper or with Spitzer data (Rieke et al., 2005; Chen et al., 2006), and a further 3 sources with excess emission in IRAS requiring confirmation. The SED fitting indicates that these objects are surrounded by dust at a distance of between 2-60 AU (or alternatively two temperatures of dust at 2 and 61AU for HD71155 and 4 and 24 AU for Tel). These regions are those in which we might expect the formation of giant planets, and so it is important consider how the existence of this dust emitting in the mid-infrared adds to our current understanding of dust distributions in circumstellar regions.
Rieke et al. (2005) looked at a sample of 266 A-type stars between 5-626 Myr old with MIPS at 24 and 70m and examined the relationship between fractional excess and the age of the central star. They found that the upper limit of excess emission generally fell off as for the stars with detected excess. Assuming the fits to the SED profiles presented in this paper and plotting the predicted 24m excess emission compared to stellar flux versus age it is clear that the results presented here are in-line with this relationship (Figure 7). Combining this with the age spread in sources suggests we have a representative sample of A star debris discs.

HD71155 and Tel, the two systems with resolved dust populations, have both been found to have multiple disc components. Chen et al. (2009) summarised the debris systems which have, through SED fitting or resolved imaging, been identified as multiple component discs. Adding HD71155 to this sample brings the total number to 12 known “Solar System analogues” (as defined in Chen et al. 2009, systems with multiple component discs). The FEPS survey on Spitzer surveyed 328 solar-like stars finding 10% have 70m emission indicating the presence of cold debris, and of these 1/3 have SEDs that are best fit by multiple temperature excesses (Hillenbrand et al., 2008). From our sample of 10 debris disc sources (3 of which, Gem, HD23281 and HD141795, still require photometric confirmation), 2 are multi-component discs (20%; consistent with the 1/3 rate given our small sample size). These results are further evidence that multiple component or extended discs are common. The traditional view of debris discs is that of a ring of planetesimals residing outside any planetary system producing cold dust, analogous to the Edgeworth-Kuiper belt (EKB) in the Solar System. Multiple component discs could be seen as analogous to the Solar System, although of course the extrasolar discs detected to date are much brighter than the asteroid belt and EKB ( for detected extrasolar discs; asteroid and Edgeworth-Kuiper belts and respectively, Dermott et al. 2002b; Stern & Colwell 1997).
For sources with large amounts of emission from close to the star, the origin of the dust is uncertain. Wyatt et al. (2007a) presented a model based on the collisional evolution models of Dominik & Decin (2003) that predicted a maximum dust luminosity dependent on age for a disc at a given radius. This maximum brightness occurs when discs just reach collisional equilibrium, in which the size distribution of the planetesimals in a disc is fixed as mass is transferred down through a cascade of collisions to smaller and smaller sizes until they are removed by radiation pressure. Very massive discs process their mass very quickly and are therefore short-lived, whereas sparse discs take a long time to reach collisional equilibrium but are not very luminous. This model has been shown to accurately recreate the A star debris disc population observed with Spitzer (Rieke et al., 2005) under assumptions of a distribution of initial disc mass, radius, and current age (Wyatt et al., 2007b). The predicted maximum luminosity for each disc (or disc component) in this study is given in Table 3 ( from equation 20 in Wyatt et al. 2007b where is the radius of the dust belt from our fits and is the age of the system as given in Table 1) . Uncertainties in the model parameters mean that only if do we take this as evidence of transient emission (level of excess cannot be produced by a collisional cascade). Most of our targets have , with Gem and the inner disc of HD71155 exceeding this value, and HD141795 having . Of these possibly transient sources only HD71155 has confirmed excess emission (see Section 4.2), and confirmation of the other discs would be required before speculating on their origin.
At an offset of 2AU around HD71155 the collisional lifetime of bodies is short and thus we interpret the emission as evidence for a transient dust producing event. A recent massive collision in an otherwise quiescent disc could produce a short lived increase in excess, although as such events are likely to be rare (and the resulting dust grains have short lifetimes) the probability of witnessing such an event is low (see discussion in Wyatt et al. 2007a). At an age of 169Myr (Table 1), ongoing terrestrial planet formation could be responsible for the emission (Kenyon & Bromley, 2004b), with collisions between planetary embryos resulting in large amounts of dust production. The cooler belt at 61AU could represent a parent population of the hot dust emission as well as producing spatially coincident dust dominating the excess at longer wavelengths (a similar possibility exists for the older Sun-like star Corvi, Smith et al. 2008, 2009b). However, the transport mechanism to get the dust to 2AU is unknown. A dynamical instability like that thought to have caused the Late Heavy Bombardment (LHB) in the Solar System (triggered by the migration of Jupiter/Saturn, see e.g. Gomes et al., 2005; Levison et al., 2008), during which large amounts of debris from the EKB was thrown into the inner Solar System, could be responsible. Booth et al. (2009) concluded that such an event occured around at most 12% of Sun-like stars. Around A stars, where the 70m excess has been shown to exhibit a fall-off proportional to time like the 24m emission (albeit with a longer decay time, Su et al., 2006), the statistics are less clear. Resolving the outer disc component would allow further examination of a possible link between the two populations (for example, emission spread inwards towards the hot dust population rather than confined to a narrow could be evidence for a link). A further possibility is that the emission arises from dust grains not produced in collisions but in the sublimation of a population of comets or one Super-comet. These possibilities were explored as the origin of the hot dust population around HD69830 by Beichman et al. (2005), who concluded that the continuous generation of small grains by a population of comets would require too large a mass reservoir to be the likely origin of the dust. A single massive comet (Sedna-sized in the case of HD69830) could release small dust grains over a few Myr if captured into a close orbit Beichman et al. (2005). This mechanism could be responsible for the 24m dust population in more systems.
Dust emission that is from a transient event will necessarily show temporal variation. The difference between the IRAS photometry on HD3003 and the measurements taken with MIPS and those presented in this paper (see section 4.1) could be evidence of such evolution. If real, this variance could be a reflection of the binary nature of the system, with the orientation of the secondary as it proceeds on its orbit changing the overall illumination of the system. A determination of the orbit of the binary will allow this possibility to be checked. Alternatively, if the temporal variance reflects changing levels of dust or changing dust distributions then a transient origin is more likely. Taking the assumed circumstellar radius of 4AU for the dust (see section 4.1) , a high level but one at which we would not state the emission must be transient conclusively (see above and detailed discussion of uncertainties in Wyatt et al. 2007a). However, if the dust is of transient origin, the dust location needs not be stable, and the constraint of 14.4AU for the binary semi-major axis need not hold. In this situation the determination of the orbit of the binary could again greatly improve our understanding of this system. Alternatively resolving the dust distribution (as would be possible with METIS on the E-ELT, see Figure 5) could also inform our models of the stability of the system, and thus the likely origin of the dust.
Of the sources considered in this paper only Tel and HD71155 have had the location of the dust population confirmed by resolved imaging. For the remaining discs constraints have been placed on the dust location, but degeneracies in the SED fitting in particular (summarised in Section 5) mean that resolved imaging is required to determine the true dust distributions in these systems, and so constrain models for the dust origin particularly where transience is inferred. The predictions in section 5 can be used to target sources most likely to be resolved with currently available instruments, but as shown in Figure 5 most currently known disc targets will require the use of MIRI to detect faint levels of extended emission or the high resolution of METIS on the E-ELT to resolve emission on small scales. High resolution will also be important for the detection of sub-structure in the discs which could indicate the presence of planets which will be important for ascertaining the nature of these systems and distinguishing between models for the origin of the dust. Evidence for planets in the dust distribution of debris disc systems include: sharp disc edges (as seen around Fomalhaut, Kalas et al. 2005); clumps (Vega, Wyatt 2003; similar structure may be observable in the EKB because of Neptune’s resonant Plutino population if the disc were brighter); warps ( Pic, Augereau et al. 2001); and asymmetries (HR4796A, Wyatt et al. 1999).
7 Summary
In this paper we have presented new observations of 11 early-type stars which have been proposed to be debris disc hosts based on their IRAS photometry. We have used TIMMI2, VISIR, Michelle and TReCS data to confirm excess emission and/or place constraints on debris discs for the observed sample. Our results are:
-
•
For HD 3003, HD80950, and Tel our photometry yields an independent confirmation of excess emission around the target. Subsequent analysis of the HD3003 system indicates that if the dust lies in a stable region it must be circumstellar and the binary must orbit at a semi-major axis of 14.4AU (assuming blackbody grains).
-
•
Our data on 5 targets allow us to place quantitative limits on the location and level of emission of any dust in the system. For HD71155 these limits allow us to determine that the disc must have multiple components.
-
•
We use simple disc models to determine the region of disc flux versus radius parameter space for which discs can be resolved with currently available 8m mid-IR instruments. This technique successfully identified Tel as a resolvable disc, which was confirmed with TReCS (Smith et al., 2009a).
-
•
We predict the parameter space of resolvable discs that could be opened by future instruments MIRI on the JWST and METIS on the E-ELT. Spatially extended disc structures will be best observed with MIRI because of their lower levels of surface brightness, whereas discs close to their central star (within 03), or those with structure on small spatial scales, will be prime targets for E-ELT imaging which would be able to detect emission below 1 zodi out to 10pc.
Acknowledgements.
RS is grateful for the support of a Royal Commission for the Exhibition of 1851 Fellowship. Based on observations made with ESO Telescopes at the La Silla and Paranal Observatories under programme IDs 71.C-0312, 72.C-0041 and 74.C-0700. Also based on observations obtained at the Gemini Observatory, which is operated by the Association of Universities for Research in Astronomy, Inc., under a cooperative agreement with the NSF on behalf of the Gemini partnership: the National Science Foundation (United States), the Particle Physics and Astronomy Research Council (United Kingdom), the National Research Council (Canada), CONICYT (Chile), the Australian Research Council (Australia), CNPq (Brazil) and CONICET (Argentina).References
- Absil et al. (2006) Absil, O., di Folco, E., Mérand, A., et al. 2006, A&A, 452, 237
- Absil et al. (2009) Absil, O., Mennesson, B., Le Bouquin, J., et al. 2009, ApJ, 704, 150
- Augereau et al. (2001) Augereau, J. C., Nelson, R. P., Lagrange, A. M., Papaloizou, J. C. B., & Mouillet, D. 2001, A&A, 370, 447
- Backman & Paresce (1993) Backman, D. E. & Paresce, F. 1993, in Protostars and Planets III, ed. E. H. Levy & J. I. Lunine ((Tucson: University of Arizona Press)), 1253–1304
- Beichman et al. (2005) Beichman, C. A., Bryden, G., Gautier, T. N., et al. 2005, ApJ, 626, 1061
- Boccaletti et al. (2009) Boccaletti, A., Augereau, J.-C., Baudoz, P., Pantin, E., & Lagrange, A.-M. 2009, A&A, 495, 523
- Boccaletti et al. (2005) Boccaletti, A., Baudoz, P., Baudrand, J., Reess, J. M., & Rouan, D. 2005, Advances in Space Research, 36, 1099
- Booth et al. (2009) Booth, M., Wyatt, M. C., Morbidelli, A., Moro-Martín, A., & Levison, H. F. 2009, ArXiv e-prints
- Brandl et al. (2008) Brandl, B. R., Lenzen, R., Pantin, E., et al. 2008, in Society of Photo-Optical Instrumentation Engineers (SPIE) Conference Series, Vol. 7014, Society of Photo-Optical Instrumentation Engineers (SPIE) Conference Series
- Cederblad (1946) Cederblad, S. 1946, Meddelanden fran Lunds Astronomiska Observatorium Serie II, 119, 1
- Chen et al. (2006) Chen, C. H., Sargent, B. A., Bohac, C., et al. 2006, ApJS, 166, 351
- Chen et al. (2009) Chen, C. H., Sheehan, P., Watson, D. M., Manoj Puravankara, P., & Najita, J. R. 2009, ArXiv e-prints
- Cheng et al. (1992) Cheng, K.-P., Bruhweiler, F. C., Kondo, Y., & Grady, C. A. 1992, ApJ, 396, L83
- Cohen et al. (1999) Cohen, M., Walker, R. G., Carter, B., et al. 1999, AJ, 117, 1864
- Coté (1987) Coté, J. 1987, A&A, 181, 77
- Currie et al. (2008) Currie, T., Kenyon, S. J., Balog, Z., et al. 2008, ApJ, 672, 558
- Dermott et al. (2002a) Dermott, S. F., Durda, D. D., Grogan, K., & Kehoe, T. J. J. 2002a, Asteroids III, 423
- Dermott et al. (2002b) Dermott, S. F., Kehoe, T. J. J., Durda, D. D., Grogan, K., & Nesvorný, D. 2002b, in ESA Special Publication, Vol. 500, Asteroids, Comets, and Meteors: ACM 2002, ed. B. Warmbein, 319–322
- di Folco et al. (2007) di Folco, E., Absil, O., Augereau, J.-C., et al. 2007, A&A, 475, 243
- Dominik & Decin (2003) Dominik, C. & Decin, G. 2003, ApJ, 598, 626
- Dommanget & Nys (1994) Dommanget, J. & Nys, O. 1994, Communications de l’Observatoire Royal de Belgique, 115, 1
- Dunham (1977) Dunham, D. W. 1977, Occultation Newsl., Vol. 1, p. 119 - 120, 1, 119
- Fisher et al. (2000) Fisher, R. S., Telesco, C. M., Piña, R. K., Knacke, R. F., & Wyatt, M. C. 2000, ApJ, 532, L141
- Fitzgerald et al. (2007) Fitzgerald, M. P., Kalas, P. G., & Graham, J. R. 2007, ApJ, 670, 557
- Gáspár et al. (2008) Gáspár, A., Su, K. Y. L., Rieke, G. H., et al. 2008, ApJ, 672, 974
- Gomes et al. (2005) Gomes, R., Levison, H. F., Tsiganis, K., & Morbidelli, A. 2005, Nature, 435, 466
- Gorlova et al. (2006) Gorlova, N., Rieke, G. H., Muzerolle, J., et al. 2006, ApJ, 649, 1028
- Greaves et al. (1998) Greaves, J. S., Holland, W. S., Moriarty-Schieven, G., et al. 1998, ApJ, 506, L133
- Greaves et al. (2005) Greaves, J. S., Holland, W. S., Wyatt, M. C., et al. 2005, ApJ, 619, L187
- Hauck & Mermilliod (1998) Hauck, B. & Mermilliod, M. 1998, A&AS, 129, 431
- Hillenbrand et al. (2008) Hillenbrand, L. A., Carpenter, J. M., Kim, J. S., et al. 2008, ApJ, 677, 630
- Høg et al. (2000) Høg, E., Fabricius, C., Makarov, V. V., et al. 2000, A&A, 355, L27
- Holland et al. (1998) Holland, W. S., Greaves, J. S., Zuckerman, B., et al. 1998, Nature, 392, 788
- Holman & Wiegert (1999) Holman, M. J. & Wiegert, P. A. 1999, AJ, 117, 621
- Jura et al. (2004) Jura, M., Chen, C. H., Furlan, E., et al. 2004, ApJS, 154, 453
- Kalas et al. (2007) Kalas, P., Duchene, G., Fitzgerald, M. P., & Graham, J. R. 2007, ApJ, 671, L161
- Kalas et al. (2002) Kalas, P., Graham, J. R., Beckwith, S. V. W., Jewitt, D. C., & Lloyd, J. P. 2002, ApJ, 567, 999
- Kalas et al. (2005) Kalas, P., Graham, J. R., & Clampin, M. 2005, Nature, 435, 1067
- Kenyon & Bromley (2004a) Kenyon, S. J. & Bromley, B. C. 2004a, AJ, 127, 513
- Kenyon & Bromley (2004b) Kenyon, S. J. & Bromley, B. C. 2004b, ApJ, 602, L133
- Kunzli & North (1998) Kunzli, M. & North, P. 1998, A&A, 330, 651
- Kurucz (1979) Kurucz, R. L. 1979, ApJS, 40, 1
- Lagage & Pantin (1994) Lagage, P. O. & Pantin, E. 1994, Nature, 369, 628
- Levison et al. (2008) Levison, H. F., Morbidelli, A., Vanlaerhoven, C., Gomes, R., & Tsiganis, K. 2008, Icarus, 196, 258
- Lisse et al. (2002) Lisse, C., Schultz, A., Fernandez, Y., et al. 2002, ApJ, 570, 779
- Lisse et al. (2009) Lisse, C. M., Chen, C. H., Wyatt, M. C., et al. 2009, ArXiv e-prints
- Löhne et al. (2008) Löhne, T., Krivov, A. V., & Rodmann, J. 2008, ApJ, 673, 1123
- Mannings & Barlow (1998) Mannings, V. & Barlow, M. J. 1998, ApJ, 497, 330
- Martínez-Galarza et al. (2009) Martínez-Galarza, J. R., Kamp, I., Su, K. Y. L., et al. 2009, ApJ, 694, 165
- Mason et al. (2001) Mason, B. D., Wycoff, G. L., Hartkopf, W. I., Douglass, G. G., & Worley, C. E. 2001, AJ, 122, 3466
- Moerchen et al. (2007a) Moerchen, M. M., Telesco, C. M., De Buizer, J. M., Packham, C., & Radomski, J. T. 2007a, ApJ, 666, L109
- Moerchen et al. (2009) Moerchen, M. M., Telesco, C. M., & Packham, C. 2009, ApJ, submitted
- Moerchen et al. (2007b) Moerchen, M. M., Telesco, C. M., Packham, C., & Kehoe, T. J. J. 2007b, ApJ, 655, L109
- Moon & Dworetsky (1985) Moon, T. T. & Dworetsky, M. M. 1985, MNRAS, 217, 305
- Moór et al. (2006) Moór, A., Ábrahám, P., Derekas, A., et al. 2006, ApJ, 644, 525
- Morales et al. (2009) Morales, F. Y., Werner, M. W., Bryden, G., et al. 2009, ApJ, 699, 1067
- Oudmaijer et al. (1992) Oudmaijer, R. D., van der Veen, W. E. C. J., Waters, L. B. F. M., et al. 1992, A&AS, 96, 625
- Peterson et al. (2006) Peterson, D. M., Hummel, C. A., Pauls, T. A., et al. 2006, Nature, 440, 896
- Rhee et al. (2007) Rhee, J. H., Song, I., Zuckerman, B., & McElwain, M. 2007, ApJ, 660, 1556
- Richichi et al. (1999) Richichi, A., Ragland, S., Calamai, G., et al. 1999, A&A, 350, 491
- Rieke et al. (2005) Rieke, G. H., Su, K. Y. L., Stansberry, J. A., et al. 2005, ApJ, 620, 1010
- Sadakane & Nishida (1986) Sadakane, K. & Nishida, M. 1986, PASP, 98, 685
- Schneider et al. (2006) Schneider, G., Silverstone, M. D., Hines, D. C., et al. 2006, ApJ, 650, 414
- Schneider et al. (2009) Schneider, G., Weinberger, A. J., Becklin, E. E., Debes, J. H., & Smith, B. A. 2009, AJ, 137, 53
- Sheret et al. (2004) Sheret, I., Dent, W. R. F., & Wyatt, M. C. 2004, MNRAS, 348, 1282
- Shylaja & Ashok (2002) Shylaja, B. S. & Ashok, N. M. 2002, Bulletin of the Astronomical Society of India, 30, 491
- Skrutskie et al. (2006) Skrutskie, M. F., Cutri, R. M., Stiening, R., et al. 2006, AJ, 131, 1163
- Smith et al. (2006) Smith, P. S., Hines, D. C., Low, F. J., et al. 2006, ApJ, 644, L125
- Smith et al. (2009a) Smith, R., Churcher, L. J., Wyatt, M. C., Moerchen, M. M., & Telesco, C. M. 2009a, A&A, 493, 299
- Smith et al. (2008) Smith, R., Wyatt, M. C., & Dent, W. R. F. 2008, A&A, 485, 897
- Smith et al. (2009b) Smith, R., Wyatt, M. C., & Haniff, C. A. 2009b, ArXiv e-prints
- Song et al. (2001) Song, I., Caillault, J.-P., Barrado y Navascués, D., & Stauffer, J. R. 2001, ApJ, 546, 352
- Song et al. (2002) Song, I., Weinberger, A. J., Becklin, E. E., Zuckerman, B., & Chen, C. 2002, AJ, 124, 514
- Stapelfeldt et al. (2004) Stapelfeldt, K. R., Holmes, E. K., Chen, C., et al. 2004, ApJS, 154, 458
- Stern & Colwell (1997) Stern, S. A. & Colwell, J. E. 1997, AJ, 114, 841
- Su et al. (2005) Su, K. Y. L., Rieke, G. H., Misselt, K. A., et al. 2005, ApJ, 628, 487
- Su et al. (2006) Su, K. Y. L., Rieke, G. H., Stansberry, J. A., et al. 2006, ApJ, 653, 675
- Sylvester & Mannings (2000) Sylvester, R. J. & Mannings, V. 2000, MNRAS, 313, 73
- Telesco et al. (2000) Telesco, C. M., Fisher, R. S., Piña, R. K., et al. 2000, ApJ, 530, 329
- Telesco et al. (2005) Telesco, C. M., Fisher, R. S., Wyatt, M. C., et al. 2005, Nature, 433, 133
- Trilling et al. (2007) Trilling, D. E., Stansberry, J. A., Stapelfeldt, K. R., et al. 2007, ApJ, 658, 1289
- Wahhaj et al. (2007) Wahhaj, Z., Koerner, D. W., & Sargent, A. I. 2007, ApJ, 661, 368
- Wyatt (2003) Wyatt, M. C. 2003, ApJ, 598, 1321
- Wyatt (2005) Wyatt, M. C. 2005, A&A, 433, 1007
- Wyatt (2008) Wyatt, M. C. 2008, ARA&A, 46, 339
- Wyatt & Dent (2002) Wyatt, M. C. & Dent, W. R. F. 2002, MNRAS, 334, 589
- Wyatt et al. (1999) Wyatt, M. C., Dermott, S. F., Telesco, C. M., et al. 1999, ApJ, 527, 918
- Wyatt et al. (2007a) Wyatt, M. C., Smith, R., Greaves, J. S., et al. 2007a, ApJ, 658, 569
- Wyatt et al. (2007b) Wyatt, M. C., Smith, R., Su, K. Y. L., et al. 2007b, ApJ, 663, 365
- Zuckerman (2001) Zuckerman, B. 2001, ARA&A, 39, 549
- Zuckerman et al. (2001) Zuckerman, B., Song, I., Bessell, M. S., & Webb, R. A. 2001, ApJ, 562, L87
Appendix A Additional sources
A.1 Observed sources with no new limits


HD 31295: HD 31295 was first identified by Sadakane & Nishida (1986) in their sample of Vega-excess stars as a star with infrared excess identified in the IRAS PSC (significant at 25m, see Table 1). TIMMI2 N band observations do not confirm the excess (Table 2). Results of Spitzer observations (Jura et al. 2004; Su et al. 2006) place a limit of 70mJy excess at 8.5m, and the IRS spectrum shows no evidence of excess at 20 m. Further results presented in Su et al. (2006) showed that in MIPS 24 and 70m photometry the excess was confirmed. We find no evidence of background/companion sources in the TIMMI2 field-of-view (such objects limited to 33mJy).
We fit the confirmed excesses with a blackbody at 80K (similar to the Chen et al. fit of 90K, our errors are 12K from errors on the excess detections), which translates to a radial offset of 52.6AU (14, see Figure 8 for SED). The image shows no evidence for extension. The disc flux expected in the observed TIMMI2 filter from the SED fit is 1mJy; longer wavelength observations would be required to resolve/limit the disc extension around this source. Martínez-Galarza et al. (2009) explored the possibility that this Bootis star could be interacting with the ISM, and found that such interaction could produce the observed excess. With the current data it is not possible to distinguish between this theory and that of a circumstellar disc, although the fact that this star lies within the local bubble (at 37pc, see Table 1) means that the probability of the star lying within a cloud which could produce the observed emission is low (Martínez-Galarza et al. 2009).
HD 38206: HD 38206 was first identified as a host of mid-infrared excess by Mannings & Barlow (1998) in their analysis of the IRAS catalogues. The TIMMI2 photometry presented here does not confirm the excess (Table 2). Recent MIPS observations of this star (Rieke et al. 2005) have confirmed the 24 m excess, with flux of 115 12 mJy (expected photospheric flux 333 mJy, good agreement with the IRAS measurements, see Table 1). Su et al. (2006) list the MIPS 24m photometry as 107mJy at 24m and 342mJy at 70m (errors of 1.58mJy and 12.87mJy respectively do not include calibration errors which are less than 5% at 24m and 10% at 70m). The excess emission is fitted with a blackbody at 9010K (translating to a radial offset of 48.4 AU, 070, see Figure 8 right and Table 3). This fit suggests the disc flux at the wavelength observed with TIMMI2 is 1mJy; as for HD 31295, only longer wavelength high resolution imaging will be able to constrain or potentially resolve this disc’s location and geometry.
A.2 Not a debris disc candidate

HD 23432: HD 23432 (asterope) was identified by Oudmaijer et al. (1992) as being amongst a sample of SAO stars with IRAS infrared excess. This star has an excess of 256 43 mJy at 12 m and 1159 42 mJy at 25 m (after subtraction of the photosphere). In addition it also has excess at longer wavelengths: 6533 780 mJy at 60 m; and 13078 4979 mJy at 100m.
The excess emission is not confirmed in the TIMMI2 observations of HD 23432, as a flux of 141 62 mJy at 11.6 m is found compared to an expected stellar flux of 1367 mJy from a Kurucz profile fit (see Table 2). The TIMMI2 data points plotted on the SED (Figure 9) are shown with the calibration limits taken from the standards immediately before and after the science observation. The overall photometric errors are much higher, with a change of calibration factor over the course of the night of around 30%. Optical observations of this Pleiades member show it to lie close to a diffuse reflection nebula Ced 19h Cederblad (1946). The shape of the excess emission spectrum (fit here with blackbody emission at 20030K, 8025K, and 283K, where errors on the temperatures arise from fitting the excess emission within 3) suggests that this is the result of the emission from the reflection nebula and not from a dust population centred on the star itself. Gorlova et al. (2006) found that the Spitzer 24m observations of this source were contaminated by flux from the reflection nebula. Similar interactions with interstellar dust have been shown to be responsible for excess emission towards other stars (Kalas et al. 2002; Gáspár et al. 2008).