Defining Contact at the Atomic Scale
Abstract
Molecular dynamics simulations are used to study different definitions of contact at the atomic scale. The roles of temperature, adhesive interactions and atomic structure are studied for simple geometries. An elastic, crystalline substrate contacts a rigid, atomically flat surface or a spherical tip. The rigid surface is formed from a commensurate or incommensurate crystal or an amorphous solid. Spherical tips are made by bending crystalline planes or removing material outside a sphere. In continuum theory the fraction of atomically flat surfaces that is in contact rises sharply from zero to unity when a load is applied. This simple behavior is surprisingly difficult to reproduce with atomic scale definitions of contact. Due to thermal fluctuations, the number of atoms making contact at any instant rises linearly with load over a wide range of loads. Pressures comparable to the ideal hardness are needed to achieve full contact at typical temperatures. A simple harmonic mean-field theory provides a quantitative description of this behavior and explains why the instantaneous forces on atoms have a universal exponential form. Contact areas are also obtained by counting the number of atoms with a time-averaged repulsive force. For adhesive interactions, the resulting area is nearly independent of temperature and averaging interval, but usually rises from zero to unity over a range of pressures that is comparable to the ideal hardness. The only exception is the case of two identical commensurate surfaces. For nonadhesive surfaces, the mean pressure is repulsive if there is any contact during the averaging interval . The associated area is very sensitive to and grows monotonically. Similar complications are encountered in defining contact areas for spherical tips. Even for the adhesive case, the area based on time-averaged forces can not be described by continuum theory.
pacs:
46.55.+d, 62.20.Qp, 81.40.PqI Introduction
The area of intimate contact between surfaces plays a central role in continuum models of friction and adhesion. Due to surface roughness, this real area of contact is typically much less than the apparent area of the surfaces . Analytic and numerical work indicates that rises linearly with load for nonadhesive surfaces, whether they deform elastically greenwood66 ; johnson85 ; persson01 ; hyun04 or plastically bowden86 ; gao05 ; pei05 . This linear relation, and the assumption of a constant shear stress, provides one of the most common explanations of the linear relation between friction and load in many experiments bowden86 .
The advent of nanotechnology and the ability to measure friction in contacts with molecular dimensions has led to great interest in extending continuum models to nanometer scales and identifying its limits carpick97 ; carpick97b ; enachescu98 ; carpick99 ; luan05 ; luan06 ; mo09 ; mo10 ; harrison99 ; robbins00c ; knippenberg08 ; brukman08 ; pearson09 ; chandross08 ; yang08 ; yang08b . One fundamental question is what contact means at the molecular scale. The mere presence of an interaction between surfaces is not enough, since attractive van der Waals interactions extend to arbitrary scales. One common approach has been to associate the onset of direct repulsion between atoms with contact luan05 ; luan06 ; mo09 ; mo10 ; knippenberg08 ; burnham91 ; luan09 ; cheng10pre . For most systems this coincides with common definitions of atomic diameters footrepulse , but the notion of contact is still complicated by thermal fluctuations and the finite range of interactions. These are not commonly included in continuum models and recent work reveals that they greatly complicate the extension of continuum views of contact to atomic scales.
Early experiments found that friction measurements could be fit by applying continuum theory to nanometer scale contacts and assuming a constant shear stress at the interface carpick97 ; carpick97b ; enachescu98 ; carpick99 ; schwarz03 . Simulations with tips of the same size showed that while friction forces could be fit in this way, the fit parameters were often significantly different than the independently determined material properties luan05 ; luan06 . The actual area of contact was often a factor of two larger than the continuum prediction, the contact stiffness was up to an order of magnitude smaller, and the friction force varied by two orders of magnitude with changes in atomic geometry by much less than an atomic diameter.
Knippenberg et al. knippenberg08 examined contact between atoms in sliding contacts between nanometer scale tips and a substrate covered with a surfactant. They found that the area of contact was broadened due to the compliance of the surfactant layer, but that most of the atoms contributed little to the normal and lateral (friction) forces. Roughly 90% of the force was carried by only 10% of the atoms, calling into question the binary nature of contact. Cheng et al. cheng10pre considered the effect of single monolayers of short chains. They also found very large variations in the force on individual atoms, both spatially and temporally. One consequence was that measures that included the magnitude of forces, such as moments of the pressure distribution, gave very different contact radii than simply counting the atoms feeling any nonzero repulsion.
Mo et al. have considered contact between a bare diamond substrate and an amorphous surface that is nominally spherical mo09 ; mo10 . They found that the number of contacting atoms grew linearly with the applied load. They concluded that their surfaces were sufficiently rough that the continuum results predicting area proportional to load could be applied. This idea was tested by comparing the distribution of the magnitude of local forces to Persson’s continuum theory persson01 .
Yang et al. yang08 ; yang08b have tested Persson’s theory by simulating contact between a flat substrate and a surface with roughness on all length scales. They found many more atoms with low forces than predicted. The area of contact was not obtained by counting atoms, but by fitting the distribution at larger forces. The result was then in reasonable agreement with Persson’s predictions. Luan et al. luan09 ; luan05mrs ; luan06a examined two dimensional models with much larger linear dimensions. They also found many atoms had low forces and that decreased monotonically with . The contact area obtained by counting atoms was extremely sensitive to the detailed atomic structure. One might not expect that continuum theory could capture these local details, but it did correctly capture the long-range stress correlations in the simulations luan09 ; campana08 ; hyun07 ; persson08c .
In this paper we explore the effect of thermal fluctuations on different definitions of contact. The simplest possible case, contact between atomically flat surfaces, is considered first. Even identical crystals with atoms directly over each other exhibit unexpected behavior. The number of atoms exhibiting repulsion at any instant rises linearly with load, as might be expected for rough surfaces in continuum theory. This linear scaling is observed for temperatures from to 1/4 of the melting temperature, . The contact area determined from time-averaged forces shows full contact for this geometry, but not for incommensurate crystals with different lattice constants or surfaces cut from amorphous solids.
A simple harmonic mean-field model for thermal fluctuations of individual surface atoms provides a quantitative description of the above results. It also explains several other new observations in our simulations. These include a nearly universal exponential distribution of the magnitude of instantaneous repulsive forces, and a corresponding universal distribution of the fraction of load carried by the atoms with the largest force. There is also a direct correlation between the fraction of time in contact and the time averaged force on an atom that is independent of surface structure. The force required for atoms to remain in contact more than half the time is surprisingly large at typical temperatures, with the corresponding pressure comparable to the ideal hardness.
The prototypical case of contact between a spherical tip and flat substrate is considered next. Different atomic geometries of the tip, including commensurate, incommensurate and amorphous are considered. The same harmonic model used for flat surfaces describes the time average force and fraction of time in contact for tip atoms. For nonadhesive tips, the contact area obtained by counting the number of atoms with a repulsive time-averaged force depends on the observation time and grows monotonically. Results for adhesive surfaces are less sensitive to time interval and temperature, but differ substantially from continuum theory.
The paper is organized as follows. In Sec. II we describe our simulation methods. Then MD results for the contact area between flat surfaces are described in Sec. III and a model for the distribution of contact forces is developed and tested. Section IV examines contact between a sphere and flat and discussions and conclusions are presented in Sec. V.
II Simulation Methods
In continuum theory, contact between two rough elastic solids can be mapped to that between a flat elastic substrate and a rigid rough upper solid johnson85 . We consider the latter case, and take the upper solid to be atomically flat or a spherical tip. Previous studies at zero temperature indicate that the continuum mapping remains approximately valid at atomic scales luan05 , but it does not take into account thermal effects. At any finite temperature, annealed roughness from thermal fluctuations will be superimposed on top of any quenched structural roughness on the surfaces. While the mapping may not accurately capture the quantitative effect of thermal fluctuations on both surfaces, using a rigid upper surface and a flat elastic substrate minimizes the parameter space to be explored. Preliminary results for two elastic solids show the same effects and trends are mentioned where relevant.
Atoms in the upper solid interact with those in the substrate via a truncated and shifted Lennard-Jones (LJ) potential allen87 :
| (1) |
where is the cutoff length, is the binding energy, and is the atomic diameter. We express all physical quantities in terms of LJ units based on , , and the mass of the substrate atoms. For example, the unit of time is . Where possible we plot dimensionless quantities in order to facilitate comparison with experiments and theoretical models.
To model a nonadhesive contact, we take so that the LJ potential is purely repulsive. For adhesive contact, we use and reduce the binding energy to to make adhesion between surfaces weaker than the internal cohesion in the substrate. This prevents the creation of cracks in the substrate under negative load (separating surfaces).
The substrate is a fcc crystal with a (001) surface. To make the substrate as elastic as possible, nearest neighbor atoms in the substrate interact through a harmonic potential:
| (2) |
where is a spring constant and is the equilibrium spacing between nearest neighbors. We take to match the position of the minimum in the LJ potential in Eq. 1. The spring constant also matches the second derivative of the LJ potential at its minimum. Rather than listing the specific bonded pairs, spring forces are calculated for all atoms that are within a distance of . This limits interactions to nearest neighbors, but does allow plastic deformation to occur when forces are extremely high. We limit our simulations to loads below this point.
The equilibrium density of the substrate at is . The initial state is a crystal of this density. Periodic boundary conditions with period are applied along the surface. The crystal is high along the direction and the bottom layer is held fixed to mimic the support that balances the external load. This depth is large enough to approximate contact of a sphere and a semi-infinite substrate luan06 ; adams06 . The substrate has the same fcc structure and periodic boundary conditions in all simulations. As the temperature changes from (called the low case) to (called the high case), the height of the substrate shrinks by about because of a slight anharmonicity induced by changes in orientations of the springs. This slight breaking of cubic symmetry does not affect our results cheng10pre .
We studied three atomic geometries for rigid flat surfaces. Two contain a single (001) plane of a fcc crystal with a lattice constant . One is a commensurate surface with . This surface is in perfect alignment with the substrate, with its atoms directly above the equilibrium positions of atoms in the top layer of the substrate. The second is an incommensurate surface with a lattice constant . The third surface has an amorphous structure. It is a thin sheet with thickness cut from an amorphous solid with density . The thickness was chosen to produce roughly the same number of surface atoms as the commensurate case.
The spherical tips have radius and four types of atomic geometries studied previously luan05 ; luan06 ; cheng10pre . The commensurate tip is made by bending a (001) plane of a fcc crystal with lattice constant into a spherical shape. The incommensurate tip is bent from a (111) plane of a fcc crystal with . The stepped tip is obtained by carving a spherical shell out of a commensurate fcc crystal with . The detailed structure of the stepped tip depends on realization and in our case the bottom layer is a (001) face with atoms. The amorphous tip is a spherical shell carved out of the same amorphous solid from which the flat amorphous surface is cut. Tips used in AFM experiments are likely to be closest in structure to the amorphous or stepped tips. The spherical tips and flat upper surfaces all have a finite thickness. This is irrelevant for simulations of nonadhesive contacts. For adhesive contacts, the finite thickness merely reduces the effective adhesion between two surfaces and does not affect the trends and conclusions presented below.
The simulations are performed using the Large-scale AtomicMolecular Massively Parallel Simulator (LAMMPS) developed at Sandia National Laboratories. This classical MD code utilizes spatial decomposition to parallelize the computations. Forces are calculated with the help of neighbor lists. A velocity-Verlet algorithm with a time step is used to integrate the equations of motion. The substrate is held at a fixed temperature using a Langevin thermostat. The Langevin damping rate is typically , but results reported here are not sensitive to up to at least .
To illustrate the role of temperature, we report results for and . In some cases, we also report results for . Note that the melting temperature of the substrates would be if LJ interactions with the same length and stiffness were used. Thus the three temperatures above correspond to roughly , , and . MD simulations ignore quantum effects that reduce thermal fluctuations. Simulations below 5 to 10% of are usually not representative of the behavior of real materials, but may be useful for illustrating trends.
In most simulations, a constant normal load is applied to the top surface and the system is allowed to equilibrate before data are collected. The time for stress equilibration is a small multiple of the time for sound to propagate across the system . We equilibrated the system for at least after each change in load, and data were typically averaged over a subsequent .
For contact between nominally flat surfaces, the natural dimensionless measure of load is , where is the nominal area of the contacting surfaces, is the mean pressure in the contact, and is the effective modulus. The latter is related to Young’s modulus and the Poisson ratio by and for our substrate cheng10pre . The ratio is approximately equal to the average strain along the direction far from the substrate. For contact with a tip of radius , the substrate dimensions are effectively infinite and the natural dimensionless measure of load is .
III Contact between nominally flat surfaces
III.1 Nonadhesive Contact Area
Molecular dynamics simulations provide complete information about forces and positions, but it is not obvious how this information should be used to identify the real area of contact. For nonadhesive contact, it is natural to say an atom is in contact when it feels a force from the opposing surface. This can be generalized to adhesive contact by saying atoms separated by less than some distance are in contact. In the following we use the same distance as for nonadhesive contact, so atoms are counted as contacting when the force between them is repulsive. This definition has also been used in discussing AFM experiments burnham91 , and previous simulations mo09 ; mo10 ; knippenberg08 ; brukman08 ; pearson09 ; cheng10pre ; luan06a ; harrison07 . One can define an area of real contact, , by multiplying the number of contacting atoms by the area per atom , i.e., . Thermal fluctuations introduce ambiguities in this definition because atoms fluctuate in and out of contact.
We first consider the case of nominally flat non-adhesive surfaces. From the continuum perspective one would expect that these surfaces should be in complete contact, , at any positive load. However surfaces constructed of discrete atoms can never be perfectly flat. Even when all the rigid atoms are at the same height, as for commensurate and incommensurate cases, the height at which substrate atoms feel a given force varies with lateral position. This corrugation depends on the relative size of substrate atoms and the normal force, but the peak-to-peak height change is of order for the cases considered here luan06 ; footBelidor . The change in height of atoms on the amorphous surface leads to additional roughness of the same order. Because the potential changes very rapidly with separation on these scales, the atomic scale corrugation of any surface can lead to large changes in contact properties even in the limit of zero temperature considered in Refs. luan05 ; luan06 .
Thermal fluctuations lead to additional time varying or annealed roughness on the surface. An estimate of the magnitude of local fluctuations can be obtained from the root mean squared (rms) normal displacement of a surface atom if its eight neighbors are held fixed:
| (3) |
where . As increases from to , this increases from about to . These values are similar to the measured height fluctuations discussed further below. One can estimate the period of normal vibrations in the same way: .
While is always smaller than the quenched surface corrugations described above, thermal fluctuations lead to time variation that significantly complicates the definition of contact. In particular, the number and identity of atoms that exert a force on the opposing surface varies with time. Some authors have associated with the mean number of contacting atoms at any instant in time mo09 ; mo10 ; knippenberg08 . However, continuum theories generally consider time-averaged forces and displacements. From this perspective it may be more natural to find the average force on surface atoms over a long time interval and identify all atoms with an average repulsion as in contact. One can interpolate between these limiting cases by defining , the mean area associated with atoms that exert a repulsive force over an averaging interval , where varies from a single time step to the length of the run cheng10pre . Note that this quantity does not measure any time evolution or aging of the contact, but rather the mean number of contacting atoms over a fixed time interval averaged over all starting times in a steady state simulation.
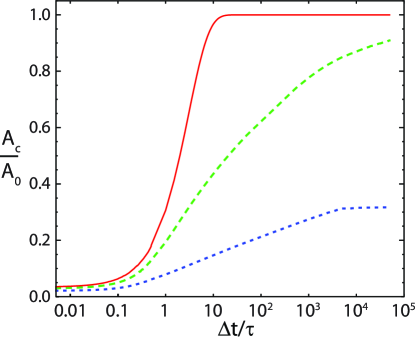
Fig. 1 shows for commensurate, incommensurate, and amorphous surfaces at and . In all cases, only a few percent of the substrate atoms contact the rigid surface at any instant of time. This percentage is nearly constant for much shorter than because atoms have not had time to move cheng10pre . Over longer averaging intervals, rises and appears to saturate. For the commensurate case, where all substrate atoms are directly under rigid atoms, saturates at full contact in a time of order . For the other surfaces there is a slow, roughly logarithmic, rise over three decades in time before appears to saturate. The final value from the average over the entire simulation () is over for the incommensurate surface, and only for the amorphous case.
The difference in the asymptotic values of reflects the atomic structure of the surfaces. The commensurate case is the closest to ideally flat since all substrate atoms are directly below rigid atoms and have the same mean spacing. As a result, all atoms are likely to contact within a time of order the vibrational time. The above estimate of was for short wavelength modes. While rises rapidly as the time interval becomes of this order, complete saturation does not occur until times of order the period of the slowest long wavelength modes of the system , where is the speed of acoustic waves.
For the incommensurate case, each substrate atom has a slightly different environment. Some are directly below rigid wall atoms, and some are centered in between wall atoms. As noted above, this changes the height needed to produce a given force by . This is larger than the estimated thermal height fluctuations, . However, as increases, more and more unlikely configurations will be sampled and the total number of atoms that come into contact will grow. In principle, all atoms should contact given an arbitrarily long time, but over the times accessible to simulations the fractional contact area grows roughly logarithmically and then appears to saturate. The situation for amorphous walls is similar, but the rougher surfaces lead to a smaller long time value.
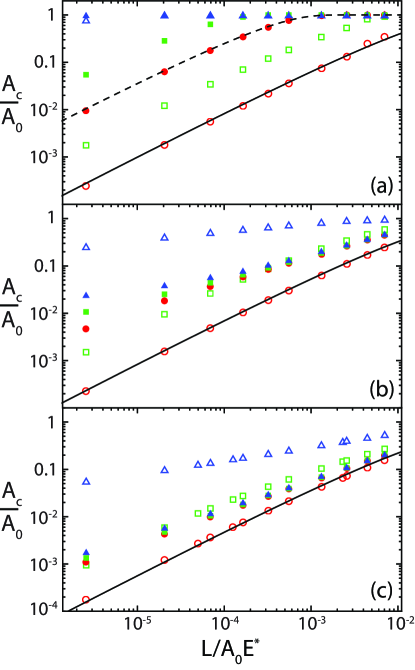
Results for other temperatures and loads show qualitatively similar behavior, but with different values of at early and late times. To illustrate trends with and , we will compare the mean results for atoms contacting over three time intervals: instantaneous , a time interval that is of order , and a time comparable to the entire simulation (ns). Fig. 2 shows results for commensurate, incommensurate and amorphous walls at two very different temperatures: (open symbols) and (closed symbols). The data are plotted on a log-log scale to capture the wide range of values. Note that averaging over even a single vibrational period of the atoms has a dramatic effect on , leading to an order of magnitude increase in many cases.
At small loads, all curves are nearly linear, implying that grows as a power of load. The lines show fits to a model developed in Section III.3 that predicts a nearly linear relation between area and load. Best fits to the data for at high are consistent with this, giving exponents a little greater than 0.9 over several decades. Quenched geometrical disorder becomes more important at low temperatures, leading to changes in the apparent power law exponent for the amorphous and incommensurate cases.
For the commensurate surface, the area rises roughly linearly with load for all temperatures and time intervals. However the curves shift up with increasing since more atoms have time to contact. There is a corresponding downward shift in the load needed to reach full contact. Over a time of 500 (ns), nearly all atoms contact even at the lowest load and highest temperature. This full contact is consistent with one’s expectations for perfectly flat surfaces in continuum theory.
Lowering the temperature increases the number of contacting atoms and lowers the load needed to achieve full contact. The rigid surface is held up by interactions with the highest substrate atoms, because the repulsion changes rapidly with separation. The roughness from thermal fluctuations grows with temperature as does the force from impacts at the thermal velocity. These effects lead to a decrease in with increasing at a fixed load that is captured by the model discussed below.
The incommensurate and amorphous surfaces show similar trends at high temperatures, except that saturates below unity on the time scale of our simulations. The saturation value is always lower for the rougher amorphous surface, but grows more rapidly with load. At low , the variation with time interval is much weaker, with changing less than a factor of 2 with at all loads for the amorphous case. The reason is that the quenched structural variations due to the incommensurate spacing or random atomic heights are large enough that some atoms are very unlikely to be brought into contact by thermal fluctuations at low . Those substrate atoms that are closest to rigid atoms make contact quickly and those farther away never contact.
It is interesting to compare the above results to a simple model motivated by contact between a solid wall and ideal gas with number density . When averaged over a long time, there is a uniform pressure on the wall from collisions with the gas. From the continuum perspective this implies that the entire solid surface is in contact with the gas. However at any instant, a very small fraction of solid atoms feel a very large collision force. The force is typically estimated from the change in momentum, using a typical thermal velocity normal to the wall . The momentum change in an elastic collision is . Taking the vibrational time as an estimate of the collision time, the average force exerted on contacting atoms is . The fraction of area in contact will be the equilibrium pressure times the area per atom divided by this force. For typical values, the fractional contact area from this definition is extremely small even though the entire surface contacts the gas over long time intervals.
For nonadhesive solid-solid contacts with short range interactions and high temperatures, the fraction of time in contact is also small. We can apply the same picture with the load replacing the ideal gas pressure. Then
| (4) |
with the constant of proportionality
| (5) |
The first factor is of order unity since the same springs determine both and . For , which is comparable to the instantaneous values observed for all surfaces. The slightly slower than linear increase in with load is captured by the more detailed model developed in Sec. IIIC.
Decreasing from 0.175 to should increase by a factor of 42. This is consistent with the data for commensurate surfaces. The increase is slightly smaller for incommensurate surfaces and even smaller for amorphous surfaces. In contrast to the case of ideal gases, the quenched disorder on these surfaces keeps some atoms from touching even at large times and the number of these atoms grows as decreases. As noted above, MD simulations ignore quantum effects that usually become important below 5 to 10% of the melting temperature. Thus thermal fluctuations should be even smaller at this low , or equivalently it may be representative of the behavior at higher temperatures when quantum effects are included. Over the range of where MD simulations are accurate, the behavior is close to that for the high temperature in Fig. 2.
To place the range of loads in perspective, the mean pressures in the contact, , correspond to 0.5MPa (a few atmospheres) to 2GPa for a typical metal with GPa. The maximum normal pressure that can be supported before plastic deformation is the hardness, , and for bulk metals is typically to . While significantly larger dimensionless hardnesses are observed in nanocrystals and in amorphous materials, Fig. 2 spans the range of dimensionless loads that are likely to be found in real materials.
III.2 Adhesive Contact Area
The notion of contact is more complicated when long-range adhesive interactions are present. In principle, surfaces feel a van der Waals interaction at arbitrarily large separations, although it will be arbitrarily weak. Some threshold for interactions must be introduced to create a sharp criterion for the onset of contact. A common and reasonable choice is the onset of repulsive interactions burnham91 . This corresponds to a separation distance at the minimum of the interatomic potential, which is commonly used to define the atomic diameter. It is also the same as the separation used to define contact in the nonadhesive case for the LJ interactions used here. Small changes in this criterion have little effect on the trends described below.
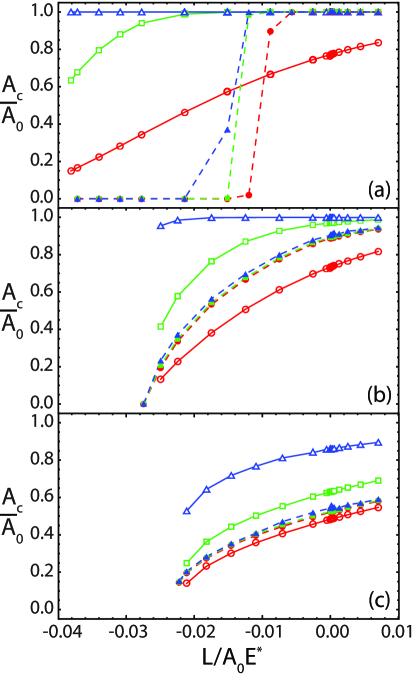
Fig. 3 shows the contact area for adhesive interactions between commensurate, incommensurate and amorphous surfaces, at different time intervals and temperatures. A very strong adhesive potential corresponding to half the internal cohesive potential is used to maximize the contrast with the nonadhesive case. This produces very large tensile strains of a few percent that could produce yield if defects like dislocations were present. The range of interactions is extended to , and further extension had little effect on the results.
In all cases, adhesive interactions bind the surfaces in a local free energy minimum. The surfaces remain locked in this minimum until the load exceeds a negative threshold , where is often called the pulloff force in the context of tip-substrate interactions. The pulloff force is only unique in the limit of zero temperature, where it represents the load where the energy minimum becomes linearly unstable. At any finite temperature, thermal activation will eventually lead to pulloff at any constant negative load Israelachvili91 . The pulloff force observed in simulations decreases with increasing observation time and temperature, and increases with surface area.
As in simulations for tips luan06 , the pulloff force is largest for the commensurate case where all substrate atoms are equally spaced from rigid atoms and can exert the maximum adhesive force. The pulloff force is lower for the incommensurate case where all local environments are sampled, and even lower for the amorphous case where additional roughness reduces the number of atoms that contribute to the adhesion. This effect is entirely geometric since the interaction potentials are the same in all cases.
The behavior of at high temperatures is similar to that for nonadhesive surfaces, although shifted to negative loads. The fractional instantaneous contact area rises roughly linearly at low fractional contact areas for the commensurate case, with increasing negative curvature as area and load increase. The curvature is more pronounced for the other surfaces, but note that is bounded by unity and must saturate at large loads. The linear scale of Fig. 3 accentuates the large values of , where there was also more curvature for the nonadhesive case. Thermal fluctuations in the pullof force prevent us from accessing much smaller values of in constant load simulations, but the asymptotic behavior is discussed further in Sec. IIIC.
For larger values of , substrate atoms are counted as in contact if they feel a repulsive force from a rigid atom at any instant during the time interval. This is consistent with the definition for nonadhesive surfaces and leads to a monotonic rise in with . For the commensurate case, atoms are very likely to make contact even within and full contact was obtained over the entire simulation. The incommensurate surface also reached full contact for most loads at the longest time interval, while the greater roughness on the amorphous surface led to saturation at lower .
At low temperatures, thermal fluctuations are smaller and the time interval is less important. For the commensurate surface there is a sharp transition between zero and full contact at . The transition moves to negative loads as increases because there is time for more distant atoms to contact. As for nonadhesive surfaces, has much less effect for incommensurate and amorphous surfaces, because thermal fluctuations are smaller than the quenched variation in atomic separation.
The above approach is only one way of generalizing the definition of contact used for nonadhesive surfaces. One could also say that atoms contact only when the time-averaged force over is repulsive. For nonadhesive surfaces the force is always repulsive so the time-averaged force is repulsive if contact is made at any instant during . For adhesive surfaces, intervals of repulsion can be countered by attractive interludes. From the continuum perspective, it may be most natural to define contact based on the time-averaged force.
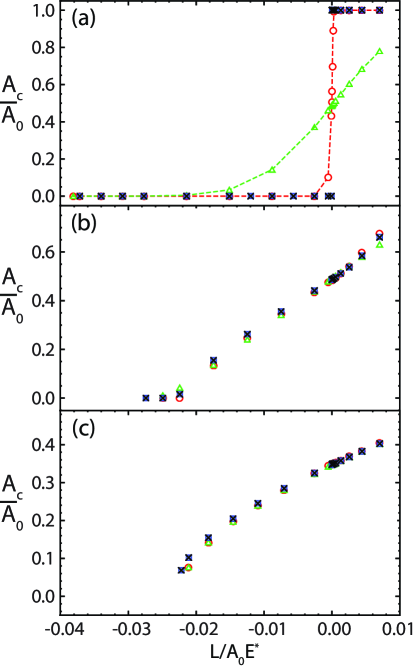
Fig. 4 shows the fraction of area that feels an average repulsion over time intervals of and . The instantaneous results are the same as in Fig. 3. Averaging reduces the thermal fluctuations about the mean force. For the amorphous and incommensurate surfaces, even averaging over is sufficient to remove most of the fluctuations. The quenched disorder then dominates the variation with load and the results are nearly independent of both and .
There is no quenched disorder for the commensurate case, so all atoms have the same mean force. For a sufficiently long time average, there is a sharp transition from no contact to full contact at . Shorter time averages give a Gaussian distribution of mean forces and rises like an error function. Both the Gaussian and the rise in sharpen as grows. Note that the width of this rise for and a commensurate surface, is smaller than the width of the rise for the other surfaces and large . This is consistent with the lack of variation with for these surfaces.
The above results indicate that defining contact area based on time average forces provides a less ambiguous measure of contact for adhesive systems. Except in the extreme case of aligned, commensurate surfaces, the results are insensitive to . In contrast, measures based on instantaneous contact show an increasing drift with and greater variation with . The lack of negative forces in the nonadhesive case means that time average forces are sensitive to rare events. This difficulty can be overcome by averaging the position rather than the force. Unlike the force, the position is not positive definite. However, since the fraction of atoms in contact is almost always much less than a half for the loads considered in the figures above, criteria based on the mean position almost always give zero contact area even though the local pressures are very high.
Note that the association of repulsion with contact is also somewhat arbitrary. One could argue that surfaces that are bound together in a free energy minimum must be in contact. In this case would be significant at any , while Figures 3 and 4 show zero contact area over much of this range. This could be addressed by associating the distance for contact with a larger spacing. For example, the commensurate surface becomes mechanically unstable when the atoms are separated by the distance that maximizes the attractive LJ force.
III.3 Force Distributions
The results described above show that thermal fluctuations lead to large variations in the identity of atoms making contact and the force exerted by these atoms. Previous work has also shown that load may be very unevenly distributed between atoms, with a very small fraction of the atoms carrying the bulk of the load knippenberg08 ; cheng10pre . In this section we examine the distribution of forces in time and among atoms. The distributions are surprisingly universal and can be understood from a simple model that treats each atom independently.
The distribution of forces at any instant can be characterized by the number of atoms with forces greater than some threshold , , and the total force from these atoms . Since we associate contact with repulsive (positive) forces, the discussion will focus on , but it is readily extended to negative values. As decreases to zero, and approach the total number of contacting atoms and the total repulsive force at that instant, respectively. The fraction of contacting atoms with , , and the fraction of the repulsive force they carry, , both vanish as increases.
As shown in Figure 5 we find that the fraction of atoms carrying a given fraction of the total repulsive force is surprisingly universal. Results for all surfaces, with and without adhesion, have nearly the same form at . Similar results are obtained at temperatures up to two orders of magnitude lower. Only at extremely low temperatures, such as , does the amount of quenched disorder become more important than thermal fluctuations. Even in this limit the amorphous results remain similar to the high temperature results. Results for the perfectly ordered commensurate surface approach a straight line, and the incommensurate results are between the other two cases.
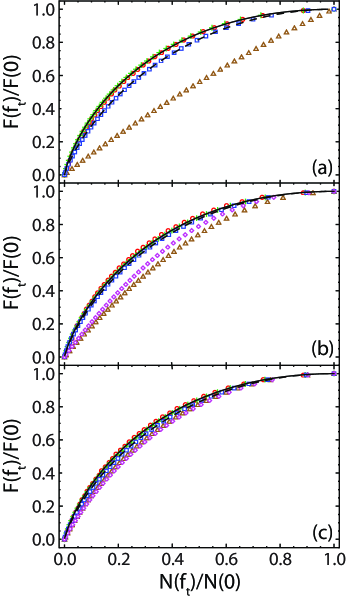
The results in Fig. 5 can be understood from a very simple mean-field model. The total potential for each substrate atom is approximated by an effective harmonic spring binding it to the substrate plus the potential from the rigid atoms. Both are assumed to depend only on , with repulsion from the rigid atoms when and the equilibrium position relative to the substrate at . Then
| (6) |
where is the wall potential. For the commensurate case, all atoms see the same environment. In the nonadhesive case, is just the LJ interaction with the rigid atom above, and in the adhesive case it can be calculated by including the four next-nearest neighbors. In principle, a more complicated interaction should be used for amorphous and incommensurate simulations because of variations in lateral position, but we will see that the exact form of is not too important.
For a sufficiently large system we can replace the distribution over atoms at a given instant by the equilibrium Boltzmann distribution for a single atom. The probability for an atom to be at height is then
| (7) |
with
| (8) |
Each threshold force corresponds to a threshold height , so one can write
| (9) |
and
| (10) |
where is the total number of substrate surface atoms. These integrals are readily performed numerically. Results for all systems can be fit by varying at a fixed . This value of is slightly smaller than the estimate of obtained below Eq. 3 by considering fixed nearest-neighbors, which reflects the extra compliance associated with the motion of these neighbors.
Note that all surfaces follow nearly the same behavior at high temperatures, and amorphous results are similar even at the extremely low temperature of . This surprisingly universal asymptotic behavior can be understood from an even simpler approximation for small fractional contact area. In this limit, decays rapidly with . Most contacting atoms are near and the integrals in Eqs. 9 and 10 are dominated by the contribution near . For small , the potential from the rigid wall can be approximated by a quadratic function and . In this limit, is also much smaller than the potential from the substrate, and the total potential can be approximated by a linear function
| (11) |
Eq. 9 can then be reduced to , where . One also has . Finally, the fractions become and . The resulting solid curves in Figs. 5 (b) and (c) have the form and are independent of . They differ only slightly from the numerical integration of and at high shown by dashed lines in each panel and the solid line in (a).
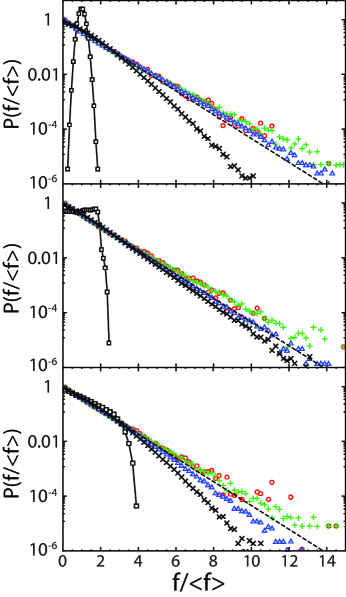
The key assumptions in the above approximation are that the probability decays exponentially for and that the force . Fig. 6 shows that the distribution of instantaneous local forces is exponential for a wide range of circumstances. The dependence of the distribution on , load and temperature has been removed by normalizing by the mean force obtained by averaging over all atoms with an instantaneous repulsion. The probability of a given multiple of this mean is then calculated by averaging over all atoms and times.
As expected from Fig. 5, results for all high temperatures follow an exponential form over several decades in . There are deviations at large because of anharmonicities in the wall potential and variations in atomic separation, but these are generally confined to regions of very low probability that contribute little to average quantities. The simple linear approximation to provides a surprisingly good description over the most important force range. Similar results are obtained at or about 10% of the melting temperature. Thus this exponential behavior should be present at room temperature for nearly any solid.
Deviations from exponential behavior increase as decreases further, and as the load increases. In these limits, the mean position moves towards and even past . The high load, high temperature behavior is most evident for the adhesive cases in Fig. 6 where adhesion leads to effective loads that are roughly 5 times higher than the largest nonadhesive loads. The effective mean normal pressure , would correspond to GPa for metals and the fractional contact area is over 50% for all surfaces and definitions of contact (Fig. 3). Even here, the distribution is exponential for 2 decades or more.
The low temperature limit depends on geometry. For the commensurate case, all atoms have the same potential and probability. For and , is negative and atoms are almost always in repulsive contact. As a result, has a nearly Gaussian distribution about the mean value. Atoms on the incommensurate surface sample different lateral separations nearly uniformly. The resulting force distribution is also nearly constant. The random height distributions on the amorphous surface give something closer to an exponential form, but cut off at larger forces. The disorder produces something like an effective temperature in this case.
It is interesting to note that exponential distributions of forces have also been observed in previous zero temperature studies of surfaces that are even rougher than our amorphous surfaces. Finite-element calculations of self-affine fractal surfaces with roughness down to the mesh size found a universal exponential decay hyun04 , although smoothing surfaces on small scales suppressed the distribution at low and high pressures hyun07 ; campana07epl . Atomistic studies of fractal two dimensional surfaces with lengths up to 8192 atoms also found an exponential decay luan09 . Atomistic simulations of 3D rough surfaces mo09 ; mo10 ; yang08 ; yang08b were fit instead to a function predicted by Persson’s continuum theory persson01 ; hyun04 : . However this analytic form is inconsistent with their observation of a monotonic decrease in with . Their plots of do not appear to be simply exponential either, but were only plotted for fractional contact areas of more than 10%. Their results are discussed further below.
Another recent study examined contact of amorphous surfaces at a temperature of about 8% of the melting temperature mo09 ; mo10 . Their amorphous surface was rougher than ours, and they found the force distribution was similar to Persson’s predicted form. However, the distribution decayed less rapidly than Persson’s at large forces and only the forces from atoms that were in contact more than 30% of the time were included in the distribution. This choice was motivated by forcing the number of atoms contributing to the distribution to equal the mean number in contact at any instant mo09 ; mo10 . As we show next, those atoms that spend least time in contact support the smallest force and removing them from the average will suppress at small forces. It would be interesting to know whether the full force distribution for all atoms in Mo et al.’s simulations had an exponential form.
The quantities and represent the mean force per atom and fraction of time in contact for a given separation from the wall. For the commensurate case, all atoms will have the same separation and same average properties. As the load increases, will decrease, and both and will increase. Atoms on the amorphous and incommensurate surfaces have different environments, and thus sample different at the same load. If they act independently, then is the only relevant parameter and results for vs. should fall on a universal curve at each temperature.
Fig. 7(a) shows this collapse for nonadhesive surfaces. For all systems, results for a range of loads are combined to sample the full range of . The results are averaged over atoms within narrow ranges of and the fluctuations are comparable to the symbol size. The data are in excellent agreement with the simple harmonic mean-field model, whose predictions for and 0.07 are shown by lines. Note that the displacements associated with the largest forces are quite large and are close to the threshold for plastic deformation.
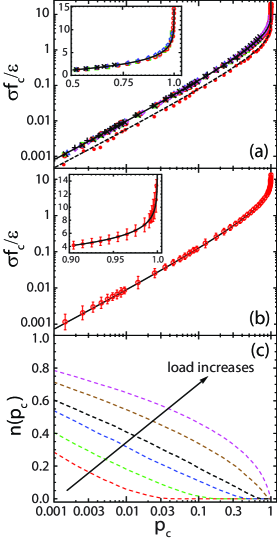
Fig. 7(b) shows similar results for adhesive surfaces footrepel2 . The agreement with simple theory is still quite good, but the fluctuations between atoms (errorbars) are greater. We find that the tails in the adhesive potential from nearby rigid atoms lead to different shapes of for substrate atoms in different environments, and there is also some coupling of lateral and normal displacements. While the distribution of force in Fig. 5 is not affected by these changes in shape, the total forces and probabilities are. Note that the distributions for nonadhesive and adhesive contacts in Fig. 7 are fairly similar even though the LJ interaction is half as strong in the adhesive case. The reason is that interactions from multiple atoms are usually important for the adhesive case and they roughly double the effective strength of the potential. This simple approximation is used in the fit line.
While the relation between and is independent of load, the distribution of values for different atoms along a surface changes with load. For the commensurate case, all atoms have the same and in long time averages. For amorphous and incommensurate surfaces the quenched disorder leads to a distribution of values corresponding to different . Fig. 7(c) illustrates how the range of changes with load for the nonadhesive amorphous surface. The fraction of contacting atoms that are in contact more than a fraction of the time is plotted against for different loads. As the load increases, the maximum values of (and thus ) increase. In all cases, a large fraction of the contacting atoms spend a very small fraction (%) of their time in contact. This fraction of weak contacts drops from more than 90% for the lowest load to about 30% for the highest load. At larger there is roughly linear drop in with the logarithm of .
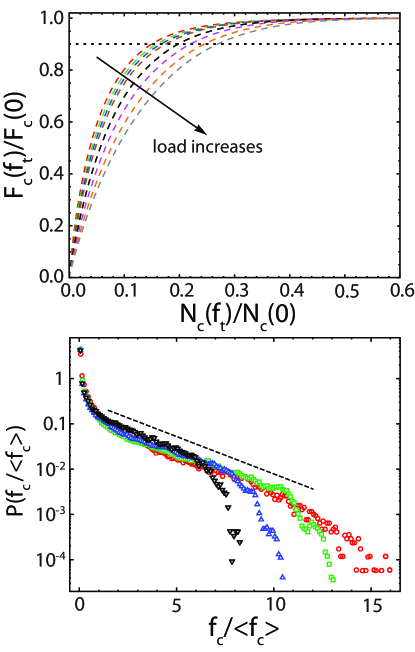
The large number of weak bonds changes the distribution of forces from the instantaneous results shown in Figs. 5 and 6. By analogy with Fig. 5 we define as the number of atoms with time-averaged force force greater than a threshold and as the force they carry. Fig. 8(a) shows the fraction of load carried by the fraction of atoms with the highest forces. The fraction rises much more rapidly than for the instantaneous forces, and depends upon load because the fraction of weak contacts drops with load. The fraction of atoms carrying of the the load rises from about for the lowest load to for the highest load, as compared to for the instantaneous force. Knippenberg et al. have also found that a very small fraction of atoms carries most of the load in their simulations knippenberg08 .
Fig. 8(b) shows the probability of an atom having a given time average force as a function of . As in Fig. 6, the force is normalized by the mean force over all contacting atoms . However, the curves are not independent of load. In each case, there is a large peak at low forces corresponding to the weak contacts, and these dominate the value of . There is a nearly exponential distribution of forces among the atoms that carry the majority of the load and Fig. 8(a) can be fit reasonably well by assuming is an exponential plus a delta function at zero force. As noted above, Yang and Persson studied rougher surfaces and found a that was monotonically decreasing. Their data are also reasonably described by a strong peak at low forces followed by an exponential region.
The above results have direct implications for the relation between area and load found in earlier sections. For the case of commensurate surfaces, all atoms have the same value of and . The fraction of area in contact at a given load is just and the load is . The fit lines in Fig. 2(a) come from the same fit formula used in Fig. 5 with no free parameters. Making the same small area approximation as in Eq. 11, one can derive an analytic form for small . One obtains
| (12) |
and
| (13) |
with
| (14) |
Since both and vary extremely rapidly with , the value of changes little over the relevant range of . This explains why rises only slightly less rapidly than linearly with load in Fig. 2 at small . The main temperature dependence comes from which rises as , explaining the scaling of with in Fig. 2(a).
For incommensurate and amorphous surfaces the situation is complicated, because the distribution of is not known. For sufficiently high temperatures, thermal fluctuations are more important than geometrical fluctuations and rises roughly linearly with load at small loads. However, some fraction of the substrate atoms are so far from wall atoms that they never contact during the simulation. This can be incorporated by reducing to the number of substrate atoms that can contact. The fits in Fig. 2 reduce the number of atoms to 84% and 57% of for incommensurate and amorphous surfaces, respectively. These fractions are consistent with the number of contacting atoms in the limits of large load and time interval and provide an excellent fit. The corresponding predictions for , would be substantially above the actual data. The reason is that many fewer atoms are close enough to contact, particularly at low load.
IV Contact between a spherical tip and a flat substrate
The case of a spherical tip can also be analyzed with the theory developed in the previous section. The main difference is that the curvature of the tip leads to additional variations in the separation between substrate and wall atoms. These variations increase in magnitude and importance as the radius of the tip decreases. We will consider a relatively small radius, . This is comparable to the radius of AFM tips, leading to contacts with relatively small numbers of atoms and rapid changes in surface separation.
Fig. 7(a) includes results for the mean force and fraction of time in contact from simulations with nonadhesive spherical tips. Results for all geometries collapse on the same universal curve obtained for flat surfaces. A similar collapse with data in Fig. 7(b) is found for adhesive tips. Tests of the distribution of instantaneous forces confirm that the same independent atom model describes substrate atoms under all tips, although the small number of atoms in the contacts means that results from several longer simulations are required to get similar statistical accuracy. The main new features of the results presented below come from changes in due to surface curvature.
The continuum limit of nonadhesive contact by a spherical tip is described by Hertz theory johnson85 . It predicts that the region of contact is a circle whose radius scales as
| (15) |
The contact area is then and is thus proportional to , rather than rising linearly with load. The pressure in the contact depends on the radius from the center and is given by:
| (16) |
Note that this dimensionless pressure and the radius are proportional to the same dimensionless measure of load . The characteristic force per atom also grows as the cube root of load, while it is linear in load for flat surfaces. This makes it hard for tip simulations to span a wide range of forces, and nanometer scale tips tend to produce forces at the large end of Fig. 7.
Luan and Robbins considered the same spherical tips used here in the zero temperature limit luan05 ; luan06 . They found systematic deviations between the time and angle averaged pressure and the Hertz prediction (Eq. 16). The finite range of interactions and the atomic scale roughness smeared the pressure over a larger area, and remained nonzero to radii that were twice the predicted at low loads. Deviations were much larger for stepped tips, where the area decreased in discrete jumps as new terraces made contact.
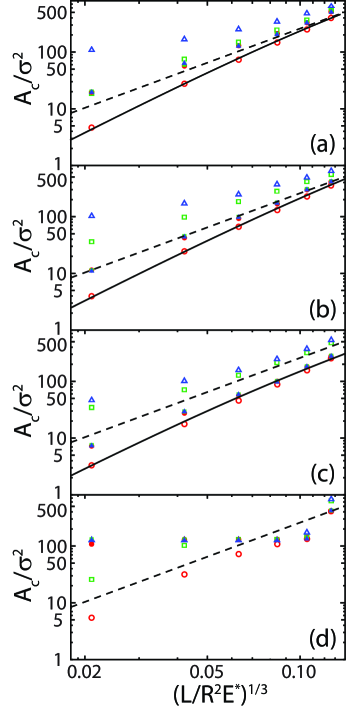
Figure 9 shows the load dependence of the area obtained by counting contacting atoms over different time intervals as a function of . The Hertz prediction is also shown by a dashed line. This prediction is the same for all tips since their surfaces differ by less than a molecular diameter. However, they show rather different behavior, particularly in the case of the stepped tip.
As for the flat surface results in the previous section, the low temperature behavior is relatively insensitive to the averaging time and the results are most strongly influenced by atomic geometry. The contact area for the stepped tip is equal to that of the bottom terrace at low loads and jumps up at high loads when the second terrace contacts. The other tips all show the same scaling as the Hertz prediction at low loads, but with different prefactors. As shown by Luan and Robbins, the contact is spread over a larger radius than predicted by Hertz theory luan05 ; luan06 . All atoms of the commensurate surface that lie within this region make contact, leading to an area about twice as large as the Hertz prediction in Fig. 9 (a). The quenched variation in substrate-tip separations for incommensurate and amorphous surfaces reduces the fraction of atoms that contact. This almost exactly compensates for the increased radius of contact for the incommensurate surface, while the number of contacting atoms is roughly half the Hertz prediction for the amorphous surface. The ratio of MD results to Hertz predictions depends sensitively on the ratio of lattice constants in the incommensurate case luan09 , and to the density in the amorphous case, but is typically within a factor of two.
The time interval is much more important for high temperatures. The area corresponding to atoms in contact at any instant is substantially reduced from Hertz theory in all cases. The rise with load is also more rapid than the Hertz prediction, showing something like the more linear area-load relation found for flat surfaces. Note that the range of dimensionless pressures is much higher for tips because of the small radius. The Hertz prediction for our geometry and loads gives between 0.01 to 0.07, while for flat surfaces ranged from less than to 0.01 in Fig. 2.
The solid lines in Fig. 9(a)-9(c) show the prediction of the harmonic mean-field theory for the commensurate, incommensurate, and amorphous tips, taking the corresponding low temperature area as . The results are in excellent agreement with the simulations and imply that the contact area of tips should scale linearly with load at low . It is not possible to test this scaling to lower loads in our simulations since there are only a handful of atoms touching at the two lowest loads. Accessing the lowest studied for flat surfaces would require increasing into the micrometer range. This size scale is relevant for nanoindenters and is consistent with common estimates of the size of surface asperities in macroscopic contacts bowden86 ; dieterich96 .
As the averaging time interval grows, the contact area rises above the Hertz prediction. The increase is more than an order of magnitude at low loads. The results also become much less sensitive to tip geometry, because thermal fluctuations overcome the quenched variation in height. The magnitude of the increase in area can be estimated from the tip geometry and our estimate of height fluctuations in Eq. 3. Near the edge of a contact of radius , the height varies with change in radius as . Thus a fluctuation in height by can allow contact out to a radius that is larger by and an area that is larger by . If we assume that is about three times the standard deviation over the course of the simulation, then for and . The observed changes are comparable to these simple estimates. The fractional change in area scales as and would become smaller for micrometer and larger tips.
The time averaged pressure is small in the region where contact is only made possible by thermal fluctuations. One consequence is that measures of the contact radius based on the second moment of the pressure distribution remain closer to the value predicted by Hertz and measured at low temperature cheng10pre . Another is that a small fraction of the atoms carry a very large fraction of the load. This observation is similar to the result for time averaged forces between flat surfaces at low temperatures, but is due to the large ring at the perimeter of the contact that is within of the mean substrate height.
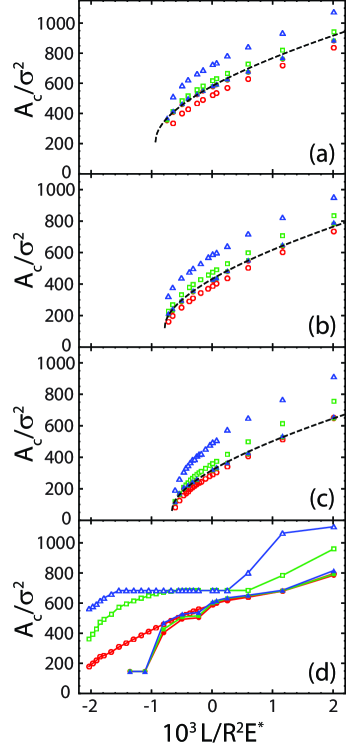
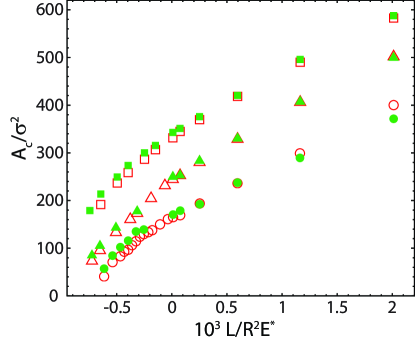
Figure 10 shows corresponding results for adhesive tips. Results for all but the stepped tip look very similar to the flat amorphous case. The area rises sublinearly near the pulloff force, and the curves become more linear at large loads. The time interval has little effect at low temperatures because height fluctuations are smaller than geometrical features. The instantaneous contact area is smaller at high temperatures, but grows with as thermal fluctuations bring more atoms into contact.
What is intriguing is that while the results for adhesive tips look similar to those for flat amorphous solids, they are also qualitatively similar to continuum predictions for sphere-on-flat contact. The form of the continuum theory depends on the work of adhesion per unit area and the range of interactions . The key dimensionless parameter scales as maugis88 ; maugis90 ; tabor76
| (17) |
The limit of strong, short range interactions () is described by Johnson-Kendall-Roberts (JKR) theory, while the opposite limit () is described by Derjaguin, Muller and Toporov (DMT) theory. For typical scanning probe microscope tips and our simulations, to 1 lies between JKR and DMT limits. Maugis-Dugdale (M-D) theory provides a description of this intermediate region, and approximate analytic expressions for this theory have been developed to simplify fits to M-D theory carpick99 ; schwarz03 .
| tip | parameter | ||||
|---|---|---|---|---|---|
| commensurate | 592 | 573 | 558 | 589 | |
| 1.11 | 1.21 | 1.38 | 1.19 | ||
| incommensurate | 480 | 477 | 483 | 493 | |
| 0.84 | 0.93 | 1.08 | 0.90 | ||
| amorphous | 391 | 331 | 332 | 417 | |
| 0.65 | 0.64 | 0.79 | 0.70 | ||
Except for the stepped tip, the data shown in Fig. 10 can be fit reasonably well to M-D theory if the pulloff force and work of adhesion are treated as fit parameters. Fit parameters are summarized in the Table I. While the fits look reasonable, the surfaces often separate at forces that are significantly less negative than the fit . This is particularly evident for Fig 10, where the system was not stable at any value lower than the final data point. In addition, the fit values of are all larger than the independent measures of obtained previously for the same surfaces at zero temperature (caption) luan06 . Presumably this increase in the fit is needed to compensate for the increase in contact area due to the atomistic effects discussed above. The fit parameters are generally within a factor of two of independently measured quantities and may thus be useful in extracting approximate values from experiments. However, our results reinforce the conclusion reached previously luan05 ; luan06 ; mo09 that the success of fits to M-D theory does not represent a quantitative success of continuum theory, which can not be expected to hold at atomic scales.
The contact areas in Fig. 10 were obtained by counting all atoms that ever felt a repulsion during the given . Fig. 11 shows the area obtained by counting only atoms that have a net repulsive force after averaging over . As in the case of contact between two flat surfaces, this definition of is insensitive to both averaging time interval and temperature. It is also harder to describe with continuum theory. The area grows smoothly with load, but could not be fit to M-D theory. The reason is that the power law describing the rate of increase in area is significantly different from the value of 2/3 that enters continuum theories. For flat incommensurate and amorphous surfaces the area rose smoothly rather than transitioning rapidly to full contact. A similar effect seems to modify the rise in area with load for the case of spherical tips. As for flat surfaces the suppression is larger for amorphous surfaces than incommensurate surfaces.
V Discussions and Conclusions
The results presented in this paper reveal the difficulties in extending the notion of contact to molecular scales, even for the simplest geometries. In the case of parallel, atomically flat surfaces, continuum theory would predict a sharp transition from no contact to full contact. The transition would occur at zero load for nonadhesive surfaces, and also for adhesive surfaces if contact is identified with repulsion. This sharp transition is only seen in atomic simulations for the highly unlikely case of two identical, commensurate surfaces with atoms aligned on top of each other. Even there, it is only found near zero temperature or using time averaged forces with adhesive interactions. In all other cases, the contact area rises very gradually. Indeed, pressures comparable to the ideal hardness are required to reach full contact.
Measures of contact area based on instantaneous forces between atoms were shown to be extremely sensitive to thermal roughness. One common approach is to identify the contact area with the mean number of atoms feeling a repulsive force times the area per atom mo09 ; mo10 ; knippenberg08 ; luan09 ; luan06a . For both flat surfaces and spherical tips, thermal fluctuations lead to a linear rise in with load when the mean pressure in the contact is small. For flat commensurate surfaces, linear scaling extends over the entire temperature range studied, corresponding to from 0.01% to 25% of the melting temperature. For incommensurate and amorphous surfaces, the linear behavior is suppressed at low temperatures, as the variation in local geometry around surface atoms becomes more important than thermal fluctuations. At , rises sublinearly, but still remains below full contact until very high loads.
A simple mean-field model was developed that quantitatively describes changes in . Each substrate atom is assumed to be bound to the substrate by a harmonic spring that represents the net effect of bonds to neighboring substrate atoms. The atom also feels a force from the opposing wall that depends on its height . The probability of an atom having a given height and force can then be calculated from the Boltzmann equation. Over a wide range of parameters only the effective stiffness associated with the second derivative of near its minimum is important.
In addition to reproducing the variation of with load, this simple harmonic mean-field model makes several predictions about local forces that are consistent with simulations. One is that the distribution of instantaneous forces on substrate atoms is exponential, which leads to a universal distribution of the fraction of load born by the atoms with the largest forces. Figs. 5 and 6 show that these predictions describe contact between flat surfaces with all geometries except at extremely low temperatures () and high pressures ().
Another prediction is that for all atomic (commensurate, incommensurate, amorphous, or stepped) and large scale (flat or sphere) geometries, the mean force on an atom and the fraction of time in contact have a functional relationship that depends only on temperature. The same relation holds for adhesive surfaces if contact is defined as repulsion and the mean repulsive force is calculated. The fraction of time in contact rises linearly with force at low forces and this quantitatively describes the variation of with load for commensurate surfaces. For incommensurate and amorphous surfaces, the prediction need only be scaled by a constant factor to include the fact that some substrate atoms are too far from wall atoms to make contact. The linear relation between and load or and breaks down when the fraction of time in contact approaches unity. This does not occur until quite large values of . For example, reaches 50% at and for and , respectively.
The simplicity of the harmonic mean-field model allows us to make estimates about the range of validity of the above statements that are quite general and should not depend on the details of atomic interactions. Equation 13 gives the ratio between the dimensionless pressure and the fraction of area in contact at any instant. The main variation in this ratio comes from , which rises as the square root of temperature. The Lindemann criterion says that the value of should be about 10% of the nearest-neighbor spacing at the melting temperature footLind . This allows us to write . Inserting this into Eq. 13 and multiplying and dividing by we find
| (18) |
with
| (19) |
The values of and are both determined by the interactions between neighbors, and the ratio will generally be near unity. For the potential used here it is . The value of should also be close to unity if interactions across the interface are comparable to internal interactions. The value of is directly related to via Eq. 12, but varies extremely slowly. For example, it drops from 3.1 to 1.4 as rises from to . One can thus conclude that
| (20) |
for any potential. Note that this expression differs from the simple estimate based on thermal collisions in Eq. 5 by a factor of order unity.
Molecular dynamics is only accurate for temperatures high enough compared to the Debye temperature that quantum effects can be ignored. This typically corresponds to and applies to most materials at room temperature. As increases from to the pressure required for atoms to be in contact more than 50% of the time rises from to 0.05. Plastic deformation sets in when exceeds the hardness, . Typical values of are of order to for macroscopic crystals. While larger values may be observed in defect free systems and at nanometer scales, the theoretical limit is only . Thus one can generally expect that atoms will spend a significant fraction of their time out of repulsive contact at temperatures and pressures of experimental interest.
Our simulations reduced the number of free parameters and the size of the simulation by keeping one surface rigid. If both surfaces are compliant, there are two offsetting changes. One is that there are thermal fluctuations by atoms on both sides that increase thermal roughness. This can be modeled roughly by replacing by the sum of the inverse values for the two surfaces. Continuum contact mechanics says that the inverse of the effective modulus is related in the same way to the moduli of the two solids. Since the same interactions determine both and , the two changes should nearly cancel. Simulations for a few examples confirmed this.
The above discussion neglects quenched geometric disorder due to differences in separation between substrate atoms and atoms on the opposing surface. This reduces the number of atoms on amorphous and incommensurate surfaces that can be brought into contact by thermal fluctuations. At and 0.25 we found that the mean-field theory still worked if one reduced the available number of contacts by a constant fraction. For example, the fit lines in Fig. 5 used 84% for the incommensurate surface and 57% for the amorphous case.
At the much lower temperature of , is much smaller than the atomic scale roughness on incommensurate and amorphous surfaces. Particularly in the case of amorphous surfaces, those atoms that contact at a given load stay in contact most of the time. This is clearly seen in Fig. 2, where for all loads increases by less than a factor of 2 as increases from 0 to 500. One can also calculate the mean force on atoms from the measured and . At the lowest load in Fig. 2c, , which is larger than the force where the linear relation between force and breaks down. Thus, in contrast to the commensurate case, the rise in reflects an increase in the number of atoms that are close enough to contact rather than an increase in the fraction of time in contact. As load increases, contacting atoms are pushed down relative to other atoms, allowing new atoms to contact the opposing surface. Note that the rise in with load is nonlinear for both incommensurate and amorphous surfaces. Continuum theory predicts a linear relation for rough surfaces, but it is not clear it can be applied at these scales or that the surfaces have an appropriate distribution of roughness.
Experimental surfaces are generally much rougher than those considered here, with bumps on top of bumps at all scales greenwood66 ; bowden86 . At low loads, contact occurs only where two asperities from opposing surfaces overlap. In continuum theories, the linear area-load relation comes from the growth in the number of such contacts with load. The distribution of contact sizes and forces remains unchanged.
Simulations of the spherical tip geometry give insight into the behavior of asperity contacts. As for flat surfaces, at typical experimental temperatures, thermal roughness leads to a linear relation between area and pressure until is 0.01 to 0.05. This pressure is generally large enough to produce plastic deformation under micrometer and larger asperities, and comparable to the hardness of nanoasperities. In the cases of nanoasperities, these and previous simulations luan05 ; luan06 ; cheng10pre show that the contact area is not accurately described by continuum theory. Thus it is not clear that will follow continuum predictions bowden86 ; johnson85 for rough surfaces at experimental temperatures.
Since continuum theory ignores thermal fluctuations, it is natural to work with definitions of contact area based on time-averaged rather than instantaneous forces. For adhesive surfaces, the area where time-averaged forces are repulsive is nearly independent of averaging time and is insensitive to temperature. While this seems the least ambiguous definition of contact, it only shows a sharp transition from no contact to full contact for flat commensurate surfaces. For flat incommensurate and amorphous surfaces, the transition is spread over a range that is comparable to the pressures needed to produce plasticity.
The time averaged force gives much less satisfactory results for nonadhesive surfaces. Since the force is always repulsive, any contact leads to a positive time-averaged force. The contact area grows monotonically with the averaging time interval , leading to substantial ambiguity in for both flat and spherical surfaces. Averaging positions instead of forces reduces the sensitivity to rare events. However, one finds that the mean separation is beyond the interaction range for most loads, implying that there is no contact even though there is a large repulsive force.
Averaging positions and forces gives similar results for adhesive surfaces if contact is based on repulsive interactions between atoms. However we have found that another definition gives a sharper transition from partial to full contact for incommensurate surfaces. Instead of basing contact on forces between atoms, it is based on the separation between surfaces. A Delaunay triangulation of each surface is performed and triangles on opposing surfaces are said to contact if they are separated by less than the distance where atomic interactions become repulsive. We are currently exploring whether associating contact with surface separations instead of atomic forces improves the comparison of simulations and continuum calculations of rough surfaces with multiasperity contacts.
Acknowledgments
This material is based upon work supported by the National Science Foundation under Grant No. DMR-0454947 and the Air Force Office of Scientific Research under Grant No. FA9550-0910232.
References
- (1) Greenwood, J.A., Williamson, J.B.P.: Contact of nominally flat surfaces. Proc. R. Soc. London, Ser. A 295, 300–319 (1966)
- (2) Johnson, K.L.: Contact Mechanics. Cambridge, New York (1985)
- (3) Persson, B.N.J.: Elastoplastic contact between randomly rough surfaces. Phys. Rev. Lett. 87, 116101 (2001)
- (4) Hyun, S., Pei, L., Molinari, J.F., Robbins, M.O.: Finite-element analysis of contact between elastic self-affine surfaces. Phys. Rev. E 70, 026117 (2004)
- (5) Bowden, F.P., Tabor, D.: The Friction and Lubrication of Solids. Clarendon Press, Oxford (1986)
- (6) Gao, Y.F., Bower, A.F.: Elastic-plastic contact of a rough surface with weierstrass profile. Proc. R. Soc. A 462, 319–348 (2005)
- (7) Pei, L., Hyun, S., Molinari, J.F., Robbins, M.O.: Finite element modeling of elasto-plastic contact between rough surfaces. J. Mech. Phys. Sol. 53, 2385–2409 (2005)
- (8) Carpick, R.W., Salmeron, M.: Scratching the surface: Fundamental investigations of tribology with atomic force microscopy. Chem. Rev. 97, 1163–1194 (1997)
- (9) Carpick, R.W., Ogletree, D.F., Salmeron, M.: Lateral stiffness: A new nanomechanical measurement for the determination of shear strengths with friction force microscopy. Appl. Phys. Lett. 70, 1548–1550 (1997)
- (10) Enachescu, M., van den Oetelaar, R.J.A., Carpick, R.W., Ogletree, D.F., Flipse, C.J.F., Salmeron, M.: An afm study of an ideally hard contact: The diamond(111)/tungsten carbide interface. Phys. Rev. Lett. 81, 1877–1880 (1998)
- (11) Carpick, R.W., Ogletree, D.F., Salmeron, M.: A general equation for fitting single asperity contact area and friction measurements. J. Colloid Interface Sci. 211, 395–400 (1999)
- (12) Luan, B., Robbins, M.O.: The breakdown of continuum models for mechanical contacts. Nature 435, 929–932 (2005)
- (13) Luan, B.: Simulations of contact and friction: Connecting atomic and continuum descriptions. Ph.D. thesis, Johns Hopkins University, Baltimore (2006)
- (14) Mo, Y., Turner, K.T., Szlufarska, I.: Friction laws at the nanoscale. Nature 457, 1116–1119 (2009)
- (15) Mo, Y., Szlufarska, I.: Roughness picture of friction in dry nanoscale contacts. Phys. Rev. B 81(3), 035405 (2010).
- (16) Harrison, J.A., Stuart, S.J., Brenner, D.W.: Atomic-scale simulation of tribological and related phenomena. In: Bhushan, B. (ed.) Handbook of Micro/Nanotribology, pp. 525–594. CRC Press, Boca Raton, FL (1999)
- (17) Robbins, M.O., Müser, M.H.: Computer simulations of friction, lubrication and wear. In: Bhushan, B. (ed.) Handbook of Modern Tribology, pp. 717–765. CRC Press, Boca Raton (2000 (cond-mat/0001056))
- (18) Knippenberg, M.T., Mikulski, P.T., Dunlap, B.I., Harrison, J.A.: Atomic contributions to friction and load for tip–self-assembled monolayers interactions. Phys. Rev. B 78(23), 235409 (2008)
- (19) Brukman, M.J., Gao, G., Nemanich, R.J., Harrison, J.A.: Temperature dependence of single-asperity diamond-diamond friction elucidated using afm and md simulations. J. Phys. Chem. C 112, 9358 (2008)
- (20) Pearson, J.D., Gao, G., Zikry, M.A., Harrison, J.A.: Nanoindentation of model diamond nanocomposites: Hierarchical molecular dynamics and finite-element simulations. Comp. Mat. Sci. 47, 1 (2009)
- (21) Chandross, M., Lorenz, C.D., Stevens, M.J., Grest, G.S.: Simulations of nanotribology with realistic probe tip models. Langmuir 24, 1240–1246 (2008)
- (22) Yang, C., Persson, B.N.J.: Molecular dynamics study of contact mechanics: Contact area and interfacial separation from small to full contact. Phys. Rev. Lett. 100, 024303 (2008)
- (23) Yang, C., Persson, B.N.J.: Contact mechanics: contact area and interfacial separation from small contact to full contact. J. Phys.: Condens. Matter 20, 215214 (2008)
- (24) Burnham, N.A., Colton, R.J., Pollock, H.M.: Interpretation issues in force microscopy. J. Vac. Sci. Technol. A 9, 2548–2556 (1991)
- (25) Luan, B., Robbins, M.O.: Hybrid atomistic/continuum study of contact and friction between rough solids. Tribol. Lett. 36, 1–16 (2009)
- (26) Cheng, S., Luan, B.Q., Robbins, M.O.: Contact and friction of nanoasperities: Effects of adsorbed monolayers. Phys. Rev. E 81, 016102 (2010)
- (27) Indirect long-range replulsions may be present in some cases, such as for charged srufaces in water.
- (28) Schwarz, U.D.: A generalized analytical model for the elastic deformation of an adhesive contact between a sphere and a flat surface. J. Colloid Interface Sci. 261, 99–106 (2003)
- (29) Luan, B., Hyun, S., Robbins, M.O., Bernstein, N.: Multiscale modeling of two dimensional rough surface contacts. In: Wahl, K.J., Huber, N., Mann, A.B., Bahr, D.F., Cheng, Y.T. (eds.) Fundamentals of Nanoindentation and Nanotribology, vol. 841, p. R7.4. Materials Research Society, Warrendale (2005)
- (30) Luan, B., Hyun, S., Molinari, J.F., Bernstein, N., Robbins, M.O.: Multiscale modeling of two-dimensional contacts. Phys. Rev. E 74, 046710 (2006)
- (31) Campañá, C., Müser, M.H., Robbins, M.O.: Elastic contact between self-affine surfaces: Comparison of numerical stress and contact correlation functions with analytic predictions. J. Phys.: Condens. Matter 20, 354013 (2008)
- (32) Hyun, S., Robbins, M.O.: Elastic contact between rough surfaces: Effect of roughness at large and small wavelengths. Tribol. Int. 40, 1413–1422 (2007)
- (33) Persson, B.N.J.: On the elastic energy and stress correlation in the contact between elastic solids with randomly rough surfaces. J. Phys.: Condens. Matter 20, 312001 (2008)
- (34) Allen, M.P., Tildesley, D.J.: Computer Simulation of Liquids. Clarendon Press, Oxford (1987)
- (35) Sergici, A.O., Adams, G.G., Müftü, S.: Adhesion in the contact of a spherical indenter with a layered elastic half-space. J. Mech. Phys. Sol. 54, 1843–1861 (2006)
- (36) Gao, G.T., Cannara, R.J., Carpick, R.W., Harrison, J.A.: Atomic-scale friction on diamond: A comparison of different sliding directions on (001) and (111) surfaces using md and afm. Langmuir 23(10), 5394–5405 (2007)
- (37) This was first worked out by Bélidor for spheres sliding over spheres in 1737, before atoms were universally accepted. D. Dowson, History of Tribology (Longman, New York, 1979).
- (38) Israelachvili, J.N.: Intermolecular and Surface Forces, 2nd ed. Academic Press, London (1991)
- (39) Campañá, C., Müser, M.H.: Contact mechanics of real vs. randomly rough surfaces: A green’s function molecular dynamics study. Europhys. Lett. 77, 38005 (2007)
- (40) Note that as in the theoretical expressions, only repulsive contributions to the force are included in the average.
- (41) Dieterich, J.H., Kilgore, B.D.: Imaging surface contacts: power law contact distributions and contact stresses in quartz, calcite, glass and acrylic plastic. Tectonophysics 256, 219–239 (1996)
- (42) Maugis, D.: Adherence and fracture propagation. J. Surf. Mat. techn. Soc. francaise du Vide 42, 399–401 (1987)
- (43) Maugis, D.: In: Grunze, M., Kreuzer, H.J. (eds.) Adhesion and Friction, vol. 17, pp. 303–. Springer Verlag, Berlin (1990)
- (44) Tabor, D.: Surface forces and surface interactions. J. Colloid Interface Sci. 58, 2–13 (1977)
- (45) The rms displacement at is often more than 10% of the nearest-neighbor spacing due to anharmonicity. See for example M. J. Stevens and M. O. Robbins, J. Chem. Phys. 98, 2319-2324 (1993).