Theoretical spectra of photoevaporating protoplanetary discs:
An atlas of atomic and low-ionisation emission lines
Abstract
We present a calculation of the atomic and low-ionisation emission line spectra of photoevaporating protoplanetary discs. Line luminosities and profiles are obtained from detailed photoionisation calculations of the disc and wind structures surrounding young active solar-type stars. The disc and wind density and velocity fields were obtained from the recently developed radiation-hydrodynamic models of Owen et al., that include stellar X-ray and EUV irradiation of protoplanetary discs at various stages of clearing, from primordial sources to inner hole sources of various hole sizes.
Our models compare favourably with currently available observations, lending support to an X-ray driven photoevaporation model for disc dispersal. In particular, we find that X-rays drive a warm, predominantly neutral flow where the OI 6300Å line can be produced by neutral hydrogen collisional excitation. Our models can, for the first time, provide a very good match to both luminosities and profiles of the low-velocity component of the OI 6300Å line and other forbidden lines observed by Hartigan et al., which covered a large sample of T-Tauri stars.
We find that the OI 6300Å and the NeII 12.8m lines are predominantly produced in the X-ray-driven wind and thus appear blue-shifted by a few km/s for some of the systems when observed at non-edge-on inclinations. We note however that blue-shifts are only produced under certain conditions: X-ray luminosity, spectral shape and inner hole size all affect the location of the emitting region and the physical conditions in the wind. We caution therefore that while a blueshifted line is a tell-tale sign of an outflow, the lack of a blueshift should not be necessarily interpreted as a lack of outflow. Comparison of spectrally resolved observations of multiple emission lines with detailed model sets, like the one presented here, should provide useful diagnostics of the clearing of gaseous discs.
keywords:
accretion, accretion discs:circumstellar matter- planetary systems:protoplanetary discs - stars:pre-main sequence1 Introduction
The circumstellar environments of newly-born low to intermediate mass stars have recently been the object of much interest for their potential of hosting planetary systems. These (protoplanetary) discs of dust and gas hold the reservoir of material from which planets may form and provide the medium through which newly formed planets and planetesimals migrate towards or away from their parent star. For this reason no theory of planet formation can be complete without an understanding of how protoplanetary discs evolve and finally disperse.
The dispersal of protoplanetary discs has been studied observationally, through statistics of disc fractions in young clusters (e.g. Haisch et al 2001; Hernandez et al 2008; Mamajek 2009) and on an object-by-object basis through observations of individual so-called transition discs (e.g. Calvet et al 2002), i.e. discs that appear to be optically thin in the dust in their inner regions, which is generally interpreted as evidence of partial (inside-out) clearing. Whether these discs with inner-holes really represent a stage in the evolution/dispersal of protoplanetary discs is currently still uncertain. Currently, the consensus in the literature is that the dispersal of discs around T-Tauri stars is characterised by a rather fast transition timescale, evidenced by the fact that very few objects (typically 10%) are caught in this transition phase (Strom et al. 1989; Strutskie et al. 1990; Ercolano, Clarke & Robitaille 2009; Kim et al 2009; Luhman et al 2010; Muzerolle et al 2010)111There have been claims of longer transition timescales for M-stars or older clusters (Sicilia-Aguilar et al. 2008; Currie et al 2009), these results, however, are still object of debate in the literature (Ercolano et al 2009, Muzerolle et al. 2009, Luhman et al 2010).
On the basis of these observational results, theoretical efforts have thus focused on identifying a mechanism to provide a two-timescale dispersal phenomenon, i.e. a mechanism that would allow protoplanetary discs to be detected as optically thick (in the dust) for a few million years and then cause them to disperse very rapidly in about a tenth of their total lifetime, i.e. a timescale much shorter than what would be expected by viscous evolution alone (Hartmann et al. 1998, Clarke et al. 2001).
The proposed mechanisms include planet formation itself (e.g. Armitage & Hansen 1999), grain growth (Dullemond & Dominik 2005), photophoresis (Krauss et al 2007), MRI-driven winds (Suzuki & Inutsuka 2009), and photoevaporation (Clarke et al 2001; Alexander et al 2006, Richling & Yorke 2000, Ercolano et al 2008b, 2009a, Gorti & Hollenbach 2009; Owen et al. 2010a). Understanding which (or what combination) of the proposed mechanisms dominates dispersal is key to understanding disc evolution and thus provides important constraints on planet formation theories by setting the timescale over which planets may form and migrate.
Photoevaporation by soft X-ray radiation (100 eV E 1keV) has been shown to drive powerful winds (Ercolano et al. 2008b, 2009a, Gorti & Hollenbach 2009), able to disperse the discs rapidly once the accretion rates have fallen to values lower than the photoevaporation rates (10-8M⊙/yr for X-ray luminosities of 21030erg/s; Owen et al. 2010a; from now on O10). The mass-loss rates are roughly proportional to the impinging X-ray luminosity (Ercolano 2008b), meaning that the expected mass-loss rates (and hence accretion rates) for solar type stars span over the two-three decade range of X-rayluminosities(e.g. Preibisch et al. 2005; Güdel et al. 2007).The recent observation of shorter disc lifetimes in low-metallicity environments (Yasui et al 2009) has been interpreted as further evidence for X-ray photoevaporation acting as the main disc dispersal mechanism in those clusters (Ercolano & Clarke 2009).
While encouraging, the evidence in favour of photoevaporation produced so far consists of statistics derived from observations of disc dispersal based on the evolution of their dust component. However, dust represents only a percent or so of the total disc mass and the evolution of the dust and gas component of a disc do not necessarily go hand in hand (e.g. Alexander & Armitage 2007; Takeuchi, Clarke & Lin 2004). In the last few years, observations of emission lines from warm atomic and low ionisation gas in the inner region of discs are starting to provide some helpful clues of the physical conditions of the gaseous component in these planet-forming regions (Hartigan et al 1995;Herczeg et al 2007; Pascucci et al 2007; Razka et al 2007; Espaillat et al 1995; Najita et al 2009; Pascucci & Sterzik 2009; Flaccomio et al 2009; Güdel et al 2010, submitted). Line emission from low ionisation and atomic species is of particular interest, as it is likely to trace material that is located in the warm upper layers of the disc atmosphere or in the flow itself, allowing the response of the gas to irradiation from the central star to be probed and understood. In particular Pascucci & Sterzik (2009) reported evidence of a blue-shifted NeII fine structure line at 12.8m, the blue-shift is consistent with the line being formed in a slow moving (a few km/s) disc wind (Alexander 2008). Earlier spectrally resolved observations of optical forbidden lines in T-Tauri stars (Hartigan et al., 1995, from now on HEG95), including OI 6300 Å, also revealed blue-shifted low velocity components, interpreted as evidence for a disc wind. The interpretation of these atomic and low-ionisation emission line profiles is key to understand the kinematic structure of the warm upper disc layers and its wind. In this paper we provide the tools to exploit currently available and future observations using the framework of the X-ray driven photoevaporation model of O10 (further discussed in Section 2).
Furthermore, with the Herschel Space Telescope and, later, James Webb Space Telescope, committed to studying planet formation through the characterisation of discs, it is both timely and important to provide a solid theoretical framework for the interpretation of these newobservations. In this context this paper has two main aims: (i) To provide an atlas of atomic and low ionisation emission line intensities and profiles predicted for the photoevaporating protoplanetary discs of O10 at various stages in their evolution; (ii) To compare the predictions of O10’s X-ray driven photoevaporation model with currently available observations and search for the ‘smoking gun’ of photoevaporation. We therefore list line intensities for the brightest lines and calculate line profiles for some of the more promising wind/disc tracers. We show results for discs at different stages of clearing, i.e. photoevaporating primordial discs where an inner hole is yet to form and systems in a more advanced clearing stage with inner holes (in dust and gas) of increasing radius. We note that, while several authors have presented theoretical calculations of emission line luminosities and profiles from T-Tauri discs (e.g. Glassgold et al 2007, Meijerink et al. 2008, Ercolano et al 2008b, Gorti & Hollenbach 2008, Hollenbach & Gorti 2009, Schisano, Ercolano & Güdel 2010), this is the first time that a fully self-consistent radiation-hydrodynamical and photoionisation calculation is attempted, which provides us with the three-dimensional distribution of gas velocities and emissivities in the heated layers of the disc and its wind.
A comparison of the calculations presented in this paper with available observations suggests that X-ray heated discs with hydrodynamically escaping winds produce emission line intensities and profiles that are consistent with those that are currently being observed. It is hoped that the results presented here may be used for the interpretation of future observational data which will be crucial to further test the validity of the X-ray photoevaporation scenario as a dominant disc clearing mechanism.
The paper is organised as followed. Section 2 briefly describes the radiation-hydrodynamic disc models and lists the input parameters. Sections 3 presents the results, including the emission line intensities and the predicted profiles for selected transitions. Sections 4 and 5 deal with a comparison of our results with currently available data. The main points of the paper are briefly summarised in Section 6.
2 The radiation-hydrodynamics models
Energetic radiation from a young stellar objects (YSOs) ionises and heats the gas in the surrounding protoplanetary disc. The gas expands as a result of the extra heating and some regions of the disc atmosphere may become unbound, giving rise to a photoevaporative wind from the disc surface. A calculation of accurate mass loss rates and of the density and geometry of the flow requires the simultaneous solution of the two-dimensional radiative transfer and the hydrodynamics problem. Owen et al. (2010a, O10) recently presented the first fully self-consistent radiation hydrodynamics calculations of an X-ray plus EUV photoevaporated protoplanetary discs. Ercolano et al (2009) and O10 found irradiation by soft X-rays to be most efficient at producing a photoevaporative disc wind with mass loss rates of M⊙/yr for X-ray luminosities of 1030 erg/sec. When coupled with viscous evolution, these wind rates are sufficiently large to produce an inner hole in the disc, when the accretion rate drops significantly (a factor 10) below the wind mass-loss rates. The remaining material is then dispersed in the final 15-20% of the disc lifetime. In this paper we refer to EUV radiation as having energies between 13.6eV and 100 eV, soft X-ray radiation between 100 eV and 1 keV, and hard X-ray radiation for energies larger than 1 keV. The total ’X-ray’ luminosity is defined between 0.1 keV and 10 keV, which is similar to the bandpass quoted by Güedel et al 2009 (0.3-10 keV).
Two-dimensional hydrodynamic calculations were performed using a parameterisation of the gas temperature based on the results of three-dimensional radiative transfer and photoionisation calculations. Radiative equilibrium was assumed and verified a posteriori by ensuring that the thermal timescale is shorter than the flow timescale. The hydrodynamic calculations were carried out using a modified version of the zeus-2d code (Stone & Norman 1992a,b; Stone et al 1992) which includes heating from the X-ray and EUV radiation from a central YSO. The radiative transfer and photoionisation calculations were carried out using the 3D mocassin code (Ercolano et al. 2003, 2005, 2008a) modified according to Ercolano et al. (2008b, 2009a). The atomic database included opacity data from Verner et al. (1993) and Verner & Yakovlev (1995), energy levels, collision strengths and transition probabilities from Version 5.2 of the CHIANTI database (Landi et al. 2006, and references therein) and the improved hydrogen and helium free-bound continuous emission data of Ercolano & Storey (2006).
The models presented here are appropriate for a 0.7 M⊙ star; models for lower/higher mass stars are currently being developed and will be presented in a future paper. We vary the X-ray luminosity to span the observed range for classical T-Tauri stars (cTTs) of this mass ( 210L 21030 erg/sec; e.g. Preibisch et al. 2005; Güdel et al. 2007) and consider discs at different stages of dispersal, from discs extending all the way into their dust destruction radius (’primordial discs’) to discs with cleared inner holes of varying sizes (Rin = 8.3 AU, 14.2 AU and 30.5 AU, models A, D and G in O10, respectively). The ionising spectra used were calculated by Ercolano et al (2009a), using the plasma code of Kashyap & Drake (2000) from an emission measure distribution based on that derived for RS CVn type binaries by Sanz-Forcada et al. (2002), which peaks at 104 K and fits to Chandra spectra of T-Tauri stars by Maggio et al. (2007), which peaks at around 107.5 K. For the remainder of this paper we will refer to the models by their X-ray luminosity (0.1 keV h 10 keV), we note, however, that the irradiating spectrum has a significant EUV component (13.6 eV h 0.1 keV) with LEUV = LX (see Ercolano et al 2009a for further discussion).
The following elemental abundances were adopted, given as number densities with respect to hydrogen: He/H = 0.1, C/H = 1.410-4, N/H = 8.32 10-5, O/H = 3.2 10-4, Ne/H = 1.2 10-4, Mg/H = 1.1 10-6, Si/H = 1.7 10-6, S/H = 2.8 10-5. These are solar abundances (Asplund et al. 2005) depleted according to Savage & Sembach (1996). D’Alessio et al. (2001) consider discs composed of a bimodal dust distribution, where atmospheric dust follows the standard MRN model and interior dust consists of larger grains with a size distribution still described by a power law of index -3.5, but with amin = 0.005 m and amax = 1 mm. The transition between atmospheric and interior dust occurs at a height of 0.1 times the midplane gas scale height. As we are mainly interested in regions well above the transition point, we have chosen for simplicity to use atmospheric dust everywhere. Following D’Alessio et al. (2001), the dust-to-gas mass ratio of graphite is 0.00025 and that of silicates is 0.0004.
We refer the reader to Ercolano et al. (2008b, 2009a) and O10 for further details about the codes used and the model setup.
2.1 Differences in photoevaporation models
All photoevaporation models are based on the idea that a source of radiation (internal - e.g. the YSO, or external e.g. a nearby OB star) heats up the gas in the disc, depositing enough energy to leave the gas unbound. Low-mass YSOs that are far from external sources of energetic radiation, e.g. a typical YSO in Taurus, are the only source of irradiation for their discs. A typical YSO produces chromospheric EUV (13.6 eV E 100 eV) and X-ray radiation (E 100 eV), with luminosities for the latter spanning several orders of magnitude around erg/sec. The EUV luminosities are poorly known as they cannot be directly observed, but they are estimated to be of order 1041 phot/sec (Alexander et al. 2005). The YSO also radiates copiously in the FUV, both from the chromosphere and due to accretion shocks (which may also contribute some of the X-ray emission). Chromospheric FUV luminosities are comparable to the observed X-ray luminosities and accretion luminosities proportional to the accretion rate of the object.
Theoretical photoevaporation models that account for one or a combination of EUV, X-ray and FUV have been constructed by a number of authors and it is worthwhile to point out some of the basic differences amongst the current models. In terms of basic physics, the models can be split into two categories: (i) Diffuse field and (ii) direct field dominated.
The standard primordial disc EUV models of Hollenbach et al (1994), Clarke et al. (2001) and Font et al. (2004) belong to the first category. In these models the heating of the upper layers of the gaseous disc is dominated by recombination photons from within the flow itself. The mass loss rates in this case are accurately determined by hydrodynamical calculations and more importantly are the mass-loss rate profiles (Font et al. 2004). Mass-loss rates are found to be of order 10-10 M⊙/yr with only a square root dependence on the ionising luminosity. The mass-loss radial profile is narrowly peaked at a few AU for solar type stars.
As a result of the combined effect of EUV photoevaporation and viscous draining, most discs would eventually develop an inner hole when the accretion rates fall to a level comparable to the wind rates (Clarke et al. 2001, Alexander et al. 2006a). At this point the models become direct field dominated (i.e. dominated by radiation from the central source) as the inner disc is removed and stellar EUV photons can directly reach the inner edge of the photoevaporating disc.
The FUV photoevaporation model of Gorti & Hollenbach (2009) and the X-ray photoevaporation models of Ercolano et al (2008b,2009a) and Owen et al (2010a) also fall in the direct field dominated category, both during their primordial and inner hole phase. For models in this category, the heating is more or less set by the direct flux from the central source.
Determination of accurate mass-loss rates relies on the ability to solve the radiative transfer and thermal calculation problem within a hydrodynamical calculation. This has only been done so far for the EUV model (Clarke et al 2001, Font et al 2004, Alexander et al 2006) and the X-ray model (Owen et al 2010), both in the primordial and inner hole phase. A hydrodynamical calculation has not been performed for the FUV model and mass-loss rates in this case have been estimated by way of an approximation (Gorti & Hollenbach 2009), meaning that the values obtained carry potentially large uncertainties.
2.1.1 Temperature determination
The temperature structure in the upper layers of the gaseous disc is crucial in determining the flow launching zone and mass loss rates (hence the wind structure). The thermal balance of EUV and X-ray irradiated models is set by heating by photoionisation against cooling which is dominated by collisionally excited line emission. The physics and atomic data involved are reasonably well known. Ercolano et al (2008b) describes all the heating and cooling mechanisms for the X-ray model in some detail. It is worth noting here that Ercolano et al (2008b, 2009a) and Owen et al (2010a) use the mocassin code (Ercolano et al 2003, 2005, 2008a) which does not include molecular cooling in its thermal balance. The lack of molecular cooling has been criticised by Gorti & Hollenbach (2009) as a possible source of uncertainty. However, we note that the launching region and the associated sonic surface occurs in a region where all molecules have already dissociated. While the X-rays can deposit energy in the deep molecular layers, their largest thermal impact is by far in the upper photodissociated layers. Furthermore, even at large column densities, where molecular cooling can occur, Figure 4 of Glassgold et al (2004) clearly shows that it is quickly overwhelmed by dust-gas collisions, which are fully implemented in mocassin. We therefore conclude that the omission of molecular cooling is not a significant source of uncertainty in our models (see also further tests and discussion in Owen et al. 2010a).
In the FUV case explored by Gorti & Hollenbach (2009) the heating of the gas is dominated by photoelectric emission from dust grains, with PAHs completely dominating the heating channels (see e.g. Figure 4 of Gorti & Hollenbach 2008). There are two problems with this approach. The first is that the photoelectric yields are very poorly known, with uncertainties that could be as large as two orders of magnitude (e.g. compare Abbas et al 2006, with Feuerbacher & Fitton 1972). Another complication is the fact that the abundance (or even presence) of PAH in T-Tauri discs is highly uncertain with PAHs detections only in approximately 8% of cases (e.g. Geers et al 2006). Indeed models predict that PAHs in the discs upper layers are easily destroyed by X-ray irradiation (e.g. Siebenmorgen et al 2010). Even assuming that photoelectric yields are correct, the uncertainty in the abundance/presence of PAHs in the disc makes photoelectric heating almost a free parameter in these calculations and the temperature structure largely uncertain.
3 Results
The results of our line luminosities and profile calculations (for a subset of the lines) are presented in this section. We note that for simplicity we choose not to follow the convention of using square brackets around forbidden transitions.
3.1 Atlas of line intensities
Tables 1 to 4 list the emission line spectra for the models described in the previous section. The spectra were calculated using the mocassin code and using, as the input density structure, the output of our modified zeus-2d radiation-hydrodynamic calculations. The disk atmosphere is optically thin in the listed lines and therefore radiative transfer calculations in the lines is not necessary. Only a selected subset of lines is included here, however the full set is available upon request from the authors.
The tables are organised as follows. Tables 1 and 3 list the luminosities of the collisionally excited transition of heavy elements and Tables 2 and 4 list a selection of hydrogen and helium recombination lines. Tables 1 and 2 show the results for the primordial disc models with varying X-ray luminosity (Log(LX) = 28.3, 29.3 and 30.3 erg/sec) while Tables 3 and 4 show the results for the inner hole models irradiated by Log(LX) = 30.3 erg/sec and with varying hole sizes.
A casual inspection of these tables immediately reveals that the integrated line luminosities are not very sensitive (factors of two to five at most) to the size of the inner hole for the range considered here (8.3 AU R 30.5 AU). However, inner hole models do produce, in most cases, collisionally excited lines that are approximately a factor two more luminous compared to those of a primordial disc with the same X-ray luminosity. This is due to the different physical conditions in inner hole winds that are less dense and most importantly on average warmer than primordial disc winds.
Line luminosities are, in general, correlated with X-ray luminosity, the response of different lines to changes in LX is however, different for different transitions, and depends on how sensitive to changes in luminosity a line’s emitting region is, and on the dependance of a given emission line to temperature, density or ionisation structure. A number of factors are relevant to determine which region contributes to the emission of a given line. The ionic abundance is of course important; collisionally excited lines of NeII and OI require Ne+ and O0, as well as colliding particles, like (e.g.) electrons and/or neutral hydrogen. HI recombination lines arise in region where there is a non zero abundance of H+ and e-. Another key property is temperature. Collisionally excited lines depend exponentially on the gas temperature through the Boltzmann term and therefore preferentially trace the hotter regions. In the case of collisionally excited lines in the infrared, however, this temperature dependence is weakened by the fact that the gas temperature is generally much higher than the line excitation temperature, causing the Boltzmann term to tend to unity. Recombination lines on the other hand, only have an inverse square root dependence on temperature and therefore are emitted preferentially in cooler regions, as long as these are not completely neutral. Gas density also influences the emissivity of collisionally excited lines through critical density arguments.
It should also be noted that increasing the X-ray luminosity not only affects the ionisation rate of the wind, but also affects its density. Higher luminosities drive a more vigorous (denser) wind, with a roughly linear correlation between LX and gas density in the wind. For the primordial discs presented here the scaling of the density with LX can be understood simply. Given the wind is thermally driven, the specific energy requirements to drive the flow will only depend on the local value of the effective potential. Once a freely expanding wind is established it will remain at approximately constant temperature. Since for transonic/sonic flows the velocity is strongly coupled to the sound speed of the gas, which in turn only depends on the value of the gas temperature, then, for all density and temperature regimes we are interested in, this local specific energy requirement is equivalent to a local temperature condition in the launch region222We have and will implicitly assume that the total input energy from the high energy radiation is sufficient to balance the work done driving any flow. See O10 of a detailed discussion of this condition in relation to X-ray driven photoevaporative winds.. Thus the spatial variation of temperature within the flow is approximately set by the mass of the central star, and will be independent of the local density and X-ray luminosity. Given also that temperature can be expressed as a monotonic function of the ionisation parameter, the spatial variation of the ionisation parameter is approximately fixed by the mass of the central star. Hence, using the definition of the ionisation parameter L and given the value of the ionisation parameter is spatially fixed, at a point constant333Note throughout this paper we use and to distinguish between spherical and cylindrical polar co-ordinates respectfully. we find that gas density LX, as can be seen in the primordial discs shown in Figure 3.
An element-by-element discussion, comments on observability of the various transitions and a comparison with observations and other theoretical investigation is postponed to Section 4
| Species | Wavelength | Line Luminosity L | Species | Wavelength | Line Luminosity L | ||||
|---|---|---|---|---|---|---|---|---|---|
| A | Log(LX)=28.3 | 29.3 | 30.3 | A | Log(LX)=28.3 | 29.3 | 30.3 | ||
| CI | 8729.51 | 1.79E-08 | 8.21E-08 | 5.78E-07 | MgI | 4573.180 | 6.11E-08 | 8.21E-07 | 1.08E-05 |
| CI | 9826.85 | 4.32E-08 | 3.67E-08 | 6.23E-07 | MgI | 4564.670 | 1.37E-09 | 4.73E-09 | 2.16E-08 |
| CI | 9852.99 | 1.27E-07 | 1.06E-08 | 1.16E-06 | MgI | 2852.140 | 8.05E-09 | 1.16E-07 | 1.54E-06 |
| CII | 1577287. | 8.80E-08 | 2.80E-07 | 6.64E-07 | MgII | 2803.530 | 4.77E-09 | 7.92E-08 | 1.28E-06 |
| CII | 2325.400 | 3.13E-09 | 5.60E-08 | 9.43E-07 | MgII | 2796.350 | 9.40E-09 | 1.54E-07 | 2.47E-06 |
| CII | 2324.210 | 3.13E-09 | 5.02E-08 | 5.87E-07 | SiII | 348189.4 | 5.67E-07 | 1.06E-06 | 1.85E-06 |
| CII | 1334.530 | 2.08E-10 | 4.35E-09 | 7.42E-08 | SiII | 2335.120 | 1.20E-10 | 2.03E-09 | 3.24E-08 |
| CII | 2328.840 | 3.73E-09 | 6.67E-08 | 1.11E-06 | SiII | 1808.010 | 1.43E-10 | 2.61E-09 | 4.17E-08 |
| CII | 2327.640 | 9.84E-09 | 1.54E-07 | 1.85E-06 | SiII | 2350.890 | 7.90E-11 | 1.35E-09 | 2.00E-08 |
| CII | 2326.110 | 2.08E-08 | 3.57E-07 | 5.56E-06 | SiII | 2344.920 | 3.87E-10 | 6.57E-09 | 1.00E-07 |
| CII | 1335.660 | 4.02E-11 | 8.60E-10 | 1.48E-08 | SiII | 2335.320 | 5.52E-10 | 9.57E-09 | 1.46E-07 |
| CII | 1335.710 | 3.58E-10 | 7.83E-09 | 1.34E-07 | SiII | 1816.930 | 2.53E-10 | 4.64E-09 | 7.26E-08 |
| OI | 6302.030 | 2.83E-07 | 1.93E-06 | 1.25E-05 | SII | 6732.690 | 2.08E-07 | 1.16E-06 | 1.08E-05 |
| OI | 6365.530 | 9.10E-08 | 6.28E-07 | 4.01E-06 | SII | 6718.310 | 1.41E-07 | 7.44E-07 | 5.72E-06 |
| OI | 2973.160 | 6.11E-10 | 9.18E-09 | 1.06E-07 | SII | 4077.510 | 5.81E-08 | 4.25E-07 | 3.24E-06 |
| OI | 5578.890 | 5.22E-09 | 7.83E-08 | 9.12E-07 | SII | 4069.760 | 2.23E-07 | 1.64E-06 | 1.22E-05 |
| OII | 3729.880 | 1.79E-08 | 1.06E-07 | 6.49E-07 | SII | 10339.23 | 3.87E-08 | 2.80E-07 | 2.16E-06 |
| OII | 3727.090 | 3.58E-08 | 2.51E-07 | 1.85E-06 | SII | 10289.55 | 5.52E-08 | 4.06E-07 | 2.93E-06 |
| OII | 2470.970 | 2.23E-09 | 2.70E-08 | 2.78E-07 | SII | 10373.34 | 1.64E-08 | 1.16E-07 | 9.12E-07 |
| OII | 2471.090 | 6.86E-09 | 8.70E-08 | 8.65E-07 | SII | 10323.33 | 6.56E-08 | 4.83E-07 | 3.55E-06 |
| OII | 7320.910 | 1.79E-09 | 2.12E-08 | 2.16E-07 | SIII | 335008.4 | 1.64E-08 | 1.25E-07 | 1.28E-06 |
| OII | 7321.980 | 4.17E-09 | 5.41E-08 | 5.41E-07 | SIII | 187055.7 | 2.38E-08 | 1.64E-07 | 2.00E-06 |
| OII | 7331.700 | 2.83E-09 | 3.57E-08 | 3.55E-07 | SIII | 9070.050 | 3.58E-09 | 5.41E-08 | 8.19E-07 |
| OII | 7332.780 | 2.23E-09 | 2.90E-08 | 2.93E-07 | SIII | 3722.450 | 2.23E-10 | 5.02E-09 | 8.34E-08 |
| NeII | 128155.8 | 9.25E-08 | 5.51E-07 | 5.41E-06 | SIII | 9532.250 | 2.08E-08 | 3.09E-07 | 4.63E-06 |
| NeIII | 155545.2 | 1.01E-08 | 1.16E-07 | 1.06E-06 | SIII | 1728.950 | 2.23E-11 | 7.73E-10 | 2.16E-08 |
| NeIII | 3869.850 | 2.98E-09 | 6.28E-08 | 8.34E-07 | SIII | 6313.650 | 4.02E-10 | 8.89E-09 | 1.48E-07 |
| NeIII | 360230.6 | 5.96E-10 | 6.47E-09 | 5.72E-08 | SIV | 105108.3 | 4.92E-08 | 2.99E-07 | 3.71E-06 |
| NeIII | 3968.580 | 8.80E-10 | 1.93E-08 | 2.47E-07 | |||||
| Hydrogen | ||||
|---|---|---|---|---|
| Transition | Wavelength | Line Luminosity L | ||
| A | Log(LX)=28.3 | 29.3 | 30.3 | |
| HI | ||||
| 3-2 | 6564.696 | 2.62E-07 | 2.77E-06 | 1.10E-05 |
| 4-2 | 4862.738 | 7.87E-08 | 9.18E-07 | 3.20E-06 |
| 5-2 | 4341.730 | 3.52E-08 | 4.26E-07 | 1.43E-06 |
| 6-2 | 4102.935 | 1.94E-08 | 2.41E-07 | 7.97E-07 |
| 5-3 | 12821.67 | 1.62E-08 | 1.67E-07 | 6.70E-07 |
| 6-3 | 10941.16 | 8.38E-09 | 9.13E-08 | 3.40E-07 |
| 7-3 | 10052.19 | 5.03E-09 | 5.70E-08 | 2.04E-07 |
| 8-3 | 9548.649 | 3.35E-09 | 3.91E-08 | 1.35E-07 |
| 7-4 | 21661.29 | 3.05E-09 | 3.01E-08 | 1.26E-07 |
| 7-5 | 46537.93 | 2.20E-09 | 1.88E-08 | 9.64E-08 |
| 7-6 | 123719.3 | 1.68E-09 | 1.23E-08 | 7.99E-08 |
| 8-7 | 190619.3 | 7.79E-10 | 5.50E-09 | 3.76E-08 |
| 9-7 | 113087.2 | 5.07E-10 | 3.86E-09 | 2.35E-08 |
| HeI | ||||
| 43D-23P | 4473.000 | 8.17E-10 | 1.63E-08 | 3.50E-08 |
| 33P-23S | 3890.000 | 1.81E-09 | 3.79E-08 | 8.50E-08 |
| 33D-23P | 5877.000 | 2.38E-09 | 4.79E-08 | 1.03E-07 |
| 23P-23S | 10833.00 | 1.82E-08 | 4.43E-07 | 1.10E-06 |
| HeII | ||||
| 4-3 | 4689.069 | 1.77e-10 | 3.91e-09 | 5.92e-08 |
| Species | Wavelength | Line Luminosity L | Species | Wavelength | Line Luminosity L | ||||
|---|---|---|---|---|---|---|---|---|---|
| A | Rin=8.3 AU | 14.2 AU | 30.5 AU | A | Rin=8.3 AU | 14.2 AU | 30.5 AU | ||
| CI | 8729.51 | 5.57E-07 | 5.57E-07 | 5.38E-07 | NeIII | 3869.850 | 2.25E-06 | 1.99E-06 | 2.61E-06 |
| CI | 9826.85 | 7.52E-07 | 5.57E-07 | 7.02E-07 | NeIII | 360230.6 | 1.21E-07 | 1.57E-07 | 2.24E-07 |
| CI | 9852.99 | 1.30E-06 | 1.66E-06 | 2.09E-06 | NeIII | 3968.580 | 6.86E-07 | 6.14E-07 | 7.48E-07 |
| CII | 1577287. | 1.12E-06 | 1.41E-06 | 2.09E-06 | NeIV | 2422.360 | 1.56E-08 | 1.90E-09 | 8.98E-08 |
| CII | 2325.400 | 5.03E-07 | 4.48E-07 | 3.96E-07 | MgI | 4573.180 | 1.12E-06 | 9.13E-07 | 6.66E-07 |
| CII | 2324.210 | 5.38E-07 | 4.81E-07 | 4.26E-07 | MgI | 4564.670 | 5.99E-08 | 7.22E-08 | 9.72E-08 |
| CII | 1334.530 | 1.04E-07 | 9.13E-08 | 8.98E-08 | MgI | 2852.140 | 2.69E-07 | 2.32E-07 | 1.87E-07 |
| CII | 2328.840 | 5.99E-07 | 5.31E-07 | 4.71E-07 | MgII | 2803.530 | 1.04E-06 | 9.13E-07 | 7.48E-07 |
| CII | 2327.640 | 1.65E-06 | 1.49E-06 | 1.27E-06 | MgII | 2796.350 | 1.99E-06 | 1.82E-06 | 1.49E-06 |
| CII | 2326.110 | 3.30E-06 | 2.90E-06 | 2.61E-06 | SiII | 348189.4 | 1.65E-06 | 1.66E-06 | 1.87E-06 |
| CII | 1335.660 | 1.99E-08 | 1.74E-08 | 1.79E-08 | SiII | 2335.120 | 1.99E-08 | 1.82E-08 | 1.64E-08 |
| CII | 1335.710 | 1.82E-07 | 1.57E-07 | 1.64E-07 | SiII | 1808.010 | 4.08E-08 | 3.65E-08 | 3.59E-08 |
| OI | 6302.030 | 4.51E-05 | 4.48E-05 | 3.59E-05 | SiII | 2350.890 | 1.30E-08 | 1.16E-08 | 1.12E-08 |
| OI | 6365.530 | 1.39E-05 | 1.41E-05 | 1.12E-05 | SiII | 2344.920 | 6.42E-08 | 5.72E-08 | 5.31E-08 |
| OI | 2973.160 | 1.73E-08 | 1.07E-08 | 5.98E-09 | SiII | 2335.320 | 9.55E-08 | 8.30E-08 | 7.48E-08 |
| OI | 5578.890 | 1.47E-07 | 9.13E-08 | 5.16E-08 | SiII | 1816.930 | 7.21E-08 | 6.39E-08 | 6.28E-08 |
| OII | 3729.880 | 1.91E-06 | 2.32E-06 | 3.44E-06 | SII | 6732.690 | 2.78E-05 | 3.07E-05 | 3.14E-05 |
| OII | 3727.090 | 5.47E-06 | 6.64E-06 | 8.98E-06 | SII | 6718.310 | 1.47E-05 | 1.57E-05 | 1.87E-05 |
| OII | 2470.970 | 9.55E-07 | 9.13E-07 | 7.40E-07 | SII | 4077.510 | 7.73E-06 | 6.64E-06 | 5.01E-06 |
| OII | 2471.090 | 3.30E-06 | 3.15E-06 | 2.76E-06 | SII | 4069.760 | 2.43E-05 | 1.99E-05 | 1.49E-05 |
| OII | 7320.910 | 7.73E-07 | 6.97E-07 | 5.91E-07 | SII | 10339.23 | 5.12E-06 | 4.40E-06 | 3.29E-06 |
| OII | 7321.980 | 2.08E-06 | 1.99E-06 | 1.72E-06 | SII | 10289.55 | 5.90E-06 | 4.89E-06 | 3.59E-06 |
| OII | 7331.700 | 1.30E-06 | 1.16E-06 | 9.72E-07 | SII | 10373.34 | 2.08E-06 | 1.82E-06 | 1.34E-06 |
| OII | 7332.780 | 1.12E-06 | 1.07E-06 | 8.98E-07 | SII | 10323.33 | 6.86E-06 | 5.72E-06 | 4.19E-06 |
| OIII | 883392.2 | 7.03E-08 | 7.72E-08 | 1.12E-07 | SIII | 335008.4 | 1.82E-06 | 1.99E-06 | 2.32E-06 |
| OIII | 518134.7 | 2.78E-07 | 3.23E-07 | 4.71E-07 | SIII | 8830.960 | 1.65E-08 | 1.41E-08 | 1.49E-08 |
| OIII | 4960.290 | 5.38E-07 | 3.98E-07 | 1.87E-06 | SIII | 187055.7 | 3.38E-06 | 3.65E-06 | 4.04E-06 |
| OIII | 2321.670 | 1.39E-08 | 6.22E-09 | 6.88E-08 | SIII | 9070.050 | 1.91E-06 | 1.66E-06 | 1.79E-06 |
| OIII | 5008.240 | 1.65E-06 | 1.16E-06 | 5.53E-06 | SIII | 3722.450 | 1.30E-07 | 1.07E-07 | 1.49E-07 |
| OIII | 1666.150 | 1.91E-08 | 7.30E-09 | 1.12E-07 | SIII | 9532.250 | 1.12E-05 | 9.13E-06 | 1.04E-05 |
| OIII | 4364.450 | 1.56E-08 | 7.05E-09 | 7.48E-08 | SIII | 1728.950 | 2.51E-08 | 1.99E-08 | 4.86E-08 |
| NeII | 128155.8 | 1.21E-05 | 1.16E-05 | 1.04E-05 | SIII | 6313.650 | 2.34E-07 | 1.82E-07 | 2.61E-07 |
| NeIII | 155545.2 | 2.43E-06 | 2.90E-06 | 3.44E-06 | SIV | 105108.3 | 5.73E-06 | 5.64E-06 | 5.08E-06 |
| Transition | Wavelength | Line Luminosity L | ||
|---|---|---|---|---|
| A | 8.3 | 14.2 | 30.5 | |
| 3-2 | 6564.696 | 1.40E-05 | 2.43E-05 | 4.76E-06 |
| 4-2 | 4862.738 | 4.58E-06 | 7.88E-06 | 1.55E-06 |
| 5-2 | 4341.730 | 2.10E-06 | 3.60E-06 | 7.11E-07 |
| 6-2 | 4102.935 | 1.15E-06 | 1.97E-06 | 3.90E-07 |
| 5-3 | 12821.67 | 8.28E-07 | 1.44E-06 | 2.81E-07 |
| 6-3 | 10941.16 | 4.42E-07 | 7.67E-07 | 1.49E-07 |
| 7-3 | 10052.19 | 2.67E-07 | 4.61E-07 | 9.03E-08 |
| 8-3 | 9548.649 | 1.75E-07 | 3.02E-07 | 5.90E-08 |
| 7-4 | 21661.29 | 1.47E-07 | 2.59E-07 | 5.02E-08 |
| 7-5 | 46537.93 | 9.62E-08 | 1.71E-07 | 3.31E-08 |
| 7-6 | 123719.3 | 6.62E-08 | 1.20E-07 | 2.30E-08 |
| 8-7 | 190619.3 | 2.98E-08 | 5.42E-08 | 1.03E-08 |
| 9-7 | 113087.2 | 2.04E-08 | 3.70E-08 | 7.12E-09 |
| HeI | ||||
| 43D-23P | 4473.000 | 2.45E-07 | 2.42E-07 | 2.44E-07 |
| 33P-23S | 3890.000 | 6.09E-07 | 5.94E-07 | 5.98E-07 |
| 33D-23P | 5877.000 | 7.21E-07 | 7.11E-07 | 7.18E-07 |
| 23P-23S | 10833.00 | 7.54E-06 | 6.99E-06 | 6.72E-06 |
| HeII | ||||
| 4-3 | 4689.069 | 1.21031e-07 | 1.08842e-07 | 2.01123e-07 |
3.2 Line profiles
We have used our two-dimensional map of emissivities and gas velocities to reconstruct a three-dimensional cube of the disc and calculate the line-of-sight emission profiles for a number of transitions. The emissivities are calculated using 120 radial points () and 1500 height points (). By assuming azimuthal symmetry about the -axis, and reflection symmetry about the disc mid-plane the resultant 3D grid has dimensions . We adopted a value of and checked that this was large enough to fully resolve the profiles. For the chosen emission lines the disc atmosphere is optically thin and therefore we assume that the line contribution of each parcel of gas can escape freely along the line of sight, provided that this does not intercept the midplane (e.g. Alexander 2008, Schisano et al. 2010). For almost edge-on inclinations escape columns are large enough for dust attenuation to start playing a role. This is not accounted for in this work and the magnitude of this effect depends largely on poorly known parameters such as dust to gas ratios, the degree of dust settling and grain growth in the disc.
The line luminosity is then computed by including a Doppler broadening term in each cell. Hence the line luminosity at a given velocity is computed by evaluating the following integral by direct summation.
| (1) |
Where is the volume averaged power emitted at a point , is the projected gas velocity along the line of sight and is the local thermal velocity (rms velocity) of the emitting atom given by
| (2) |
With the mean molecular weight of the required atom. The resolution of the velocity array is 0.25 km/s.
We have evaluated the profiles of the OI 6300Å, the NeII 12.8m and a generic HI recombination line, as these have been the focus of recent observational studies (e.g. HEG95, Pascucci & Sterzik 2009; Najita et al 2009). Profiles for any of the lines listed in the table (and many others that are not) can easily be calculated upon request by the authors.
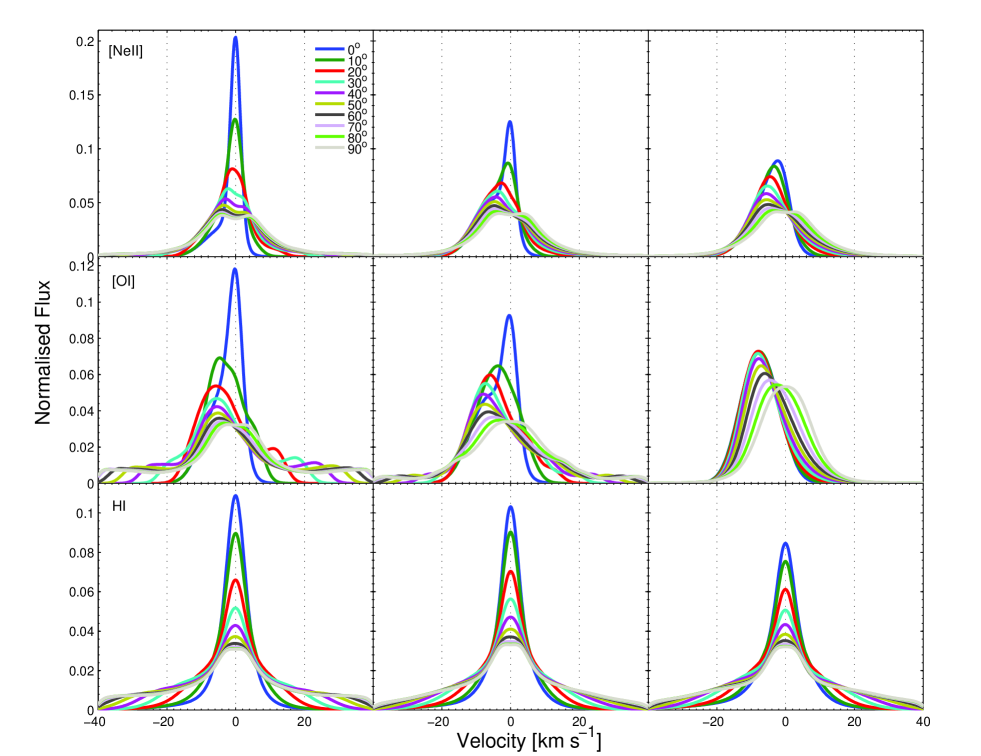
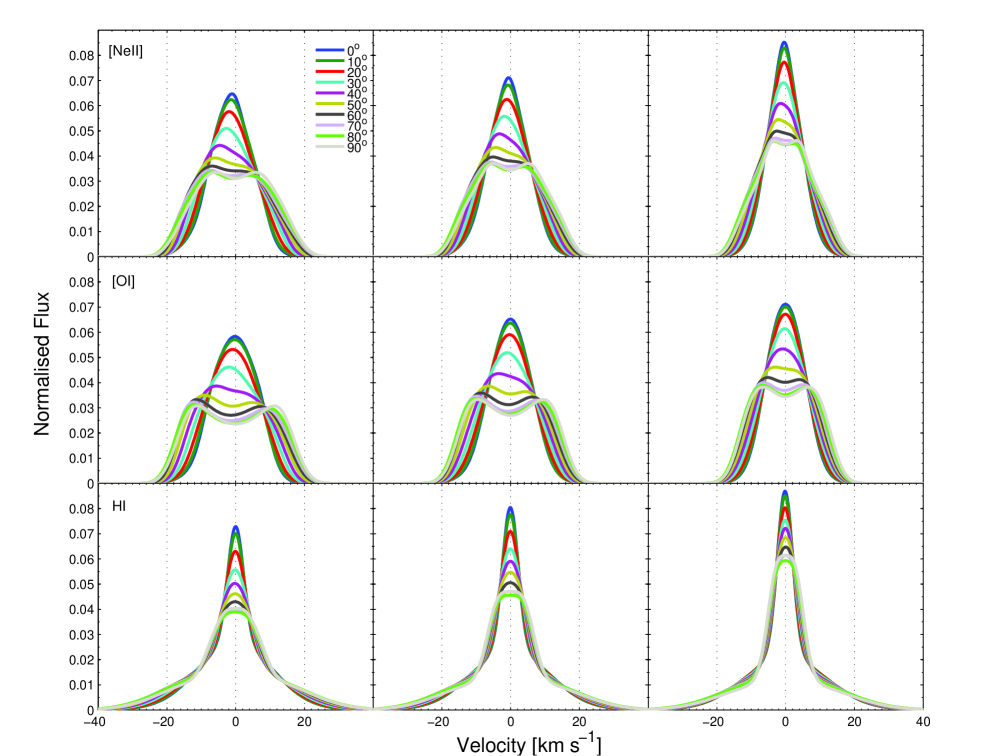
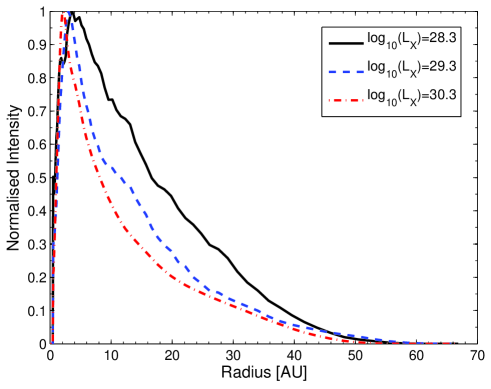
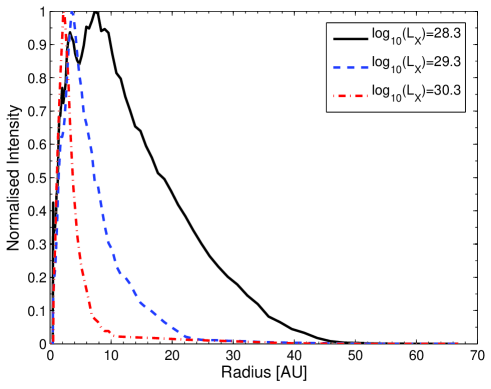
Figure 1 shows the normalised profiles of the NeII fine structure line at 12.8m, the OI forbidden line at 6300 Å and a hydrogen recombination line for the primordial disc model with Log(LX) = 28.3 erg/s (left), 29.3 erg/s (middle) and 30.3 erg/s (right). Figure 2 shows the same line profiles for inner-hole models with Log(LX) = 30.3 erg/s and inner hole radii of 8.3 AU (left), 14.2 AU (middle) and 30.5 AU (right). Profiles are computed for ten inclination angles from 0o to 90o degrees in steps of 10o. The profiles were degraded to an instrumental resolution of R = 100000, typical of current ground based facilities.
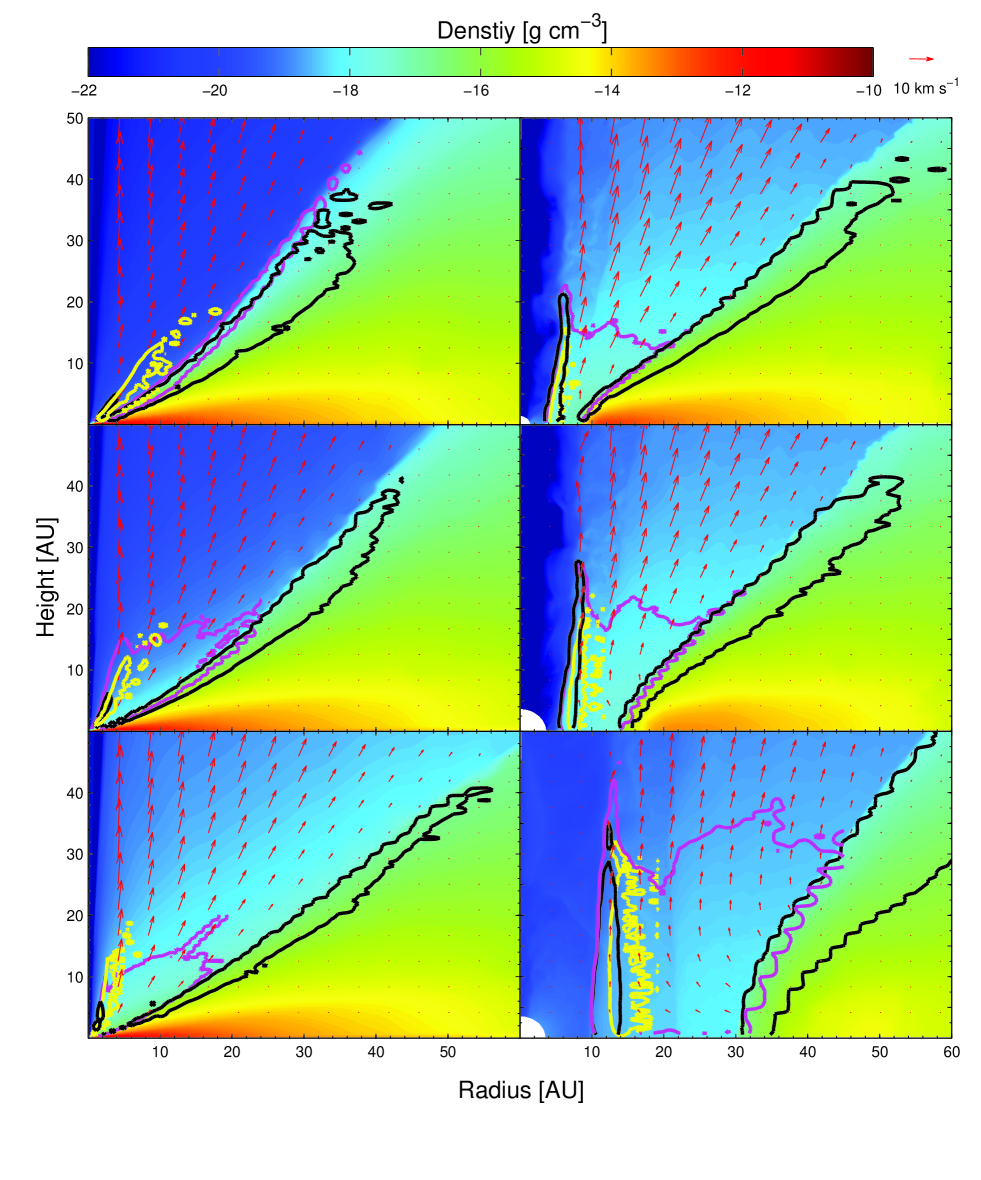
Figure 3 shows 2D density maps (colour gradients) of the primordial disc (left panels) and inner-hole models (right panels), respectively, with velocity vectors overlain. The models from top to bottom are for increasing X-ray luminosities (left) and increasing inner hole radii (right). The black, magenta and yellow contours delineate the region containing 85% of the emission for the HI recombination lines, the NeII 12.8m444The NeIII 15.5m region is very similar. and the OI 6300Å, respectively. The noisy appearance of some of the emitting regions are due to Monte Carlo fluctuations and the imposition of a hard cut-off to draw the contours. We have checked that the noise does not affect luminosities and line profiles to more than a 5% level.
The OI 6300Å line (yellow contours) originates almost exclusively in the wind or in the very inner (hot and bound- AU) region of the disc (in the primordial case), which is where the temperatures are high enough to populate its upper level. The same would be true for all collisionally excited optical and UV lines. It is the contribution from the bound hot inner disc that produces the ’winged’ profiles for the OI 6300Å clearly seen in the lower luminosity primordial models.
The NeII mid-infrared (MIR) lines can arise in much cooler regions and therefore, while still predominantly produced in the wind, they are not confined to the hot inner layers, but span over a larger region. The NeII emitting region (magenta contours in Figure 3) and line profiles vary significantly with X-ray luminosity, tracing the highest electron density regions (L(NeII) n).
The profiles of HI recombination lines are more complicated as they have contributions arising both from the wind and from the bound disc. However, as will be discussed later, our models underpredict the luminosities of observed IR hydrogen recombination lines by one or two orders of magnitude (Pascucci et al 2007; Ratzka et al 2007; Najita et al 2010) and underpredict the luminosities of observed Pa and Br lines by four orders of magnitude (Muzerolle et al, 1998), implying that the emission must be dominated by regions that are not included in our models (e.g. dense plasma close to the star). The resulting line profiles may therefore bear little resemblance to those shown in this paper. The left panels of Figure 3 (black contours) show that in the primordial disc models there is only a small wind contribution, which results in the hydrogen recombination profiles showing no blue-shift atall. While inner hole models have larger wind contributions to the HI recombination lines, the resulting profiles are still not blue-shifted, although this is virtually true for all line profiles from inner hole models, even those formed exclusively in the wind.
The reason why inner hole models produce very small or no blue-shifts is that at low inclinations both the blue and red-shifted components of the wind are visible through the hole, resulting in only a small, often undetectable, blue-shift. At higher inclination the lines are Keplerian and no blue-shift is expected anyway. We will discuss the significance of this result in the next section, when comparisons are made with observations, but we note at this point that this is only true if the winds are optically thin to the lines in question.
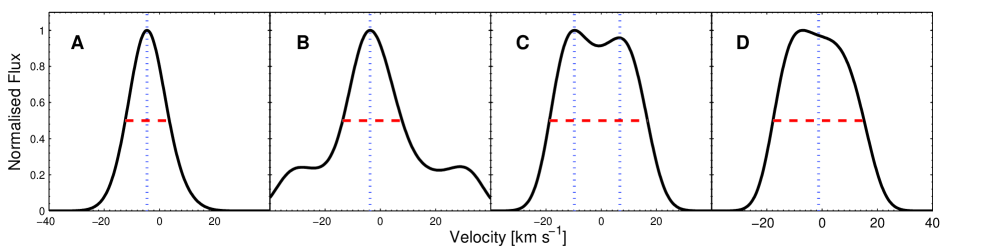
To aid comparison with observations we have summarised the main profile characteristics in Tables 5 and 6. These include the velocity of the peak(s), , the full-width-half-maxima (FWHM) and the profile “type”. We have classified the profiles with four main types as shown in Figure 4. Type “A” is a single peaked profile that could be well approximated by a Gaussian. Type “B” is a single peaked Gaussian-like profile, but with large wings. This is generally produced when there is both a wind and bound disc contribution to the line and/or the emission region is spread over a large radial domain. Type “C” is a double peaked profile, in this case the two values of are given. Type “D” are profiles where two clear peaks are not resolved, yet the profile is broad, flat-topped or significantly asymmetric; in this case the value at the centre of the line (i.e. the middle of the FWHM segment, horizontal dashed red line in Figure 4) is given; strictly speaking, this is not the location of the ’peak’ however we keep the label for simplicity.
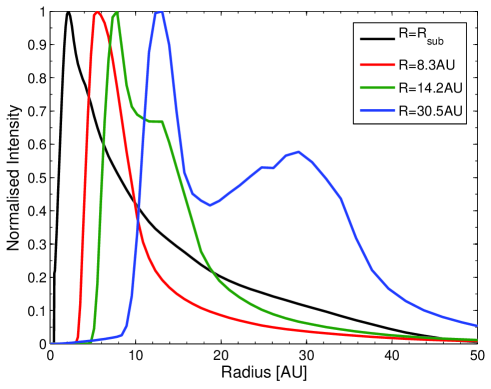
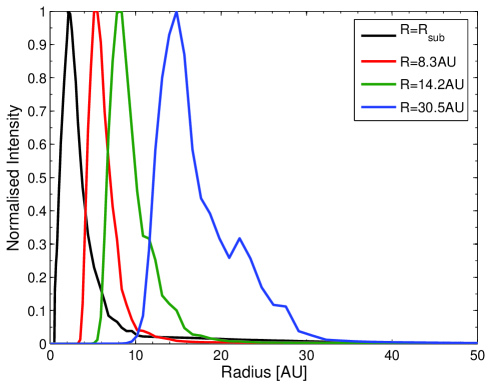
3.3 NeII 12.8m and OI 6300Å radial profiles
The model’s radial intensity profiles of the NeII 12.8m and of the OI 6300Å line are shown in the left and right panels of Figure 5. The top panels show the response of the radial intensity profiles of these lines to changes in the X-ray luminosity. Wider profiles are expected for lower X-ray luminosities since these drive a wind that is less dense than in the higher X-ray luminosity case, meaning that the emission region is more extended. The bottom panels of Figure 5 show the radial intensity profiles for discs irradiated by the same X-ray luminosity (21030erg/sec), with the black line representing a primordial disc and the red, green and blue lines representing discs with inner holes of size 8.3, 14.2 and 30.5 AU, respectively. Both the NeII and OI lines show a very clear sequence with inner hole size suggesting that spectro-astrometry (e.g. Pontoppidan et al 2009) may perhaps be used to test the evolutionary states of gaseous discs in the clearing phase. We draw attention to the fact that the peak of the emission in all inner-hole cases is at radii smaller than the dust inner radius of the disc. This is obvious by looking at the structure of the wind and the location of the emission region (see Figure 3). So the presence of gas in the inner hole of these objects is simply due to gas that is being photoevaporated from the inner edge of the disc.
3.4 Caveats and limitations
Before moving on to a comparison of our results with observations it is worth stating a few caveats and limitations of our models.
-
•
It is important to realise that the current models can only provide a snapshot of the various flow solutions and line profiles that will arise. This means that it is currently not possible to present any form of ’interpolation’ scheme for the line profiles and only general trends can be qualitatively extracted. There are two main reasons for this: (i) Most of the emitting regions (see Figure 3) is located in the subsonic region of the flow. In this region the flow velocity and direction is strongly and non-linearly affected by the interaction between the centrifugal force term and velocity divergence along the stream line (Ercolano et al. 2009a). Hence the variation of the blue shift with inclination and X-ray luminosity can only be understood in a qualitative way. The lack of a simple relation between line luminosity and inclination or X-ray luminosity is particularly evident in the behaviour of the OI line. (ii) The emitting region that dominates the luminosity for a given line can be considered a function of three variable: temperature, gas density and electron/ion fraction. All three influence the emissivity of a given pocket of gas and the effect they have on each other again arises from highly non-linear phenomena, meaning the emission region can change smoothly with X-ray luminosity (e.g. HI) or smoothly for some values of X-ray luminosity (e.g. L erg/s) and rapidly for others (e.g. L erg/s), as in the NeII line.
-
•
The ionising spectrum, particularly in the soft X-ray and EUV range, is somewhat uncertain. Observations of this part of the spectrum are hindered by absorption from interstellar hydrogen along the line of sight or closer to the star. While we have attempted to use a realistic spectrum (see Section 2 and discussion in Ercolano et al. 2009a), it is very likely that T-Tauri stars posses a range of spectra of different hardness. Accretion funnels close to the star may also screen the disc from EUV and soft X-ray effectively changing the hardness of the radiation field seen by the disc. The effects of screening on photoevaporation rates have been explored and discussed in detail by Ercolano et al (2009a).
-
•
Our models assume azimuthal symmetry, however the effects of (possibly inclined) magnetic fields on corotation radius may cause twists and warps at the disc’s inner edge (e.g. Bouvier et al 2007; Romanova et al 2003; Long et al 2007). Furthermore accretion funnels may only screen a fraction of the radiation resulting in azimuthally varying irradiation. As the structure of magnetic fields around T-Tauri stars is becoming clearer through observations and modeling (Donati et al 2007, 2008; Gregory et al 2008; Jardine 2008; Hussain et al 2009; Skelly et al 2009), it will be very interesting to test these effects on photoevaporation and disc emission.
-
•
The models presented in this paper are for a 0.7 M⊙ star. It is difficult to extrapolate these results to different mass stars, however models appropriate for different mass stars are currently being developed (Owen et al 2010b, in prep).
-
•
Our models do not account for molecular chemistry. While this is unlikely to produce a significant error in the photoevaporation rates and wind structure (see discussion in O10), it may affect the luminosities of low excitation temperature emission lines from neutral species (e.g. fine structure lines of OI and CI), which are produced in a region close to the atomic/molecular transition (the photodissociation region, PDR). We note that all the lines listed in Tables 1 to 4, however, are not significantly affected by the PDR, due to their high excitation temperatures (optical/UV collisionally excited lines) and/or ionisation requirements.
-
•
Excitation rates of Ne+ by collisions with neutrals are not known, therefore theoretical calculations of this line, including this work, only account for collisions with electrons. This is likely to result in the NeII 12.8m line being underestimated by a factor of 2 (Glassgold et al 2007).
-
•
The underlying disc flaring could be important since it determines the solid angle subtended by the disc to the ionising radiation. Owen et al (2010) briefly discuss this point with regards to mass loss rates in their Section 5, point vii. A discussion of the effects of flaring on line luminosities, specifically for the case of the NeII 12.8m and NeIII 15.3m lines, is given by Schisano, Ercolano & Güdel (2010).
4 Discussion: The emission line spectra
| NeII 12.8m | |||||||||
| Log(LX)= 28.3 erg/s | Log(LX)= 29.3 erg/s | Log(LX)= 30.3 erg/s | |||||||
| io | vpeak | FWHM | Profile | vpeak | FWHM | Profile | vpeak | FWHM | Profile |
| [km/s] | [km/s] | [km/s] | [km/s] | [km/s] | [km/s] | ||||
| 0 | 0 | 3.7 | B | -0.25 | 5.0 | B | -2.25 | 10.2 | A |
| 10 | -0.25 | 6.0 | A | -0.75 | 10.8 | B | -3.25 | 10.6 | A |
| 20 | -1 | 10.1 | A | -2.75 | 13.9 | A | -4.5 | 11.9 | A |
| 30 | -1.25 | 13.6 | D | -3.75 | 15.4 | A | -5.25 | 13.4 | A |
| 40 | -3/+1.75 | 15.9 | C | -4.25 | 16.6 | A | -5.5 | 15.0 | A |
| 50 | -3.5/+2 | 17.6 | C | -4.75 | 17.6 | A | -5.5 | 16.5 | A |
| 60 | -3.75/+2.5 | 18.9 | C | -2.25 | 18.6 | D | -5 | 17.8 | A |
| 70 | -4/+3 | 19.8 | C | -4.75/+0.75 | 19.4 | C | -4.5 | 19.0 | A |
| 80 | -4/+3.5 | 20.4 | C | -4.25/+1.75 | 20.0 | C | -3.75 | 19.8 | A |
| 90 | 3.75 | 20.8 | C | 3.25 | 20.6 | C | 2.5 | 22.6 | C |
| OI 6300 Å | |||||||||
| Log(LX)= 28.3 erg/s | Log(LX)= 29.3 erg/s | Log(LX)= 30.3 erg/s | |||||||
| io | vpeak | FWHM | Profile | vpeak | FWHM | Profile | vpeak | FWHM | Profile |
| [km/s] | [km/s] | [km/s] | [km/s] | [km/s] | [km/s] | ||||
| 0 | -0.25 | 6.4 | A | -0.5 | 10.0 | B | -7.5 | 13.3 | A |
| 10 | -4.75 | 14.0 | A | -3.75 | 15.0 | B | -7.75 | 13.0 | A |
| 20 | -5.75 | 15.9 | B | -6 | 15.2 | B | -8 | 12.6 | A |
| 30 | -5.5 | 16.0 | B | -7.25 | 14.6 | B | -8 | 12.6 | A |
| 40 | -5.5 | 16.2 | B | -8 | 16.0 | B | -7.75 | 13.1 | A |
| 50 | -5.25 | 17.0 | B | -7.5 | 18.0 | B | -7.25 | 13.9 | A |
| 60 | -4.75 | 17.8 | B | -6.5 | 20.1 | B | -6 | 15.0 | A |
| 70 | -4.25 | 18.5 | B | -5 | 21.7 | B | -4.5 | 16.0 | A |
| 80 | -3.5 | 19.1 | B | -3.25 | 22.7 | B | -2.5 | 16.7 | A |
| 90 | 0 | 19.5 | B | 0 | 23.1 | B | 0 | 17.0 | A |
| Hydrogen recombination lines | |||||||||
| Log(LX) = 28.3 erg/s | Log(LX = 29.3 erg/s | Log(LX = 30.3 erg/s | |||||||
| io | vpeak | FWHM | Profile | vpeak | FWHM | Profile | vpeak | FWHM | Profile |
| [km/s] | [km/s] | [km/s] | [km/s] | [km/s] | [km/s] | ||||
| 0 | 0 | 7.2 | A | 0 | 7.0 | A | 0 | 8.2 | A |
| 10 | 0 | 8.2 | A | 0 | 7.6 | A | 0 | 8.9 | A |
| 20 | 0 | 9.8 | A | 0 | 9.2 | A | 0 | 10.1 | A |
| 30 | 0 | 11.5 | B | 0 | 10.9 | B | 0 | 11.4 | B |
| 40 | 0 | 13.4 | B | 0 | 12.8 | B | 0 | 12.9 | B |
| 50 | -0.25 | 15.3 | B | 0 | 14.6 | B | -0.25 | 14.4 | B |
| 60 | -0.25 | 16.9 | B | -0.25 | 16.2 | B | -0.25 | 15.7 | B |
| 70 | -0.5 | 18.1 | B | -0.5 | 17.5 | B | -0.25 | 16.8 | B |
| 80 | -1 | 18.9 | B | 0 | 18.2 | B | -0.25 | 17.4 | B |
| 90 | 1 | 19.2 | C | 1 | 18.5 | C | 0 | 24.5 | B |
| NeII 12.8m | |||||||||
|---|---|---|---|---|---|---|---|---|---|
| Rin = 8.3 AU | Rin = 14.2 AU | Rin = 30.5 AU | |||||||
| io | vpeak | FWHM | Profile | vpeak | FWHM | Profile | vpeak | FWHM | Profile |
| [km/s] | [km/s] | [km/s] | [km/s] | [km/s] | [km/s] | ||||
| 0 | -1 | 15.0 | A | -0.5 | 13.3 | A | -0.5 | 10.9 | A |
| 10 | -1.25 | 15.4 | A | -0.75 | 13.9 | A | -0.5 | 11.2 | A |
| 20 | -2 | 16.7 | A | -1.25 | 15.2 | A | -0.5 | 12.1 | A |
| 30 | -2.75 | 19.7 | A | -1.75 | 17.6 | A | -0.75 | 13.7 | A |
| 40 | -1.5 | 23.3 | D | -1 | 20.8 | D | -1.5 | 15.9 | A |
| 50 | -1.5 | 26.2 | D | -1 | 23.5 | D | -0.5 | 18.2 | D |
| 60 | -1.5 | 28.4 | D | -1.25 | 25.8 | D | -0.75 | 20.0 | D |
| 70 | -7.25/+2.5 | 29.8 | C | -5.75/+2.25 | 27.2 | C | -3/+1.5 | 21.3 | C |
| 80 | -7/+4.25 | 30.2 | C | -5.75/+3.75 | 27.8 | C | -3.25/+2.25 | 21.7 | C |
| 90 | 5.75 | 30.1 | C | -5/+5 | 27.5 | C | 3.25 | 21.3 | C |
| OI 6300 Å | |||||||||
| Rin = 8.3 AU | Rin = 14.2 AU | Rin = 30.5 AU | |||||||
| io | vpeak | FWHM | Profile | vpeak | FWHM | Profile | vpeak | FWHM | Profile |
| [km/s] | [km/s] | [km/s] | [km/s] | [km/s] | [km/s] | ||||
| 0 | -0.25 | 17.1 | A | 0 | 14.7 | A | 0 | 13.5 | A |
| 10 | -0.25 | 17.2 | A | 0 | 15.0 | A | 0 | 13.6 | A |
| 20 | -1 | 18.6 | A | -0.25 | 16.2 | A | 0 | 14.2 | A |
| 30 | -2 | 22.4 | A | -1 | 19.1 | A | -0.25 | 15.7 | A |
| 40 | -0.75 | 26.9 | D | -0.5 | 23.3 | D | -0.75 | 18.5 | A |
| 50 | -9/+5 | 30.1 | C | -6.5/+4.25 | 26.6 | C | -0.25 | 21.5 | D |
| 60 | -11.25/+7.25 | 32.4 | C | -8.75/+6.25 | 28.9 | C | -5.25/+4 | 23.8 | C |
| 70 | -12.25/+8.75 | 34.0 | C | -9.75/+7.75 | 30.5 | C | -6.25/+5.25 | 25.3 | C |
| 80 | -12/+10.25 | 34.9 | C | -10/+8.5 | 31.4 | C | -6.75/+5.75 | 26.2 | C |
| 90 | 11.25 | 35.0 | C | 9.5 | 31.6 | C | 6.5 | 26.5 | C |
| Hydrogen recombination lines | |||||||||
| Rin = 8.3 AU | Rin = 14.2 AU | Rin = 30.5 AU | |||||||
| io | vpeak | FWHM | Profile | vpeak | FWHM | Profile | vpeak | FWHM | Profile |
| [km/s] | [km/s] | [km/s] | [km/s] | [km/s] | [km/s] | ||||
| 0 | 0 | 7.8 | B | 0 | 7.1 | B | -0.25 | 6.5 | B |
| 10 | 0 | 8.3 | B | 0 | 7.4 | B | -0.25 | 6.7 | B |
| 20 | 0 | 9.9 | B | 0 | 8.5 | B | -0.25 | 7.3 | B |
| 30 | -0.25 | 11.8 | B | 0 | 10.0 | B | -0.25 | 8.1 | B |
| 40 | -0.25 | 13.6 | B | 0 | 11.2 | B | 0 | 8.8 | B |
| 50 | -0.25 | 15.1 | B | 0 | 12.5 | B | 0 | 9.6 | B |
| 60 | -0.25 | 16.6 | B | 0 | 13.8 | B | 0 | 10.4 | B |
| 70 | -0.25 | 18.1 | B | -0.25 | 15.0 | B | 0 | 11.1 | B |
| 80 | -0.25 | 19.0 | B | -0.25 | 15.7 | B | 0 | 11.7 | B |
| 90 | 0 | 18.7 | B | 0.75 | 15.7 | C | 0 | 11.8 | B |
The general behaviour of emission line intensities with X-ray luminosity and inner hole size has already been discussion in Section 3.1. Here we further comment on an element-by-element basis on the significance and observability of some of the transitions.
4.1 Carbon
CI fine-structure lines are produced in a region that is very close to the atomic to molecular transition. The luminosities calculated by mocassin for these transitions are likely to carry some error and have therefore been omitted from the table and will be discussed in a forthcoming paper where a simplified chemical network is included. These lines may be interesting as probes of the gas at larger radii (e.g. Ercolano et al 2009b).
The CII fine structure line at 157m, however, should be less affected by the molecular/atomic transition and therefore we discuss it further here. We report a luminosity of 10 for an X-ray luminosity of 21030erg/sec, this should make this line an interesting target for Herschel observations. We note that the luminosity we predict for this line is almost three orders of magnitude larger than what was calculated by Meijerink et al. (2008); as discussed in Ercolano et al (2008b), the low critical density for this line (49 cm-3) implies that it will be preferentially emitted in low density regions, such as the upper disc atmosphere and the flow, which were not included in the Meijerink calculations.
We also list a number of UV lines from CII, which are emitted predominantly in the wind; the strongest of these transitions is the doublet at 2327 Å.
4.2 Oxygen
As in the case of carbon, we limit our discussion of neutral oxygen emission to forbidden lines with high temperature Boltzmann terms and exclude the OI fine-structure lines that may be uncertain in our calculations for the reasons discussed above.
The OI 6300Å forbidden line deserves special attention. This line was detected by HEG95 in the spectra of several T-Tauri stars. Detection of this line in T-Tauri stars has been reported by various other authors including White & Hillenbrand (2004) and Mohanty et al (2005). The OI 6300Å line profiles reported by HEG95 all showed a double peak, with one component blue-shifted to a few hundred km/s (high velocity component HVC) and a second component typically blue-shifted by only a few km/s (low velocity component, LVC). The HVC is generally attributed to spatially unresolved emission from a dense jet close to the star. The LVC, seen also in other forbidden lines, such as OI 5577 Å, and SII 6731 Å, was interpreted by these authors as being produced in a slow moving disc wind. This was evidenced by the fact that blue-shifts were largest for forbidden lines of lowest critical density, suggesting that the low velocity component accelerates away from the surface of the disc. HEG95 also noted that all optically thick discs that they observed had LVC forbidden line emission detections. Furthermore, all the LVCs were blue-shifted to within the measurements errors (2 km/s), leading them to conclude that, if the LVC arises from a disc wind, then all objects with optically thick inner discs must have a disc wind.
While HEG95 did not ascertain the nature of the disc wind, a photoevaporative wind origin was investigated by Font et al (2004), who explored the ability of an EUV-driven photoevaporative wind to explain the LVC lines observed in the HEG95 spectra. They obtained encouraging results, which showed that forbidden line luminosities roughly of the observed magnitude can be produced in the ionised wind from an EUV-photoevaporated disc, and highlighted instead the failure of magnetic wind models in producing these lines. They identified, however, a discrepancy between their model and the observations in the luminosity of the OI 6300 Å line which remained underpredicted by approximately two orders of magnitude in their models.
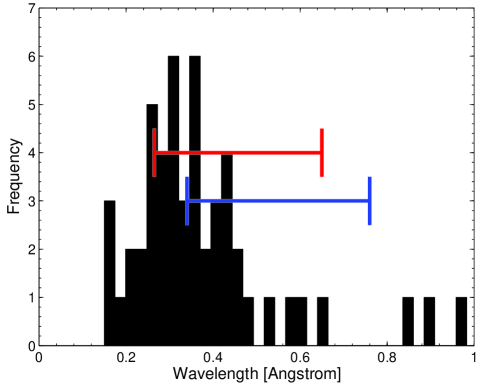
The failure of the Font et al (2004) calculations to reproduce the observed OI 6300Å line luminosities results from the fact that an EUV-driven wind is, by construction, fully ionised. The OI 6300Å line can only then be produced in a thin layer at the bottom of the photoevaporating (ionised) layer. An X-ray driven photoevaporation process, however, yields a disc wind that is predominantly neutral, thus allowing abundant production of the OI 6300Å line. Indeed we predict luminosities of a few 10-5 L⊙ for LX = 21030erg/s, roughly two orders of magnitude higher than the value predicted by Font et al. (2004) and in the range of values reported by HEG94. Figure 6 shows a comparison of equivalent widths observed in the LVC of OI 6300Å by HEG95 (black histogram) to the those predicted by our models (red and blue line). The red line represents the primordial disc models irradiated by X-ray luminosities between 21028 and 21030 erg/sec and the blue line corresponds to inner hole sources with hole sizes between 8 and 30 AU irradiated by an X-ray luminosity of 21030 erg/sec. The higher equivalent widths shown on the histogram are lines where even the LVC velocity range (-60 to 60 km s-1) is saturated by emission from a jet (the x-axis is truncated in this plot and could go up to 7Å). We note however that the range of hole sizes that we have investigated is restricted, furthermore we do not have any inner-hole models for lower luminosity.
The OI 6300Å line is produced by collisional excitation, with neutral hydrogen being the dominant collider (rates from Launay & Roueff, 1977). We stress that in T-Tauri stars with winds collisional excitation of the 1D2 level of O will be the dominant production mechanism of the OI 6300Å line and not OH dissociation. UV photodissociation of OH, which may lead to branching to the excited 1D2 level of neutral O, producing fluorescent emission of the OI 6300Å and OI 6363Å lines (Störzer & Hollenbach 2000) is generally ruled out for the HEG95 sample by the fact that too large FUV fields are required and because of the difficulty in reproducing the observed OI 6300 Å / OI 5577 Å ratio (see also discussion in Störzer & Hollenbach 2000 and Font et al. 2004).
The luminosity of the OI 5577 Å is underpredicted by our models compared to the HEG95 observations. This is, however, not a cause of concern, since this is most likely due to the fact that collisions with neutral hydrogen (which are likely to dominate as in the case of the OI 6300 Å line) are not included in our calculation, due to the unavailability of collision rates for the 1S0 level (Launay & Roueff, 1977, only include the first four levels, 3P2, 3P1, 3P0 and 1D2). The OI 2973 Å line is also a lower limit in our model for the same reason.
In brief, an X-ray driven wind model offers a natural route to the production of the observed LVC of the OI 6300 Å emission line. In the next section we will discuss the profiles we obtained for this line and compare them with observations.
Finally, OII and OIII forbidden lines are also listed in Tables 1 and 3. OIII forbidden lines are not very strong for primordial disc models and therefore are only listed for inner-hole models. Inner hole model winds are less dense and hotter than those of primordial discs, hence favouring the production of nebular-like lines like the OII and OIII listed in the table. We draw particular attention to the OIII 88.3m line, which has luminosities of around 10-7L⊙ for inner hole sources, and may be just detectable with PACS for the nearer sources.
4.3 Neon
Since the prediction by Glassgold et al (2007) and the first detections of the NeII 12.8 m line in T-Tauri discs (Pascucci et al 2007; Espaillat et al 2007; Lahuis et al 2007; Herczeg et al 2007), this line has received a lot of attention in the literature, both observationally (Güdel et al 2010, submitted; Pascucci & Sterzik 2009; Najita et al 2009; Pascucci et al 2009; van Boekel et al 2009; Flaccomio et al 2009) and theoretically (Meijerink et al, 2008; Schisano et al. 2009; Alexander 2008; Hollenbach & Gorti 2009). This line was originally proposed as a new probe of X-ray irradiation of T-Tauri discs, but a clean correlation with X-ray luminosity does not seem to exist even in the latest data. The large scatter in the L(NeII) for stars of a given LX may be due to differences in the irradiating spectrum or the disc structure (Schisano et al 2009), variability, or, for the higher L(NeII) cases, to stellar jets (Hollenbach & Gorti 2009; Shang et al 2010, submitted).
The L(NeII) we calculate from our models are in the range of those observed and show a roughly linear dependance with X-ray luminosity (see also Section 3.1). What our models show, however, is that this line is produced almost exclusively in the photoevaporating wind, as clear from the blue-shifted profile for non-edge on inclinations (Table 5 and Figure 1). This opens the exciting prospect of using this line as a probe of photoevaporative winds as we will discuss further in the next Section. It is also clear that a clean linear relationship with LX is not expected (or found) given that the wind structure and the NeII emitting region change in response to different X-ray luminosities. In this perspective it is easy to understand the scatter in the L(NeII)-LX relation noticed by Güdel et al (2010, submitted) even for the non-jet sources.
L(NeII) is about a factor of two larger for inner-hole models than a primordial model of the same X-ray luminosity and this is simply due to the larger emission region of the inner-hole sources (see Figure 3). We note that while Schisano et al. (2009) used disc-only models to probe the dispersion in the L(Ne)-LX relationship, many of their conclusions with regards to the nature of the scatter (e.g. hardness of the ionising radiation field) are equally applicable to a line that is produced in the wind.
The NeIII to NeII ratio for our models is never lower than 0.1, while observations generally indicate lower values, e.g. 0.06 (Lahuis et al 2007), 0.045 (Najita et al 2010), although in the case of WL5 a value of 0.25 is reported by Flaccomio et al (2009). Unfortunately only very few detections of this line are currently available and it is therefore hard to draw statistically significant conclusions. To make matters worse this ratio is quite uncertain in theoretical models due to the lack of neutral collision rates, as mentioned in Section 3.1, and uncertainties in the charge exchange coefficients. In view of the current observational and theoretical difficulties with this line ratio, its diagnostic power cannot yet be harnessed.
4.4 Magnesium
We predict a rather strong MgI line at 4573 Å (10-5L⊙ for LX = 21030erg/sec). This line has been detected to date, in three young low mass stars, namely VY Tauri (M0; Herbig 1990), XZ Tau B (M1; White & Ghez 2001) and very recently in the low-mass variable TWA 30 (Looper et al. 2010, submitted). Detection of this line in M-stars is rendered possible by the much lower stellar continuum in the B-band compared to higher mass stars. The strength of this line implies that it could be an important coolant and should be considered when thermal calculation are carried out.
4.5 Silicon
We include Si lines in Tables 1 and 3 and draw the reader’s attention to the SiII 34.8m transition which has a luminosity of approximately 10-6L⊙ for LX = 1030erg/sec. We caution however that Si lines and Mg lines are strongly affected by depletion onto dust grains which is very poorly constrained. While a hindrance for the prediction of accurate line luminosities, the dependance of this lines on depletion factors may actually be used to obtain clues about the disc evolution through comparison of models with observations.
4.6 Sulfur
We predict a number of SII, SIII and SIV lines all with fairly large luminosities. In particular our models predict SII 6717Å and 6731Å lines in the range observed by HEG95555Note that here we only compare with HEG95 for the LVC detections. The ratio of the 6731Å to the 6717Å, which is a useful density diagnostic, is approximately two in our models, and it compares well with the value reported for most of the sources in HEG95. A ratio of two at 7000 K corresponds to an electron density of just below 104cm-3, again consistent with a wind origin of this line. Furthermore, all of the detections for the LVCs of these lines in HEG95 show a small blue-shift, reinforcing the conclusion that all discs show evidence of a wind which can be produced by photoevaporation. The OI to SII ratios also compare favorably, when the OI line luminosites observed are in the range predicted by the model (i.e. L⊙), however we note that this ratio can be as large a one order of magnitude for the higher OI luminosities detected by HEG95, these detections correspond to objects where the jet emission has saturated the LVC and are associated with large equivalent widths in the LVC OI line (e.g. CW Tau, DQ Tau and HN Tau).
4.7 Hydrogen
Tables 2 and 4 show the luminosities of the hydrogen recombination lines. The HI(7-6) and HI(6-5) transition were detected by Pascucci et al. (2007), Ratzka et al. (2007), and a larger set of IR lines have been detected from the transition object TW Hya by Najita et al. (2010). The reported luminosities of those lines are of the same magnitude as for the NeII 12.8m line also detected in the same objects. Our models, on the other hand, can only produce hydrogen recombination lines that are almost two orders of magnitude less luminous than the NeII 12.8m. It seems therefore unlikely that a disc or wind origin can explain the reported hydrogen recombination line luminosities. This had already been noticed by Hollenbach & Gorti (2008), who analytically derive L(HI 7-6)/L(NeII)0.008, similar to what we find (0.015). We agree with Hollenbach & Gorti’s conclusion that these IR hydrogen lines must originate in a region of very dense plasma (where NeII 12.8m would be collisionally quenched) close in to the star, possibly in an accretion shock. This is in line with earlier works (e.g. Hartmann et al 2004; Muzerolle et al 1998, 2000; Kurosawa et al 2005) that H recombination lines mostly originate in the magnetospheric accretion flow.
5 Discussion: Blue-shifted line profiles, a smoking gun for photoevaporation
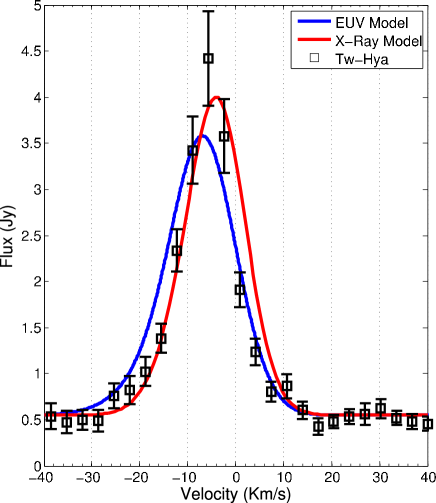
The recent observation of a blue-shifted NeII 12.8m line profile by Pascucci et al. (2009, P09) in a few well known YSOs with discs, including TW Hya, has been interpreted as evidence for photoevaporation. As shown by Alexander (2008) the EUV-wind solution of Font et al. (2004) produces a good match to the data (red line in Figure 7), as does the X-ray driven wind of O10 discussed in this paper (blue line in Figure 7). The X-ray wind model used for this figure is that of the primordial disc model irradiated by an X-ray luminosity, Log(LX) = 30.2 erg/sec. We stress that neither the EUV-wind or X-ray wind models were statistically fit to the data to produce the match. In both cases a model was chosen from the set of existing ones that best reproduced the observations. Both the EUV wind and the X-ray wind models initial parameters could be tweaked to produce a perfect fit to the data, but this was not attempted in this paper or by Alexander (2008) as the point of Figure 7 is only to show that profiles in the range of those observed can be reproduced by photoevaporation models.
As both the EUV- and X-ray model produce a good match to the NeII data, it seems that this particular diagnostic cannot be used to discriminate between them. The OI 6300Å line intensities and LVC profiles, on the other hand, can only be reproduced by an X-ray driven photoevaporation model, which predicts a largely neutral wind.
While a blue-shifted emission line profile is a clear tell-tale sign of outflows, the detection of non-blue-shifted lines (e.g. Najita et al. 2009) cannot be unambiguously interpreted as absence of a wind. It is clear from Figure 1 and 2 and the discussion in the previous section, that there are many reasons why a line like NeII 12.8m or OI 6300Å, that has a significant blue-shift in some cases, may instead appear centred in others –e.g. inclination, inner hole size, X-ray luminosity–, also different profiles respond differently to the change in these parameters, such that the relative centroid of, say, the NeII 12.8m with respect to the OI 6300Å line may also shift with the shift in X-ray luminosity (see Figure 1).
It should also be made clear that photoevaporation models predict that a large number of primordial discs, not only so-called transition discs, should have a disc wind and therefore produce blue-shifted emission lines. This is in agreement with HEG95’s observations that showed blue-shifted LVC of OI 6300Å for all the YSOs with discs. The detection of blue-shifted lines does not indicate that a given disc is evolved, all that it indicates is that energetic radiation from the central star is able to reach the disc establishing a flow. Our models predict intensities and blueshifts for this line that are in agreement with observations, suggesting that the LVC of OI 6300Å is indeed a good candidate for tracing photoevaporating disc gas. Further spectrally resolved observations of this line would be extremely helpful in testing the presented model.
Pascucci et al. (2009) found that of the seven sources they observed with VISIR, a NeII detection was only obtained in the ’transition’ (i.e. dust inner hole) sources. They interpreted their result as evidence of EUV-driven photoevaporation666At the time of publication of Pascucci et al. (2009) line profiles had only been calculated for the EUV-driven wind model (Font et al. 2004, Alexander 2008). and concluded that this can occur only at a late stage in the disc evolution. However we note that the detection limits at the distance of the primordial disc sources which showed no evidence of NeII emission are of a few 10-6L⊙, these are quite high and would only allow the strongest NeII sources to be detected. Indeed Güdel et al (2010, submitted) show that, excluding sources with known jets, many cTTS have L(NeII) lower than a few 10-6L⊙. The NeII luminosities predicted by our models for a primordial disc irradiated by Log(LX)=30.2 would be barely detectable at the sensitivity of the Pascucci et al. (2009) observations. The fact that NeII 12.8m was only detected in three of the sources of the P09 sample and that these happened to be transition discs may just be a coincidence, or, more likely, it may be due to the fact that, as predicted by our models, the NeII line is brighter for transition discs. The latter explanation however would only stand if the inner hole of these sources were devoid of gas (or at least the gas was optically thin to both X-rays and the interested transitions). However all of these ’transition’ discs are still accreting and depending on the gas densities in the inner hole, perhaps a primordial disc model may be more appropriate.
One should also point out that the magnitude of the blue-shift depends entirely on the size and location of the emitting region. The blueshift will be largest for inclinations where the emitting region is such to maximise the line-of-sight component of the velocity vectors. The blueshift of a line is therefore not necessarily maximised for a completely face on disc. A good example of this is provided by the OI 6300Å profile of the Log(LX) = 29.3 erg/sec primordial disc model.
While the current observational and theoretical emission line profile sample is still too small to draw any significant conclusions, these observations highlight the potential of using high resolution spectroscopy of YSOs and detailed profile modelling to learn about the dispersal mechanism of protoplanetary discs.
6 Conclusions
X-rays have recently been shown to drive powerful outflows (Ercolano et al. 2008b, 2009a, Owen et al 2010a). The recent radiation-hydrodynamic calculation of Owen et al. (2010a) have demonstrated that that the two time-scale dispersal of protoplanetary discs around solar-type stars is successfully reproduced by this model. Further evidence is provided by the observation of shorter disc lifetimes in low-metallicity environments (Yasui et al. 2009), a behaviour that is expected if X-ray driven photoevaporation dominates the dispersal of discs and argues against planet formation as the main dispersal mechanism (Ercolano & Clarke, 2009). Furthermore the X-ray spectra of T-Tauri stars are fairly well characterised (e.g. Güdel et al 2007) and the observed luminosities imply that significant X-ray photoevaporation must occur, unless the inner source is completely obscured due to accretion funnels thicker than 1022cm-2 (Ercolano et al. 2009a) and covering all lines of sight from the source to the disc.
Encouraged by these results, in this paper we have presented an atlas of emission lines from atomic and low-ionisation species emitted by photoevaporating protoplanetary discs around solar type stars. We have used disc and wind density distributions obtained by the radiation-hydrodynamic calculations of Owen et al (2010a) in the X-ray photoevaporation paradigm and have considered discs irradiated by a range of X-ray luminosities and at various stages of clearing, from primordial (i.e. extending all the way into the dust destruction radius) to inner hole sources with various hole sizes. Line profiles for the NeII 12.8m, OI 6300Å and HI recombination lines have also been calculated and should provide guidance for the interpretation of high-resolution spectroscopy of YSOs.
We compare the predictions of our models to available data in the literature and find agreement for the line intensities and profiles. We draw particular attention to the good agreement with the observations of Hartigan et al (1995) of the OI 6300Å line intensity and profile in the spectra of T-Tauri stars. This had been a problem for previous, EUV-driven photoevaporation models (e.g. Font et al. 2004) which underestimated its luminosity by a couple of orders of magnitude. The problem with these previous models lay in the fact that EUV winds are, by construction, ionised, while X-ray photoevaporation provides a mechanism to drive warm neutral winds, a condition necessary for the production of blue-shifted collisionally excited OI 6300Å and OI 5577Å.
As noted by Font et al (2004), magnetic wind models systematically underpredict the luminosities of forbidden lines and cannot fit the observed profiles (e.g. Garcia et al 2001). The main problem with magnetic wind models is that they are too cold – an X-ray driven photoevaporative wind naturally produces temperature, ionisation degrees and consistent kinematic patterns able to produce forbidden line intensities and profiles in agreement with the observations. These results suggest that, while magnetic disc winds may work in conjunction with photoevaporation, they are unlikely to be operating alone.
We analyse our results for the NeII 12.8m line profiles in the context of recent high resolution observations of Pascucci et al (2009) and Najita et al. (2009). We discuss how the detection of a blue-shifted line is a clear sign of an outflow, but caution against interpreting non-blue-shifted profiles or non-detections as absence of a disc wind. We argue that the non-detections for the primordial discs in the Pascucci et al (2009) sample could be explained by insufficient sensitivity of the observations that are only able to probe the upper end of the NeII luminosity distribution. The non-blue-shifted line centroids in the Najita et al. (2009) sources are probably due to unfavourable (high inclination) viewing angles or to the effect of seeing blue and redshifted emitting material through a large inner hole, as may be the case of GM Aur, although we caution that this explanation is only valid if the gas, known to be present in the inner (dust) hole of this object, is optically thin to X-ray radiation and to the line in question.
Finally, our models cannot reproduce the observed emission line luminosities of IR hydrogen recombination lines, which for some objects are reported to be as bright as the NeII 12.8m (Pascucci et al 2007; Ratzka et al 2007). As suggested by Hollenbach & Gorti (2009), these lines are probably produced in a dense, ionised region that is very close to the central star. High resolution spectroscopy of these lines is needed to further constrain their origin.
Acknowledgments
We thank the anonimous referee for an extremely detailed report that helped improve the clarity of our paper. We thank Ilaria Pascucci, Manuel Güdel and Joan Najita for helpful discussion and comparison of the observational results with our models. We thank Cathie Clarke, Al Glassgold, Greg Herczeg and Richard Alexander for helpful comments and a critical read of the paper. We also thank Richard Alexander for providing the NeII line profile from the EUV-photoevaporation model. We thank Eugenio Schisano for helping with the line profiles. BE is supported by a Science and Technology Facility Council Advanced Fellowship. JEO acknowledges support of a STFC PhD studentship. This work was performed using the Darwin Supercomputer of the University of Cambridge High Performance Computing Service (http://www.hpc.cam.ac.uk/), provided by Dell Inc. using Strategic Research Infrastructure Funding from the Higher Education Funding Council for England.
References
- Alexander & Armitage (2006) Alexander, R. D., & Armitage, P. J. 2006, ApJL, 639, L83
- Alexander et al. (2006) Alexander, R. D., Clarke, C. J., & Pringle, J. E. 2006, MNRAS, 369, 229
- Alexander & Armitage (2007) Alexander, R. D., & Armitage, P. J. 2007, MNRAS, 375, 500
- Alexander (2008) Alexander, R. D. 2008, MNRAS, 391, L64
- Armitage & Hansen (1999) Armitage, P. J., & Hansen, B. M. S. 1999, Nature, 402, 633
- Asplund et al. (2005) Asplund, M., Grevesse, N., & Sauval, A. J. 2005, Cosmic Abundances as Records of Stellar Evolution and Nucleosynthesis, 336, 25
- Bouvier et al. (2007) Bouvier, J., et al. 2007, A&A, 463, 1017
- Calvet et al. (2002) Calvet, N., D’Alessio, P., Hartmann, L., Wilner, D., Walsh, A., & Sitko, M. 2002, ApJ, 568, 1008
- Clarke et al. (2001) Clarke, C. J., Gendrin, A., & Sotomayor, M. 2001, MNRAS, 328, 485
- Currie et al. (2009) Currie, T., Lada, C. J., Plavchan, P., Robitaille, T. P., Irwin, J., & Kenyon, S. J. 2009, ApJ, 698, 1
- D’Alessio et al. (2001) D’Alessio, P., Calvet, N., & Hartmann, L. 2001, ApJ, 553, 321
- Donati et al. (2007) Donati, J.-F., et al. 2007, MNRAS, 380, 1297
- Donati et al. (2008) Donati, J.-F., et al. 2008, MNRAS, 386, 1234
- Dullemond & Dominik (2005) Dullemond, C. P., & Dominik, C. 2005, A&A, 434, 971
- Ercolano et al. (2003) Ercolano, B., Barlow, M. J., Storey, P. J., & Liu, X.-W. 2003a, MNRAS, 340, 1136
- Ercolano et al. (2005) Ercolano, B., Barlow, M. J., & Storey, P. J. 2005, MNRAS, 362, 1038
- Ercolano & Storey (2006) Ercolano, B., & Storey, P. J. 2006, MNRAS, 372, 1875
- Ercolano et al. (2008) Ercolano, B., Young, P. R., Drake, J. J., & Raymond, J. C. 2008a, ApS, 175, 534
- Ercolano et al. (2008b) Ercolano, B., Drake, J. J., Raymond, J. C., & Clarke, C. C. 2008b, ApJ, 688, 398
- Ercolano et al. (2009) Ercolano, B., Clarke, C. J., & Drake, J. J. 2009a, ApJ, 699, 1639
- Ercolano et al. (2009) Ercolano, B., Drake, J. J., & Clarke, C. J. 2009b, A&A, 496, 725
- Ercolano & Clarke (2009) Ercolano, B., & Clarke, C. J. 2009, MNRAS, 1956
- Ercolano et al. (2009) Ercolano, B., Clarke, C. J., & Robitaille, T. P. 2009, MNRAS, 394, L141
- Espaillat et al. (2007) Espaillat, C., et al. 2007, ApJL, 664, L111
- Flaccomio et al. (2009) Flaccomio, E., Stelzer, B., Sciortino, S., Micela, G., Pillitteri, I., & Testi, L. 2009, A&A, 505, 695
- Font et al. (2004) Font, A. S., McCarthy, I. G., Johnstone, D., & Ballantyne, D. R. 2004, ApJ, 607, 890
- Geers et al. (2006) Geers, V. C., et al. 2006, A&A, 459, 545
- Glassgold et al. (2007) Glassgold, A. E., Najita, J. R., & Igea, J. 2007, ApJ, 656, 515
- Gorti & Hollenbach (2008) Gorti, U., & Hollenbach, D. 2008, ApJ, 683, 287
- Gorti & Hollenbach (2009) Gorti, U., & Hollenbach, D. 2009, ApJ, 690, 1539
- Gregory et al. (2008) Gregory, S. G., Matt, S. P., Donati, J.-F., & Jardine, M. 2008, MNRAS, 389, 1839
- Güdel et al. (2007) Güdel, M., et al. 2007, A&A, 468, 353
- Haisch et al. (2001) Haisch, K. E., Jr., Lada, E. A., & Lada, C. J. 2001, ApJL, 553, L153
- Hartigan et al. (1995) Hartigan, P., Edwards, S., & Ghandour, L. 1995, ApJ, 452, 736, HEG95
- Hartmann et al. (1998) Hartmann, L., Calvet, N., Gullbring, E., & D’Alessio, P. 1998, ApJ, 495, 385
- Herbig (1990) Herbig, G. H. 1990, ApJ, 360, 639
- Herczeg et al. (2007) Herczeg, G. J., Najita, J. R., Hillenbrand, L. A., & Pascucci, I. 2007, ApJ, 670, 509
- Hernández et al. (2008) Hernández, J., Hartmann, L., Calvet, N., Jeffries, R. D., Gutermuth, R., Muzerolle, J., & Stauffer, J. 2008, ApJ, 686, 1195
- Hollenbach & Gorti (2009) Hollenbach, D., & Gorti, U. 2009, ApJ, 703, 1203
- Hussain et al. (2009) Hussain, G. A. J., et al. 2009, MNRAS, 398, 189
- Jardine et al. (2008) Jardine, M. M., Gregory, S. G., & Donati, J.-F. 2008, MNRAS, 386, 688
- Kashyap & Drake (2000) Kashyap, V., & Drake, J. J. 2000, Bulletin of the Astronomical Society of India, 28, 475
- Kim et al. (2009) Kim, K. H., et al. 2009, ApJ, 700, 1017
- Krauss et al. (2007) Krauss, O., Wurm, G., Mousis, O., Petit, J.-M., Horner, J., & Alibert, Y. 2007, A&A, 462, 977
- Lahuis et al. (2007) Lahuis, F., van Dishoeck, E. F., Blake, G. A., Evans, N. J., II, Kessler-Silacci, J. E., & Pontoppidan, K. M. 2007, ApJ, 665, 492
- Landi & Phillips (2006) Landi, E., & Phillips, K. J. H. 2006, ApS, 166, 421
- Launay & Roueff (1977) Launay, J. M., & Roueff, E. 1977, A&A, 56, 289
- Long et al. (2007) Long, M., Romanova, M. M., & Lovelace, R. V. E. 2007, MNRAS, 374, 436
- Luhman et al. (2010) Luhman, K. L., Allen, P. R., Espaillat, C., Hartmann, L., & Calvet, N. 2010, ApS, 186, 111
- Maggio et al. (2007) Maggio, A., Flaccomio, E., Favata, F., Micela, G., Sciortino, S., Feigelson, E. D., & Getman, K. V. 2007, ApJ, 660, 1462
- Mamajek (2009) Mamajek, E. E. 2009, American Institute of Physics Conference Series, 1158, 3
- Meijerink et al. (2008) Meijerink, R., Glassgold, A. E., & Najita, J. R. 2008, ApJ, 676, 518
- Muzerolle et al. (2010) Muzerolle, J., Allen, L. E., Megeath, S. T., Hernández, J., & Gutermuth, R. A. 2010, ApJ, 708, 1107
- Najita et al. (2009) Najita, J. R., et al. 2009, ApJ, 697, 957
- Owen et al. (2010) Owen, J. E., Ercolano, B., Clarke, C. J., & Alexander, R. D. 2010, MNRAS, 401, 14150
- Pascucci et al. (2007) Pascucci, I., et al. 2007, ApJ, 663, 383
- Pascucci & Sterzik (2009) Pascucci, I., & Sterzik, M. 2009, ApJ, 702, 724
- Pontoppidan et al. (2008) Pontoppidan, K. M., Blake, G. A., van Dishoeck, E. F., Smette, A., Ireland, M. J., & Brown, J. 2008, ApJ, 684, 1323
- Preibisch et al. (2005) Preibisch, T., et al. 2005, ApS, 160, 401
- Ratzka et al. (2007) Ratzka, T., Leinert, C., Henning, T., Bouwman, J., Dullemond, C. P., & Jaffe, W. 2007, A&A, 471, 173
- Richling & Yorke (2000) Richling, S., & Yorke, H. W. 2000, ApJ, 539, 258
- Romanova et al. (2003) Romanova, M. M., Ustyugova, G. V., Koldoba, A. V., Wick, J. V., & Lovelace, R. V. E. 2003, ApJ, 595, 1009
- Sanz-Forcada et al. (2002) Sanz-Forcada, J., Brickhouse, N. S., & Dupree, A. K. 2002, ApJ, 570, 799
- Savage & Sembach (1996) Savage, B. D., & Sembach, K. R. 1996, ApJ, 470, 893
- Schisano et al. (2010) Schisano, E., Ercolano, B., & Güdel, M. 2010, MNRAS, 401, 1636
- Sicilia-Aguilar et al. (2008) Sicilia-Aguilar, A., Henning, T., Juhász, A., Bouwman, J., Garmire, G., & Garmire, A. 2008, ApJ, 687, 1145
- Skelly et al. (2009) Skelly, M. B., Donati, J. -., Bouvier, J., Grankin, K. N., Unruh, Y. C., Artemenko, S. A., & Petrov, P. 2009, arXiv:0911.5476
- Skrutskie et al. (1990) Skrutskie, M. F., Dutkevitch, D., Strom, S. E., Edwards, S., Strom, K. M., & Shure, M. A. 1990, AJ, 99, 1187
- Stone & Norman (1992a) Stone, J. M., & Norman, M. L. 1992, ApS, 80, 753
- Stone & Norman (1992b) Stone, J. M., & Norman, M. L. 1992, ApS, 80, 791
- Stone et al. (1992) Stone, J. M., Mihalas, D., & Norman, M. L. 1992, ApS, 80, 819
- Störzer & Hollenbach (2000) Störzer, H., & Hollenbach, D. 2000, ApJ, 539, 751
- Strom et al. (1989) Strom, K. M., Strom, S. E., Edwards, S., Cabrit, S., & Skrutskie, M. F. 1989, AJ, 97, 1451
- Suzuki & Inutsuka (2009) Suzuki, T. K., & Inutsuka, S.-i. 2009, ApJL, 691, L49
- Takeuchi et al. (2005) Takeuchi, T., Clarke, C. J., & Lin, D. N. C. 2005, ApJ, 627, 286
- van Boekel et al. (2009) van Boekel, R., Güdel, M., Henning, T., Lahuis, F., & Pantin, E. 2009, A&A, 497, 137
- Verner et al. (1993) Verner, D. A., Yakovlev, D. G., Band, I. M., & Trzhaskovskaya, M. B. 1993, Atomic Data and Nuclear Data Tables, 55, 233
- Verner & Yakovlev (1995) Verner, D. A., & Yakovlev, D. G. 1995, A&AS, 109, 125
- White & Ghez (2001) White, R. J., & Ghez, A. M. 2001, ApJ, 556, 265
- Yasui et al. (2009) Yasui, C., Kobayashi, N., Tokunaga, A. T., Saito, M., & Tokoku, C. 2009, ApJ, 705, 54