Strong Gravitational Lensing by the Super-massive cD Galaxy in Abell 3827
Abstract
We have discovered strong gravitational lensing features in the core of the nearby cluster Abell 3827 by analyzing Gemini South GMOS images. The most prominent strong lensing feature is a highly-magnified, ring-shaped configuration of four images around the central cD galaxy. GMOS spectroscopic analysis puts this source at . Located 20″ away from the central galaxy is a secondary tangential arc feature which has been identified as a background galaxy with . We have modeled the gravitational potential of the cluster core, taking into account the mass from the cluster, the brightest cluster galaxy (BCG) and other galaxies. We derive a total mass of within 37 h-1 kpc. This mass is an order of magnitude larger than that derived from X-ray observations. The total mass derived from lensing data suggests that the BCG in this cluster is perhaps the most massive galaxy in the nearby universe.
Subject headings:
galaxies: clusters: individual (Abell 3827) — galaxies: elliptical and lenticular, cD — galaxies: evolution — galaxies: formation — gravitational lensing: strong1. Introduction
As the densest galaxy environments known, the cores of massive clusters are expected to host the strongest dynamical evolution. Such cluster cores are found to be dominated by early-type, D or cD galaxies that are also the brightest cluster galaxies (BCGs). These have extended luminous haloes (Schombert, 1987), which are not necessarily smooth (Johnstone et al., 1991) and contain multiple or complex nuclei (Rood & Leir, 1979). They are located close to the peak of the X-ray emission (Jones & Forman, 1984) and near the kinematical centers of their clusters (Quintana & Lawrie, 1982; Quintana et al., 2000).
There has been a long-running debate over the extent to which BCGs can be assembled through continuous merging of galaxies in the cluster potential (“galactic cannibalism”) versus early merging during cluster collapse (e.g. West, 1994; Dubinski, 1998). However, recent work has shown that BCGs are likely to form via “dry” or dissipationless major mergers of smaller early-type galaxies (e.g. van Dokkum, 2005; Bell et al., 2006; de Lucia & Blaizot, 2007; Whitaker & van Dokkum, 2008). These dry mergers are thought to be the primary mechanism through which massive galaxies grow from to the present day and continue populating the upper end of the mass function without changing the overall mass density of elliptical systems. It has been pointed out that the merger rate increases both with the stellar mass of galaxies and with age (Liu et al., 2009). Therefore, there is a large fraction of major dry mergers in the nearby universe. Indeed, as many as 3.5% of BCGs show ongoing evidence of mergers (Liu et al., 2009), and about 10% - 20% of massive galaxies have undergone a dry merger in the last gigayear (Khochfar & Silk, 2009). Thus, dry mergers ultimately lead to the formation of very massive and dense BCGs with large mass-to-light ratios.
We report here the discovery of a multi-component BCG that is, to our knowledge, the most massive galaxy ever seen in the local universe. This is located in the core of Abell 3827, a massive galaxy clusters in Abell’s cluster catalog (richness class 2 and Bautz-Morgan type I), with an X-ray emission of (0.1–2.4 keV) 2.1 1044 erg s-1. This BCG is perhaps the most extreme example of ongoing galaxy cannibalism known: a super-giant elliptical that appears to be in the throes of devouring at least four other galaxies. Evidence for a recent major merger is also supported by the appearance of an extended asymmetric halo at the center of the cluster. The super-giant galaxy also shows features arising from strong gravitational lensing, the most prominent being a surrounding, magnified ring-shape configuration of four similarly-shaped images. The existence of such features provides a unique opportunity to study the mass distribution and the evolution of BCGs with unprecedented spatial detail.
This Letter is organized as follows. In section 2, we summarize our observations and data reduction. In section 3, we describe our results, including the strong lensing modeling. In section 4 we present further discussion. Throughout this Letter we use a standard cosmology of km s-1 Mpc-1, and . At the redshift of Abell 3827, 1″ corresponds to 1.83 kpc.
2. Observations
All imaging and spectroscopic data were collected with the Gemini Multi-Object Spectrograph (GMOS, Hook et al., 2004) at the Gemini South telescope, in queue mode.
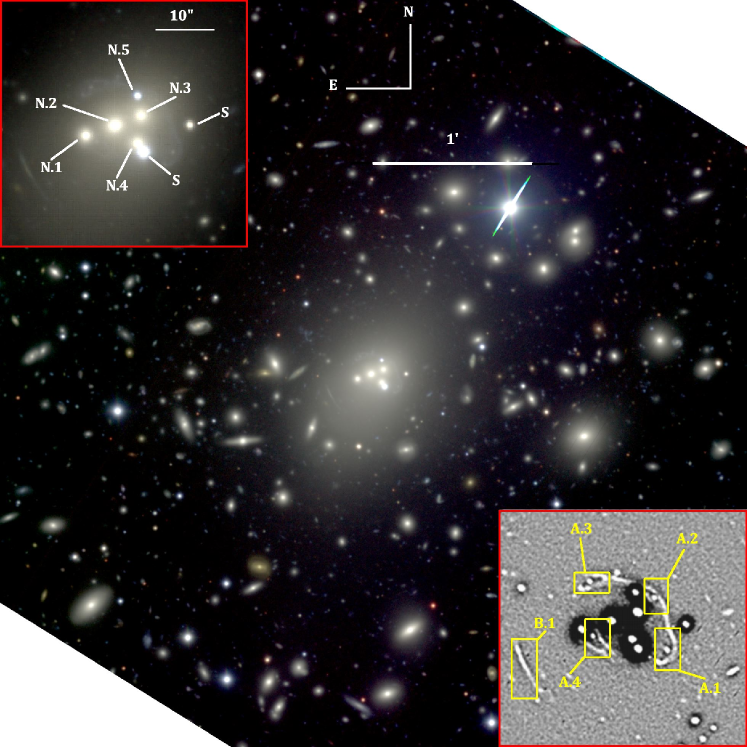
The cluster was imaged with the , and filters on 2007 Nov 7 (UT), in photometric conditions, with good seeing (04 06). Observations were processed with the Gemini IRAF package (version 1.8) in the standard manner. Calibration on the standard magnitude system was achieved using observations of stars from Landolt (1992). Object detection and photometry were performed on the -band image (2007 Nov 7 UT) with the program SExtractor (Bertin and Arnouts, 1996). The MAGAUTO parameter was adopted as the total magnitude for the detected objects. Colors were derived by measuring fluxes inside a fixed circular aperture of 15 ( pixels) in all filters, corresponding to a physical aperture of 2.75 h-1 kpc at the distance of the cluster. All objects with SExtractor stellarity flag were selected as galaxies. We estimate that the catalog is complete down to 23 mag, since the number counts start to turn over at this value. The final catalog contains the total magnitudes, colors and structural parameters for 747 galaxies brighter than mag. Figure 1 shows the color-composite , , image of the central region of Abell 3827 (0.55 0.55 Mpc2). Five central elliptical galaxies (N.1 to N.5) are embedded in a common asymmetric halo (top-left panel). The asymmetric halo has an ellipsoidal form, with 13 and 1′ for the semi-major and semi-minor axes, respectively. Strong lensing features detected around the central cD galaxy (at radii 8″ and 20″) are visible in the images located in the top-left and bottom-right panels of Fig. 1.
| Galaxy | ID | R.A.(2000) | Decl.(2000) | Vhel | x | y | () | |||
|---|---|---|---|---|---|---|---|---|---|---|
| (h m s) | (° ′ ″) | (km s-1) | (km s-1) | (arcsec) | (arcsec) | (mag) | (mag) | (mag) | ||
| (1) | (2) | (3) | (4) | (5) | (6) | (7) | (8) | (9) | (10) | (11) |
| 1323 | N.1 | 22 01 53.99 | 59 56 45.14 | 29548 | 115 | 13.88 | 1.92 | 17.03 | 16.51 | 0.51 |
| 1324 | N.2 | 22 01 53.31 | 59 56 43.14 | 29763 | 100 | 3.75 | 0.08 | 16.19 | 15.67 | 0.52 |
| 1325 | N.3 | 22 01 52.69 | 59 56 41.22 | 29951 | 288 | 5.75 | 2.00 | 16.18 | 15.56 | 0.55 |
| 1326 | N.4 | 22 01 52.76 | 59 56 46.12 | 28590 | 1073 | 4.63 | 2.91 | 16.23 | 15.81 | 0.43 |
| 1327 | N.5 | 22 01 52.79 | 59 56 37.73 | 33817 | 4154 | 4.13 | 5.48 | 18.08 | 17.70 | 0.35 |
Note. — (1) Galaxy number in the Source Extractor catalog, (2) Galaxy ID in Fig.1, (3) and (4) R.A. and decl. (J2000.0), (5) heliocentric radial velocity, (6) difference between the heliocentric radial velocities of each component and the systemic velocity, (7) and (8) coordinates relative to the center of mass of the system located at 22h 01m 5306, 59° 43′ 4322. (9) and (10) total magnitudes, (11) galaxy colors measured inside a fixed aperture of diameter 15.
Long-slit spectra of the central five elliptical galaxies were obtained on 2007 Jun 3 (UT) during bright time, through thin-cloud cover and 1″ seeing. The observations were performed using the nod-and-shuffle mode, with the R400 grating centered at 8100Å; this setup was chosen to minimize the effect of moon illumination and to obtain good sky subtraction. To avoid second-order contamination from blue light in the red part of these spectra, the OG515 blocking filter was used. In addition, multi-object spectroscopic (MOS) observations of galaxies in the Abell 3827 field were obtained on 2007 Sep 7 (UT), during dark time, in photometric conditions and with seeing between 07 and 09. Two masks were observed with 075 slit widths, using the B600 grating centered at 5220Å. During the observations, all spectra were dithered to account for the gaps in the GMOS CCDs. Spectra were reduced and calibrated in the standard manner for each mode.
3. Results
We have measured radial velocities for 67 galaxies using cross-correlation techniques or emission-line fitting. Of these 67 galaxies, 56 are within km s-1 of the cluster redshift. Using the bi-weight estimator for location and scale (Beers at al., 1990), we calculate an average velocity for the cluster of 29663155 km s-1 and a line-of-sight velocity dispersion of 1142125 km s-1, with 55 member galaxies. The virial mass inside a radius of 0.3 h-1 Mpc is , with uncertainties at the 68% confidence intervals.
In the cluster core, we confirm membership for four of the central elliptical galaxies. There are also two stars in the foreground (see Fig. 1). Three of the core galaxies have similar colors (see Table 1) and their velocities are consistent with the average cluster velocity (within 300 km s-1). Galaxy N.4 is slightly bluer than N.1, N.2 and N.3 and has a measured radial velocity 1000 km s-1 higher than the systemic velocity. Galaxy N.5 may not be in the cluster, but the background.
3.1. Strongly lensed features in the cluster core
Thanks to the superb image quality delivered by GMOS and the Gemini South telescope, we have been able to detect several strongly-lensed features around the central cD galaxy in the core of the cluster. A thin, extended tangential arc (B.1 in Fig. 1) is seen at 20″ south-east from the central galaxy, with apparent length and thickness . Surrounding the central core galaxies is a second and more prominent arc feature—a highly-magnified, ring-shaped configuration of four images around the central cD galaxy, with a radius of 8″. Only three of the arc components are visible in the inset color image in Fig. 1 (A.1, A.2 and A.3). The fourth image (A.4 in Fig. 1) is between galaxies N.1 and N.2 and is obscured by the halo of the cD galaxy. All four features can be seen in detail in the bottom-right panel in Fig. 1 (see the caption for details). These features are very reminiscent of the lensed images seen in Cl0024+1654 (Colley et al., 1996), although the source galaxy in the present case is closer than (see below).
The redshifts of the lensed sources were determined from long-slit observations taken on 2007 Nov 15-16, using the R150 grating centered at 7150Å. For the feature with the ring-shaped configuration (system A), we derived a redshift for one of the images located north-west of the cluster core (A.2). Two emission lines ( and [N II]Å) are seen in the spectrum for A.2; unfortunately no other lines were detected, due to light contamination from the cD halo. From the two emission lines, the estimated redshift for A.2 is .
The symmetric distribution of images in system A and the ring-shaped structure connecting arcs A.1, A.2 and A.3 (and possibly A.4) suggest that the images are of the same source galaxy. Therefore, we assume that all four images come from the same source and have the same redshift. This assumption should be taken with caution, without spectroscopy of the remaining system A images for confirmation, but is supported by our modeling, discussed in the next section.
The subtraction of light from the halo of the cD galaxy, as well as subtraction of all galaxies and the stars from the cluster core, highlights the ring-shaped structure connecting arcs A.1, A.2, A.3 and possibly A.4 (see Fig. 1). The existence of this structure only kpc from the center of the cD galaxy gives us a unique opportunity to study the dynamics and mass distribution of a large BCG at unprecedentedly small scales.
Using several emission-lines ([OII] Å, , [OIII] Å) seen in the spectrum of the south-east tangential arc, B.1, we derived a redshift of . The relatively long, thin appearance of this arc suggests that the source galaxy lies very close to the inner fold caustic, assuming the lens cluster has an elliptical spatial distribution of mass (e.g. see Fort & Mellier, 1994; Narayan & Bartelmann, 1999). If true, there must be three fainter counter-images: one to the north-east, one to the south-west and one at the center of the cluster core.
3.2. Strong Lensing modeling and mass determination
To produce the features described in the previous section, the cluster core must be very massive. In order to reconstruct the mass distribution in the core (the region enclosed by system A), we used the parametric model implemented in the publicly available LENSTOOL111http://www.oamp.fr/cosmology/lenstool/ ray-tracing code (Jullo et al., 2007). To model the lens, we used two clumps of different scales—a large-scale halo, representing both the matter inside the giant cD galaxy and the dark matter halo of the cluster, and four smaller-scale clumps, modeling the small-scale perturbations associated with the galaxies embedded in the cD galaxy. For all components we adopt a dual Pseudo-Isothermal Elliptical Mass Distribution (dPIEMD; see Elíasdóttir et al., 2007). The dPIEMD can be characterized by seven parameters: the center position , the ellipticity , the position angle and the parameters of the density profile: the velocity dispersion and two characteristic radii and . For the large halo, we left most parameters free, with broad uniform priors. Only remained fixed at a value of 1500 h-1 kpc. In the small-scale clumps, the parameters of the density profiles were scaled as a function of their galaxy luminosities (see Jullo et al., 2007, and references therin). Using as a scaling factor the luminosity , associated with the -magnitude of central galaxy N.3 (see Fig. 1 and Table 1), we searched for the values of and that yield the best fit, fixing at 0.15h-1 kpc. The best-fitting parameters of the model are listed in Table 2.
| Comp. | X | Y | |||||
|---|---|---|---|---|---|---|---|
| (kpc) | (kpc) | (km s | |||||
| Cluster+cD | 0.9 | 2.5 | 0.14 | 56 | 32 | [1500] | 1174 |
| N.3() | [2.77] | [2.82] | [0] | [0] | [0.15] | 8 | 256 |
Note. — Coordinates are relative to the center of image 2 (22h 01m 5315, = -59 56 4331). Values in square brackets are not optimized.
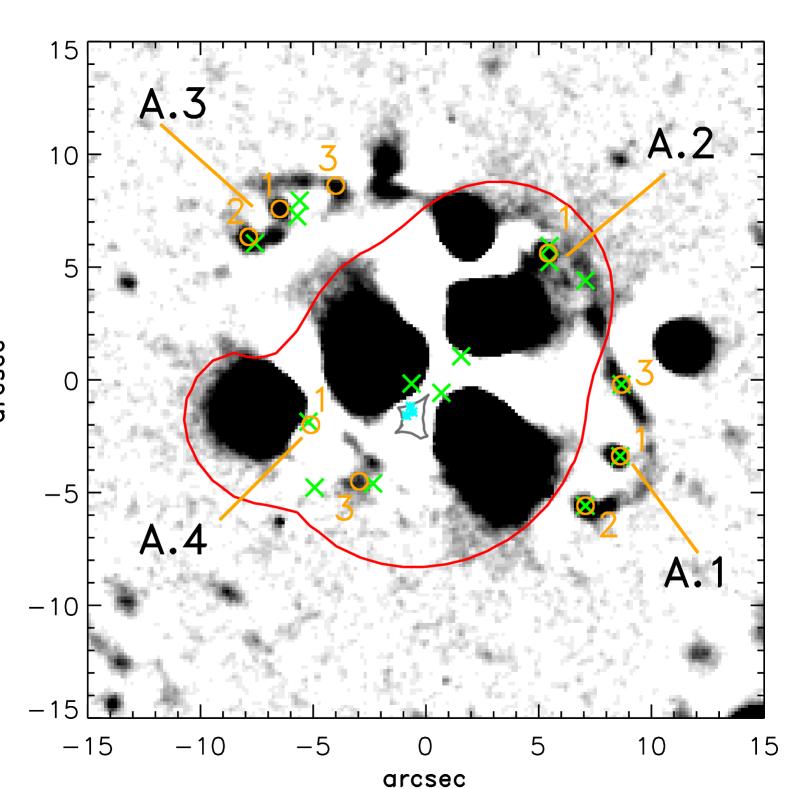
Because the ring structure shows multiple subcomponents, we selected the most reliable set of multiple images and associated them with three different background sources in order to make our fit. Considering an uncertainty in the position of any image equal to 02, we found after the optimization in the image plane a = 17. Our model reproduces well the positions of the observed subcomponents, with a mean scatter less than 08. To highlight this, we show in Figure 2, the model-predicted counter-images of the substructures in arc A.1 (green crosses), which are in agreement with the image positions for all arcs (orange circles). The fit also predicts a central demagnified image which is lost in the cD light distribution. It is important to note that our model is oversimplified, since we are assuming spherical halos for the galaxies. A detailed model of Abell 3827 is beyond the scope of the present work.
Given our best model (see Table 2), we calculated the total mass inside a radius of 20″(location of the tangential arc B.1 at 37 h-1 kpc) and found . This mass is slightly greater than that enclosed in Abell 1689 within a similar radius (see Fig. 6 in Limousin et al., 2007). We estimated the mass of the cD galaxy as being 30 50 of the total mass of the cluster within 20″ (Limousin et al., 2007). This implies a cD galaxy mass between M☉ and M☉. Even assuming a conservative value of 30, this would mean that the central cD galaxy in Abell 3827 is perhaps the most massive galaxy observed in the local universe.
4. Discussion
Using the strong-lensing model presented above, we have analyzed the mass distribution to unprecedented spatial resolution. The cluster core is spatially very concentrated. Even if we assume a conservative fraction for the mass of the central cD galaxy (see above), this galaxy is very massive. The cD galaxy could be an extreme example of the effects of dry mergers on the mass of BCGs; dry mergers can produce an increase (by a factor of up to 3) in the dark-matter-to-stellar mass ratio for the most massive systems at present (Ruszkowski & Springel, 2009).

We have compared the total mass derived from our strong-lensing analysis with that derived from the X-ray gas. We have calculated the total mass as a function of radius for Abell 3827, based on a recent X-ray analysis by L. Valkonen et al. (2010, private communication) . We derive the total cluster mass by assuming hydrostatic equilibrium and using their best fit for the three-dimensional distribution of X-ray emitting gas. L. Valkonen et al. (2010, private communication) report M☉ inside a radius h-1 Mpc, derived from the relation by Salhén et al. (2009) for a cluster temperature of keV. Fig. 3 shows the radial distribution of the total mass derived from the X-ray gas and from the strong-lensing analysis. For the X-ray gas, we plot mass profiles: (1) for a typical cluster with h-1 kpc and (dash-dot line), and (2) for the derived total mass of Abell 3827 within 37 h-1 kpc (solid vertical line). Finally, we plot the mass profile for Abell 3827 derived from strong lensing as a dashed line. At all radii, the mass derived from strong lensing is at least a factor of 10 larger than that derived from X-ray data. Discrepancies between strong-lensing cluster masses and X-ray cluster masses for the same clusters have been reported previously in the literature (e.g. Gitti et al., 2007; Halkola et al., 2008). Moreover, significant biases of up to % may be introduced into strong-lensing mass estimates when models are extrapolated outside the Einstein ring (Meneghetti et al., 2009). Analysis using both strong-lensing and X-ray methods at small radii show that differences can grow by as much as an order of magnitude (Verdugo et al., 2007).
How can we explain this discrepancy? For the lower limit on mass, within error of the strong-lensing fit, we obtain M☉ inside the ring structure of radius 10″ ( h-1 kpc). Hence, the most likely uncertainties, related to extrapolation of the strong-lensing model to larger radii, are unable to explain our factor-of-ten discrepancy. Assuming a spherical mass distribution, the mass inside system A is M☉. The large difference between the strong-lensing mass and X-ray mass could be related to the dynamical state of the cluster, to the mass inferred from the X-ray gas, or to both effects. Total X-ray cluster masses derived from flat-core density profiles may be underestimated by at least a factor of 2 within the central 30 h-1 kpc (Voigt & Fabian, 2006). Simulations (Meneghetti et al., 2009) of strong-lensing models have shown that physical substructures along the line of sight to the cluster can overestimate the derived total mass by a factor of 2; in fact, our GMOS spectra reveal a bi-modality in the velocity distribution of cluster galaxies, suggesting that Abell 3827 is presently merging. In all, these effects can produce a factor of about 4, still insufficient to explain the large discrepancy between strong-lensing and X-ray derived masses. Moreover, if we take out the factor of 4 due to the two effects described above, we are left with a cD galaxy with a mass of M☉, which appears to be one of the most massive galaxies known in the local universe. Detailed studies of the central objects at different wavelengths will reveal insights into the origins and subsequent evolution of this peculiarly massive galaxy.
References
- Beers at al. (1990) Beers, T. C. et al. 1990, AJ, 100, 32
- Bell et al. (2006) Bell, E. F. et al. 2006, ApJ, 640, 241
- Bertin and Arnouts (1996) Bertin, E. & Arnouts, S. 1996, A&AS, 117, 393
- Colley et al. (1996) Colley, W. N. et al. 1996, ApJ, 461, L83
- de Lucia & Blaizot (2007) de Lucia, G. & Blaizot, J. 2007, MNRAS, 375, 2
- Dubinski (1998) Dubinski, J. 1998, ApJ, 502, 141
- Elíasdóttir et al. (2007) Elíasdóttir, Á. et al. 2007, arXiv:0710.5636
- Fort & Mellier (1994) Fort, B., & Mellier, Y. 1994, A&AR, 5, 239
- Gitti et al. (2007) Gitti, M., Piffaretti, R. & Schindler, S. 2007, A&A, 472, 383
- Halkola et al. (2008) Halkola, A. et al. 2008, A&A, 481, 65
- Hook et al. (2004) Hook, I. et al. 2004, PASP, 116, 425
- Johnstone et al. (1991) Johnstone, R. M. et al. 1991, MNRAS, 248, 18
- Jones & Forman (1984) Jones, C. & Forman, W. 1984, ApJ, 276, 38
- Jullo et al. (2007) Jullo, E., Kneib, J.-P. et al. 2007, New J. of Phys., 9, 447
- Khochfar & Silk (2009) Khochfar, S. & Silk, J. 2009, ApJ, 648, L21
- Landolt (1992) Landolt, A.U. 1992, AJ, 104, 340
- Limousin et al. (2007) Limousin, M., et al. 2007, ApJ, 668, 643
- Liu et al. (2009) Liu, F. S., Mao, S., Deng, Z. G., Xia, X. Y., & Wen, Z. L. 2009, MNRAS, 396, 2003
- Meneghetti et al. (2009) Meneghetti, M., et al. 2009, A&A, in press (arXiv:0912.1343)
- Narayan & Bartelmann (1999) Narayan, R., & Bartelmann, M. 1999, in Proc. 1995 Jerusalem Winter School, Formation and Structure in the Universe, ed. A. Dekel and J. P. Ostriker (Cambridge: Cambridge Univ. Press), 360
- Quintana & Lawrie (1982) Quintana, H. & Lawrie, D. G. 1982, AJ, 87, 1
- Quintana et al. (2000) Quintana, H. et al. 2000, ApJS, 126, 1
- Rood & Leir (1979) Rood, H. J., & Leir, A. A. 1979, ApJ, 231, L3
- Ruszkowski & Springel (2009) Ruszkowski, M. & Springel, V. 2009, ApJ, 696, 1094
- Schombert (1987) Schombert, J. M. 1987, ApJS, 64, 643
- Salhén et al. (2009) Salhén, M. et al. 2009, MNRAS, 397, 577
- van Dokkum (2005) van Dokkum, P. G. 2005, AJ, 130, 2647
- Verdugo et al. (2007) Verdugo, T., de Diego, J. A., & Limousin, M. 2007, ApJ, 664, 702
- Voigt & Fabian (2006) Voigt, L. M. & Fabian, A. C. 2006, MNRAS, 368, 518
- West (1994) West, M. J. 1994, MNRAS, 268, 79
- Whitaker & van Dokkum (2008) Whitaker, K. E. & van Dokkum, P. G. 2008, ApJ, 676, L105