Low Resolution Spectral Templates for AGNs and Galaxies from 0.03 – 30 m
Abstract
We present a set of low resolution empirical SED templates for AGNs and galaxies in the wavelength range from 0.03 to 30m. These templates form a non-negative basis of the color space of such objects and have been derived from a combination 14448 galaxies and 5347 likely AGNs in the NDWFS Boötes field. We briefly describe how the templates are derived and discuss some applications of them. In particular, we discuss biases in commonly used AGN mid-IR color selection criteria and the expected distribution of sources in the current WISE satellite mission.
Department of Astronomy, The Ohio State University,
140 W. 18th Ave., Columbus, OH 43210
e-mail: rjassef@astronomy.ohio-state.edu
1 Introduction
In many current and upcoming extragalactic photometric surveys it will be necessary to use spectral energy distribution (SED) fitting techniques to characterize most objects (e.g., redshifts, K-corrections, stellar masses and bolometric luminosities), because spectroscopic observations are too expensive.
SEDs of galaxies are typically either empirically obtained (e.g., Coleman, Wu & Weedman, 1980) or theoretically created (e.g., Bruzual & Charlot, 2003). The former have the advantage of giving an accurate representation of the SEDs but generally lack the large wavelength ranges of theoretical ones. Empirical SEDs also have the advantage of easily including non-stellar emission, like active nuclei and dust/PAH emission, which are hard to model from first principles. In particular, most available AGN SEDs are empirically obtained (e.g., Richards et al., 2006) by averaging photometric observations of a small number of quasars.
In this proceeding we discuss a non-negative basis of empirically obtained SED templates for galaxies and AGNs that accurately represents the colors of such objects. These templates are derived from a combination of 14448 galaxies and 5347 likely AGNs in the NDWFS Boötes field with spectroscopic redshifts and photometry spanning the far-UV to the mid-IR. All results shown in here have been presented and are discussed in detail by Assef et al., (2008), Assef et al. (2010a) and Assef et al. (2010b).
2 Data
Our data set consists on 14448 galaxies and 5347 likely AGNs in the NOAO Deep Wide-Field Survey (NDWFS; Jannuzi & Dey 1999) Boötes field. Each object has a spectroscopic redshift from the AGN and Galaxy Evolution Survey and has at least an upper limit in 8 of the 14 following bands: Bw, R, I and K from NDWFS, J and Ks from FLAMEX, z from zBoötes, IRAC [3.6], [4.5], [5.8] and [8.0] from SDWFS, GALEX FUV and NUV, and MIPS 24m from Weedman et al., (2006). The AGN classification scheme is conservative, and objects classified as AGNs are either spectroscopically or photometrically classified according to their mid-IR, X-ray and radio properties. We refer the reader to Assef et al. (2010a) for details on the sample selection.
3 Building the SED Templates
The methods we use to derive the SED templates are described in detail by Assef et al., (2008) and Assef et al. (2010a). In this section we give a brief summary of how our methods work and refer the reader to the aforementioned papers for detailed discussions.
We assume that the spectrum of any object in our sample can be modeled as a linear combination of a small set of unknown spectral templates. We construct these unknown templates using the data sets described in the previous section. For “pure” galaxies, we assume the majority of them have SEDs that can be described as a linear combination of three templates: one similar to an elliptical galaxy (an old stellar population), one similar to a spiral galaxy (a continuously star forming population), and a third similar to an irregular galaxy (a starburst population). For objects with active nuclei, we assume that every AGN SED can be described by the same spectral template with varying amounts of reddening and absorption by the intergalactic medium (IGM), combined with the galaxy templates to describe the host.
We use an iterative algorithm to derive the SED templates. This algorithm is based on the method proposed by Budavari et al., (2000) for deriving principal component SEDs. We start with an initial guess for each of our SED templates and sequentially improve it to best fit the photometric data. Our initial guess for the “pure” galaxy SEDs corresponds to the E, Sbc and Im templates of Coleman et al.(1980), extended into the UV and mid-IR with the models of Bruzual & Charlot, (2003) and with the addition of PAH and dust emission of the VCC1003 and M82 SEDs obtained by Devriendt, Guiderdoni & Sadat, (1999) to the star forming templates. For the AGN component we use a combination of power-laws that broadly resembles the AGN SED template of Richards et al., (2006). We divide every SED template in 300 logarithmically spaced wavelength bins and fit each bin independently to our data set, with a restriction to force their smoothness. The top left panel of Figure 1 shows the resulting SED templates alongside with the initial guesses.
4 Applications
We have pursued several applications of our SED templates, including the estimation of photometric redshifts and K-corrections for galaxies and AGNs, the study of biases in mid-IR selection of AGNs, predictions of colors of AGNs and galaxies in the pass-bands of the recently launched WISE mission, and the determination of luminosity function of mid-IR and X-ray selected AGNs from redshift 0 to 6. The former three applications are discussed in detail by Assef et al., (2008) and Assef et al. (2010a), while our results on the AGN luminosity function were presented by Assef et al. (2010b). In this section we discuss two of these applications, namely the biases in the mid-IR color selection of AGNs and the colors of AGNs and galaxies in WISE.
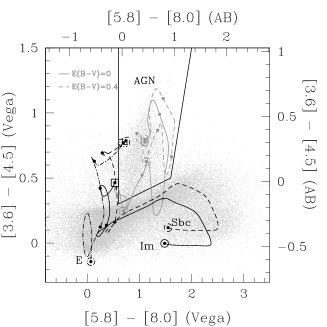
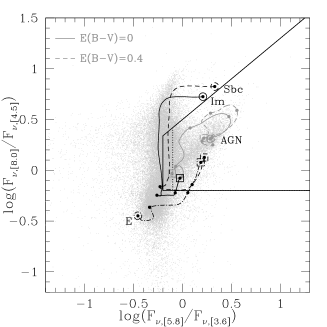
Figure 1 shows the mid-IR colors of all sources in SDWFS with , the AGN selection diagrams of Stern et al., (2005) (top right panel) and of Lacy et al. (2004) (bottom left panel) and the color tracks of our templates. The boundaries of the selection region of Stern et al., (2005) do a remarkable job of excluding inactive galaxies at , but also exclude unreddened AGNs at . In a more subtle manner, the selection region of Stern et al., (2005) also excludes AGNs that are faint in comparison to their host galaxies, as the latter will dominate the mid-IR colors. The selection region proposed by Lacy et al. (2004) is not strongly affected by the biases of the Stern et al., (2005) criteria, but their AGN selection region is heavily contaminated by intermediate redshift star forming galaxies and galaxies at . These problems are partially solved by the revised version of this criteria by Lacy et al. (2007). It can be seen, however, that if the left-most boundary in this criterion is pushed further to the right to limit contamination by inactive galaxies, similar biases to those of the Stern et al., (2005) selection criteria arise.
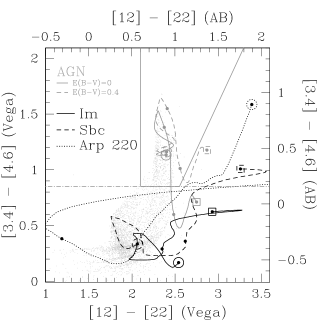
Using our SED templates, we have also studied the color distribution of sources in the WISE mission. The selection boundaries shown in the bottom right panel of Figure 1 correspond to those proposed by Assef et al. (2010a), and would be able to classify in between and AGNs, depending on whether a detection in the two longest wavelength bands is required or not. This criterion would keep the contamination by inactive galaxies and ULIRGS to a minimum, as shown by the color tracks of our SEDs and of the SED of Arp 220 produced by GRASIL (Silva et al. 1998). We note, however, that the WISE colors of AGNs are similar to those of intermediate redshift galaxies and ULIRGS, leading to a color degeneracy that must be broken by the inclusion of other data (e.g., optical broad-band photometry).
References
- Assef et al., (2008) Assef, R.J., et al. 2008, ApJ, 676, 286
- Assef et al. (2010a) Assef, R. J., et al. 2010a, ApJ, 713, 970
- Assef et al. (2010b) Assef, R. J., et al. 2010b, arXiv:1001.4529
- Bruzual & Charlot, (2003) Bruzual, G. & Charlot, S. 2003, MNRAS, 344, 1000
- Budavari et al., (2000) Budavari T., et al 2000, AJ, 120, 1588
- Coleman, Wu & Weedman, (1980) Coleman, G.D., Wu, C.-C. & Weedman, D.W. 1980, ApJS, 43, 393
- Devriendt, Guiderdoni & Sadat, (1999) Devriendt, J.E.G., Guiderdoni, B. & Sadat, R. 1999, A&A, 350, 381
- Jannuzi & Dey (1999) Jannuzi, B. T., & Dey, A. 1999, Photometric Redshifts and the Detection of High Redshift Galaxies, 191, 111
- Lacy et al. (2007) Lacy, M., et al. 2007, AJ, 133, 186
- Lacy et al. (2004) Lacy, M., et al. 2004, ApJS, 154, 166
- Moustakas et al. (2009) Moustakas et al. 2009, in prep.
- Richards et al., (2006) Richards, G.T. et al. 2006, ApJS, 166, 470
- Silva et al. (1998) Silva, L., Granato, G. L., Bressan, A., & Danese, L. 1998, ApJ, 509, 103
- Stern et al., (2005) Stern, D. et al. 2005, ApJ, 631, 163
- Weedman et al., (2006) Weedman, D.W. et al. 2006, ApJ, 651, 101