Observation of Ultra-high-energy Cosmic Rays
with the ANITA Balloon-borne Radio Interferometer
Abstract
We report the observation of sixteen cosmic ray events of mean energy of eV, via radio pulses originating from the interaction of the cosmic ray air shower with the Antarctic geomagnetic field, a process known as geosynchrotron emission. We present the first ultra-wideband, far-field measurements of the radio spectral density of geosynchrotron emission in the range from 300-1000 MHz. The emission is 100% linearly polarized in the plane perpendicular to the projected geomagnetic field. Fourteen of our observed events are seen to have a phase-inversion due to reflection of the radio beam off the ice surface, and two additional events are seen directly from above the horizon.
pacs:
95.55.Vj, 98.70.SaThe origin of ultra-high energy cosmic rays (UHECR) remains a mystery decades after their discovery Nagano00 ; Auger10 . Key to the solution will be increased statistics on events of high enough energy ( eV) to elucidate the endpoint of the UHECR energy spectrum as seen at Earth. The primary difficulty is the extreme rarity of events at these energies. Despite steady progress with experiments such as the Pierre Auger Observatory, there remains room for new methodologies. Cosmic rays have been detected for decades via impulsive radio geosynchrotron emission Jelley65 ; Porter65 ; Vernov67 ; Barker67 ; Fegan68 ; Hazen69 ; Hazen70 ; Spencer69 ; Fegan69 ; Allan71 ; Codalema ; LOPES ; LOPES10 but until now not in this crucial energy range, which offers the possibility of pointing the UHECRs back to their sources. We present data from the Antarctic Impulsive Transient Antenna (ANITA) ANITA-inst which represents the first entry of radio techniques into this energy range. We find 16 UHECR events, at least 40% of which are above eV, and we show compelling evidence of their origin as geosynchrotron emission from cosmic-ray showers. Our results indicate degree-scale precision for reconstruction of the UHECR arrival direction, lending strong credence to efforts to develop radio geosynchrotron detection as a competitive method of UHECR particle astronomy.
Geosynchrotron emission arises when the electron-positron particle cascade initiated by a primary cosmic ray encounters the Lorentz force in the geomagnetic field. The resulting acceleration deflects the electrons and positrons and they begin to spiral in opposite directions around the field lines FalckeGorham ; Suprun03 . In air, the particles’ radiation length is of order 40 g cm-2, a kilometer or less at the altitudes of air shower maximum development. Particle trajectories form partial arcs around the field lines before they lose enough energy to drop out of the shower. The meter-scale longitudinal thickness of the shower particle ‘pancake’ is comparable to radio wavelengths below several hundred MHz; thus the ensemble behavior of all of the cascade particles yields forward-beamed synchrotron emission which is partially or fully coherent in the radio regime. Therefore, the resulting radio impulse power grows quadratically with primary particle energy, and at the highest energies, yields radio pulses that are detectable at large distances. Current systems under development for detection of these radio impulses are co-located with cosmic-ray particle detectors on the ground to aid in cross-calibration Codalema ; LOPES ; LOPES10 . They detect showers with primary energies in the eV range because of their limited acceptance. No such system has reported a sample of eV UHECR events.
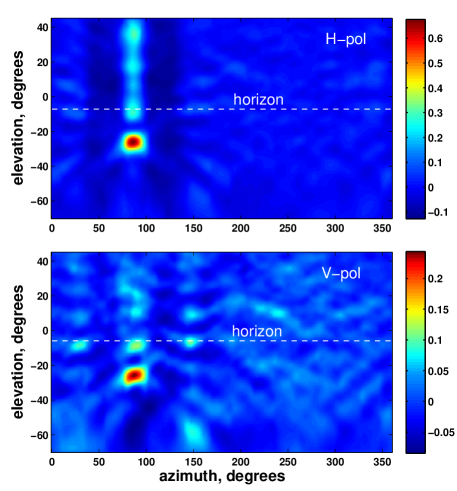
The ANITA long-duration balloon payload is launched from Williams Field near McMurdo Station, Antarctica. It takes advantage of the stratospheric South Polar Vortex to circle the Antarctic continent at altitudes of 35-37 km while synoptically observing an area of ice of order M km2. During flight, ANITA records all nanosecond-duration radio impulses over a 200-1200 MHz radio frequency band. The threshold is a few times the received power of thermal emission from the ice, picoWatts. The direction of detected signals, determined by pulse-phase interferometric mapping (Fig. 1,ANITA-inst ), is localized to an angular ellipse of (elevation azimuth) which is projected back onto the continent to determine the origin of the pulse. ANITA’s mission is the detection of ultra-high energy neutrinos via linearly-polarized coherent radio Cherenkov pulses from cascades the neutrinos initiate within the ice sheets. Virtually all impulsive signals detected during a flight are of anthropogenic origin, but such events can be rejected with high confidence because of their association with known human activity, which is carefully monitored in Antarctica. For its first flight, during the 2006-2007 Austral summer, ANITA’s trigger system was designed to maximize sensitivity to linearly polarized radio pulses, but purposely blinded to the plane of polarization. However, the entire polarization information – both vertical and horizontal (Vpol and Hpol) – was recorded for subsequent analysis. Since radio pulses of neutrino origin strongly favor vertical polarization, due to the geometric-optics constraints on the radio Cherenkov cone as it refracts through the ice surface, we used the Hpol information as a sideband test for our blind neutrino analysis.
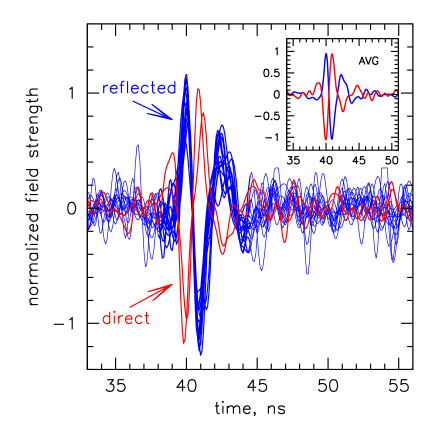
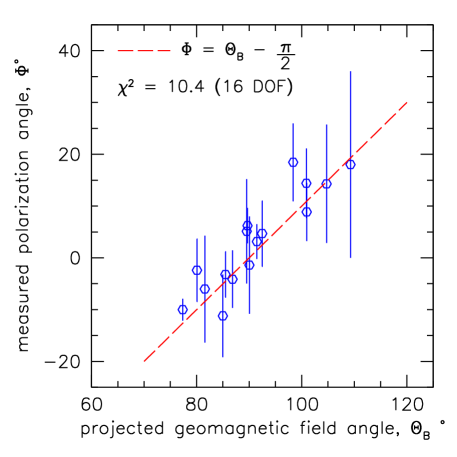
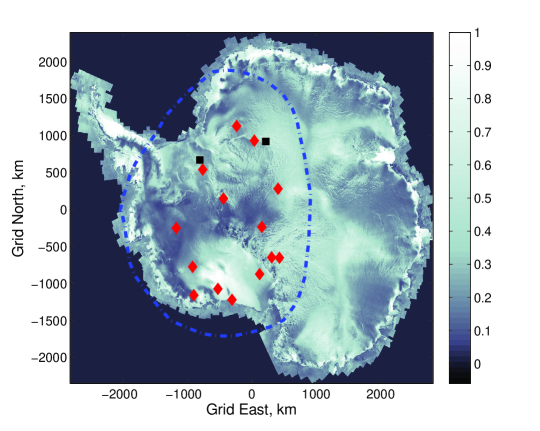
Our results were surprising: while the neutrino analysis (Vpol) gave a null result, a statistically significant sample of 6 Hpol events was found initially ANITA-1 , and a more sensitive analysis now yields 16. These events are randomly distributed around ANITA’s flight path (Fig. 2), uncorrelated in location to human activity or to each other, but closely correlated to each other in their radio pulse profile and frequency spectrum (Fig. 3, Top). Their measured planes of polarization are found in every case to be perpendicular to the local geomagnetic field (Fig. 4), as expected from geosynchrotron radiation. With two exceptions, the events reconstruct to locations on the surface of the ice; the two exceptional cases have directional origins above the horizon, but below the horizontal (from stratospheric balloon altitudes the horizon is about below the horizontal). Earth-orbiting satellites are excluded as a possible source since the nanosecond radio temporal coherence observed is impossible to retain for signals that propagate through the ionospheric plasma, which is highly dispersive in our frequency regime. The fourteen below-horizon events are inverted compared to the two above-horizon events, as expected for specular reflection (Fig. 3, Top). From these observations we conclude that ANITA detects a signal, seen in most cases in reflection from the ice sheet surface, which originates in the earth’s atmosphere and which involves electrical current accelerating transverse to the geomagnetic field. Such observations are in every way consistent with predictions of geosynchrotron emission from cosmic-ray air showers. In addition, the inherent spectral and time-domain similarity of our radio pulses, as well as their robust correlation to geomagnetic parameters, suggests that ANITA’s observations, which are at much greater distance and higher frequency than prior and current air-shower geosynchrotron observations, are less susceptible to near-field fluctuations of radio strength and plane of polarization. Such issues have been problematic in this field throughout most of its history.
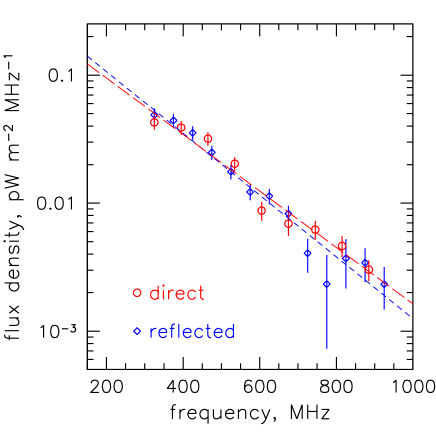
Our data represent the first broadband measurements of geosynchrotron emission in the UHF frequency range. The average observed radio-frequency spectral flux density of the above- and below-horizon events, shown in Fig. 3 (Bottom) is consistent with an exponential decrease with frequency. The lack of any statistically significant difference in the spectra for the direct and reflected events indicates that ice roughness is unimportant for the average surface reflection. To estimate the electric field amplitude at the source of these emissions, we model the surface reflection using standard physical-optics treatments developed for synthetic-aperture radar analysis. Such models use self-affine fractal surface parameters Shepard99 and Huygens-Fresnel integration over the specular reflection region to estimate both amplitude loss and phase distortion from residual slopes or roughness. In our case, we used digital-elevation models from Radarsat Radarsat to estimate surface parameters for each of the event reflection points, known to a few km precision. In most cases the surface parameters are found to be smooth, yielding only modest effects on the reflection amplitude; in a minority of the events, surface parameters were estimated to be rougher, but still within the quarter-wave-rms Rayleigh criterion for coherent reflection Radiobook . Fresnel reflection coefficients were determined using a mean near-surface index of refraction of , typical of Antarctic firn.
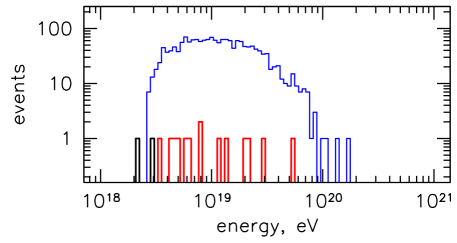
To estimate the primary energy for the observed events, we used two independent approaches that determine the amplitude of the radio emission and the mean angular offset of the observed events. One approach is based on current air-shower geosynchrotron radio emission simulations developed for surface arrays LOPES ; HF05 ; HEU07 , and the second approach is based on data-driven maximum-likelihood modeling in which a small set of parameters of a semi-empirical model were iteratively fit to the observed characteristics and total number of the events, given the known UHECR energy spectrum Auger10 . The former method had the advantage of extensive work done to develop full-scale air shower Monte Carlo simulations for such radio emission; however, the simulations are not directly relevant to the very different geometry and higher frequency range of ANITA’s observations, which are in the far-field compared to most ground array observations, and which also involve showers at much larger zenith angles than ground arrays usually observe. The latter data-driven approach used physically-motivated parameterizations to capture the radio emission characteristics. The resulting constraints imposed by the data, including amplitude, phase, and frequency-spectral content for all 16 events, were found to be effective in fitting both the primary energy and observed angular distribution of the events. Using the ground-based geosynchrotron models we found no self-consistent solution for the event energy and mean angular offset, and we conclude that ANITA’s observations are in tension with the current ground-based simulations. Our data-driven approach converged on a solution which gave estimated event energies as shown in Fig. 5 along with an overlay of the histogram of the energy distribution of simulated events seen in reflection. The implications of the data-driven solution are that the RF signals from these highly inclined, distant showers are significantly stronger than predicted by current geosynchrotron models. The mean energy of the ensemble of reflected events is estimated to be eV, approaching the threshold of the Greisen-Zatsepin-Kuzmin (GZK) cutoff G ; ZK , which marks the beginning of the absorption edge of UHECRs against the cosmic microwave background radiation. The large asymmetry in the systematic uncertainty is due to the uncertainty in the angular offset, which tends to strongly bias toward underestimating the event energy in our models. For the direct events, the mean energy is lower due to stronger direct signals, but the acceptance – limited to a narrow angular band around the horizon – is also much lower.
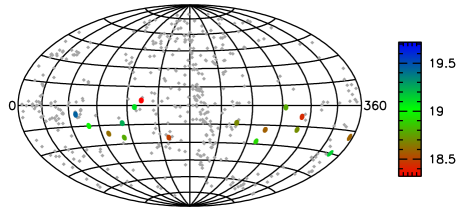
Based on our data-driven semi-empirical approach, we estimate a mean angle of observation relative to the true shower axis of . This angular precision is comparable to that of ground-based cosmic-ray observatories, and adequate to allow us to map these events back to the sky. The final error circle is in diameter after convolving with angular reconstruction precision and the modest tilts of each event locale, determined from Radarsat images at 200 m resolution Radarsat . The resulting map is shown in Fig. 5. Our event positions are uncorrelated to the sky positions of the Auger Observatory UHECR events, and the ensemble is also uncorrelated to AGN in the nearby universe. This is expected for events in this energy range where intergalactic magnetic deflection is significant. While our sample of UHE events is significantly smaller than the current totals for the Auger Observatory Auger10 , according to our models the acceptance of this method of UHE detection continues to increase at high energies, even beyond eV, whereas the acceptance of all ground-based UHECR observatories saturate well before this. Estimates from our simulations indicate that, after optimization for UHECR observation, a new 30 day flight of ANITA could detect a total of several hundred geosynchrotron events, with 60-80 above eV, and above the nominal GZK cutoff energy. We conclude that a balloon-borne observatory is viable at the highest cosmic-ray energies, and if the fidelity of models of the geosynchrotron process continues to improve at the rate it has in recent years, such an approach will be able to further elucidate possible correlations in cosmic-ray origin directions as well as the shape of the endpoint of the UHECR energy spectrum.
We are grateful to NASA, the US National Science Foundation, the US Dept. of Energy and the Columbia Scientific Balloon Facility for their generous support of these efforts.
References
- (1) Pierre Auger Collaboration, et al., Phys. Lett. B685 239-246, (2010).
- (2) Nagano, M. & Watson, A. A., Rev. Mod. Phys. 72, 689-732 (2000).
- (3) Jelley, J. V. et al., Nature 205, 327-328 (1965).
- (4) Jelley, J. V. et al., Nuovo Cimento A46, 649-667 (1966).
- (5) Porter, N. A., Long, C. D., McBreen, B., Murnaghan, D. J. B. & Weekes, T. C., Phys. Lett. 19, 415-417 (1965).
- (6) Vernov, S. N., Abrosimov, A. T., Volovik, V. D., Zalyubovskii, I. I. & Khristiansen, G. B., Pis’ma v ZhETF 5, 157-162 (1967). [Sov. Phys. JETP Letters 5, 126-130 (1967)]
- (7) Barker, P. R., Hazen, W. E., & Hendel, A. Z., Phys. Rev. Lett. 18, 51-54 (1967).
- (8) Fegan, D. J. & Slevin, P. J., Nature 217, 440-441 (1968).
- (9) Hazen, W. E., Hendel, A. Z., Smith, H., & Shah N. J., Phys. Rev. Lett. 22, 35-37 (1969).
- (10) Hazen, W. E., Hendel, A. Z., Smith, H., & Shah N. J., 24, 476-479 (1970).
- (11) Spencer, R. E., Nature 222, 460-461 (1969).
- (12) Fegan, D. J. & Jennings, D. M., Associated with Extensive Air Showers.Nature 223, 722-723 (1969).
- (13) Allan, H. R., Progress in Elementary Particles and Cosmic Ray Physics, 10, edited by Wilson, J. G. & Wouthuysen S. G. (North-Holland, Amsterdam, 1971), 171-304, and references therein.
- (14) Ardouin, D. et al., Astropart. Phys. 31, 192-200 (2009).
- (15) Nehls, S. et al., Nucl. Instrum. Meth. A589, 350-361 (2008).
- (16) LOPES Collaboration, W. D. Apel et al., Astropart. Phys. (in press) 2010.
- (17) Falcke, H. & Gorham, P., Astropart. Phys. 19, 477-494 (2003).
- (18) Suprun,D. A., Gorham, P. W., & Rosner, J. L., Astropart. Phys. 20 157-168, (2003).
- (19) Huege, T. & Falcke, H., Astropart.Phys. 24, 116-136 (2005).
- (20) Huege, T., Ulrich, R., Engel, R. 2007, Astropart. Physics 27, 392-405
- (21) Gorham, P. W. et al., Astropart. Phys. 32, 10-41 (2009).
- (22) Gorham, P. W. et. al., Phys. Rev. Lett. 103, 051103 (2009).
- (23) Shepard, M. K. & Campbell, B. A., Icarus 141, 156-171, (1999).
- (24) Liu, H., Jezek, K., Li, B., and Zhao, Z.. 2001. Boulder, CO: National Snow and Ice Data Center. Digital media.
- (25) Barclay, L. (editor),Propagation of Radiowaves, 2nd Ed., (Inst. Electr. Engineers: London), 2003.
- (26) Greisen, K., Phys. Rev. Lett. 16, 748-750 (1966).
- (27) Zatsepin, G. T. & Kuzmin, V. A., JETP Lett. 4, 78-80 (1966)[Pisma Zh. Eksp. Teor. Fiz. 4, 114-117 (1966)].