FIR colours and SEDs of nearby galaxies observed with Herschel††thanks: Herschel is an ESA space observatory with science instruments provided by Principal Investigator consortia. It is open for proposals for observing time from the worldwide astronomical community.
Abstract
Context. We present infrared colours (in the 25-500 m spectral range) and UV to radio continuum spectral energy distributions of a sample of 51 nearby galaxies observed with SPIRE on Herschel. The observed sample includes all morphological classes, from quiescent ellipticals to active starbursts. Active galaxies have warmer colour temperatures than normal spirals. In ellipticals hosting a radio galaxy, the far-infrared (FIR) emission is dominated by the synchrotron nuclear emission. The colour temperature of the cold dust is higher in quiescent E-S0a than in star-forming systems probably because of the different nature of their dust heating sources (evolved stellar populations, X-ray, fast electrons) and dust grain properties. In contrast to the colour temperature of the warm dust, the index sensitive to the cold dust decreases with star formation and increases with metallicity, suggesting an overabundance of cold dust or an emissivity parameter 2 in low metallicity, active systems.
Aims.
Methods.
Results.
Key Words.:
Galaxies: ISM; spiral; elliptical and lenticular; Infrared: galaxies1 Introduction
The energetic output of any extragalactic source can be determined by constructing its spectral energy distribution (SED).
The stellar component emits in the ultraviolet (UV) to near-infrared (NIR) domain, young and massive stars dominating the ultraviolet UV111The UV
emission of early-type galaxies is however due to an old stellar population (UV upturn; e.g. O’Connell 1999; Boselli et al. 2005)
and old stars the NIR. Dust, produced by the aggregation of metals injected into the interstellar medium (ISM) by massive stars through stellar winds and supernovae,
efficiently absorbs the stellar light, in particular that at short wavelengths, and re-emits it in the infrared domain (5m-1mm).
At longer wavelengths, the emission of normal galaxies is generally dominated by the loss of energy of relativistic electrons
accelerated in supernovae remnants (Lequeux 1971; Kennicutt 1983) (synchrotron emission).
Reconstructing SEDs is thus of fundamental importance for quantifying the relative contribution of the different emitting sources
to the bolometric emission of galaxies and studying the physical relations between the various galaxy components (e.g., interstellar radiation field,
metallicity, dust and gas content, magnetic fields). In particular, the importance of the infrared domain explored by Herschel
resides in the dust that, by means of the absorption and scattering of UV, optical and NIR photons, modifies the stellar spectra of galaxies.
SEDs are thus crucial for quantifying dust extinction and reconstructing the intrinsic distribution of the different stellar populations
within galaxies. Furthermore, fitting infrared SEDs is necessary for measuring the dust properties such as mass, temperature, fraction of PAHs,
and hardness of the interstellar radiation field (ISRF), all crucial ingredients in the study of the physical processes within the ISM
(e.g., Draine et al. 2007).
The interpretation of the infrared SEDs of normal galaxies has already been the subject of
several studies (Dale & Helou 2002; Dale et al. 2001; 2005; 2007; Chary & Elbaz 2001) even within the Virgo cluster region
(Boselli et al. 1998; 2003). These however were generally limited in the infrared to 170 m, the
spectral domain covered by ISO or Spitzer. These new Herschel data allow us to extend, for the first time for such a large sample of
normal galaxies, to the sub-mm domain ( 500 m) where the emission is dominated by the coldest dust component.
This unexplored spectral range is crucial for determining the total mass of dust and for an accurate determination
of the total infrared luminosity. This paper presents the first, Herschel-based
statistical study of the properties of the SED of a sample of nearby, normal galaxies
spanning a large range of morphological type and luminosity.
2 The data
Galaxies analysed in this work were observed during the Herschel (Pilbratt et al. 2010) SPIRE (Griffin et al. 2010)
science demonstration phase as part of the Herschel Reference Survey (HRS),
a guaranteed time key project designed to observe with SPIRE a volume-limited, K-band-selected, complete sample of
nearby galaxies (Boselli et al. 2010), and the Herschel Virgo Cluster Survey (HeViCS), an open time key project
focused on covering 60 sq.deg. of the Virgo cluster with PACS and SPIRE (Davies et al. 2010). To these, we added
two galaxies of the Very Nearby Galaxy Sample, M81 (Bendo et al. 2010) and M82 (Roussel et al. 2010).
The present sample is thus composed of 51 objects with photometric
data in the three SPIRE bands out of which 33 are Virgo members, 13 background, 3 isolated and 2 (M81 and M82) nearby galaxies.
The Herschel data used in this work were processed using the Level 1 procedures described in Pohlen et al. (2010),
fluxes being multiplied by a factor of 1.02, 1.05, and 0.94 at 250, 350, and 500 m respectively, to take into account the updated
flux calibrations. Integrated flux densities were extracted
using the QPHOT task of IRAF. We assume a conservative uncertainty in the flux density of 30%. This includes uncertainties on the
absolute flux calibration (15 %; Swinyard et al. 2010), uncertainties introduced by the map-making technique and the possible contamination of background objects
(on and off source), which might affect the flux extraction procedures. Independent observations of the galaxies NGC 4438 and NGC 4435
(the first one being an interacting system with extended morphology, the second one a point-like early-type source)
performed during both the HRS and the HeViCS surveys, provided consistent results to within 10 %. This should thus be considered as an upper limit
to the uncertainty introduced by map making and flux extraction. Absolute flux calibration uncertainties, being systematic in the three bands,
do not affect the observed trends in the SPIRE colour-colour diagrams.
The dataset analysed here includes SPIRE data and measurements available at other frequencies, from UV to radio centimetre. Most of these data were
taken from the GOLDMine database (Gavazzi et al. 2003).
Despite this sample not being complete in any sense, and being dominated by Virgo cluster galaxies for which perturbations
induced by the cluster environment may lead to systematic differences in the emission properties relative to similar isolated objects even
in the FIR spectral domain (Boselli & Gavazzi 2006; Cortese et al. 2010), this is the first sample
observed with Herschel that is suitable for a statistical analysis since it consists of well-known nearby
galaxies spanning a wide range of both morphological type and luminosity.
3 Far infrared colours
A phenomenological, model-independent technique for quantifying the spectral properties of galaxies is that of determining their colours. To do this, we combine SPIRE and IRAS flux densities, the latter being sensitive to the warm dust component. Figure 1 shows the IR colours of the sample galaxies.
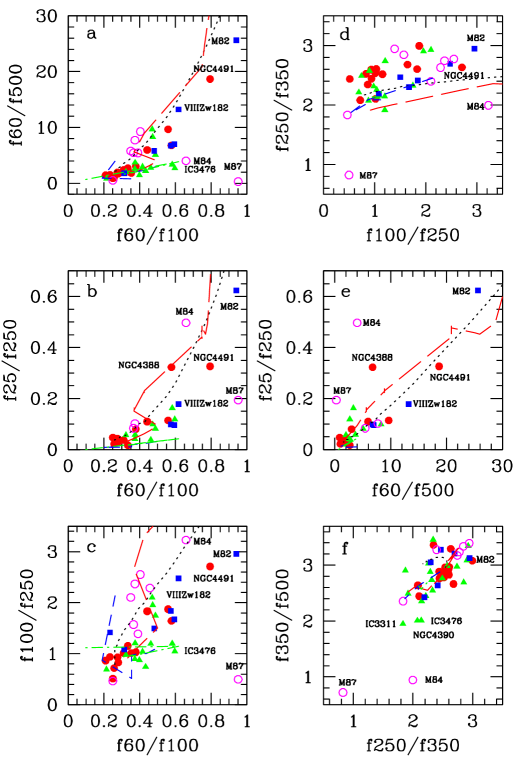
A first analysis of Fig. 1 indicates that in star-forming galaxies the flux density ratios , , or are strongly correlated with the generally used IRAS colour index (panels a, b and c). The dynamic range covered by , however, is a factor of about 30 larger than that covered by the flux density ratio, and is thus a much clearer tracer of the average temperature of the bulk of the dust component. Starburst galaxies, generally defined as those objects with 0.5 (Rowan-Robinson & Crawford 1989) have spanning from 3 to 30. The prototype starburst galaxy in the local universe M82 has a of 26, significantly larger than NGC 4491, a starburst in the Virgo cluster, and VIIIZw182, a background merging system at = 0.07. Early spirals (Sa-Sb, red filled dots, see Table 1) have colours generally colder than Sbc-Scd (green triangles) and Sd, Im, BCD, and Irr (blue squares). Early-types with a synchrotron-dominated IR emission (M87, M84) are well separated in all IRAS-SPIRE or SPIRE colour diagrams with respect to the other dust-dominated E-S0a. The remaining early-types have colour indices indicating that the cold dust has a higher temperature than in star-forming systems. As for the interpretation of the FIR properties of the early-type galaxies in the SINGS galaxy sample (Draine et al. 2007), higher dust-weighted mean starlight intensities can explain the high FIR colour temperatures of E/S0 galaxies. However, the relative importance of X-ray heating (Wolfire et al. 1995), stochastic heating, heating from fast electrons in the hot gas, as in supernovae, and the (unknown) size-distribution of dust grains in these environments with low-density ISM needs further exploration.
|
Notes:
1: excluding the synchrotron-dominated M84 and M87
2: excluding the starburst NGC 4491
The empirical SEDs of Dale & Helou (2002), Chary & Elbaz (2001), and Boselli et al. (2003), despite possible uncertainties in the absolute flux calibration (15 %), only qualitatively cover the wide range of infrared colours observed in our sample even excluding the radio galaxies M87 and M84, and underpredict the ratio for a given ratio (panel d). Furthermore, these models do not reproduce the coldest colour temperatures observed in the SPIRE colour diagram versus (panel f). It is also interesting that even the most active galaxies such as M82 and NGC 4491, which are expected to be dominated by warm dust heated by the dominant starburst, host a cold dust component as traced by the 500 m emission which is underestimated by models (see panel a).
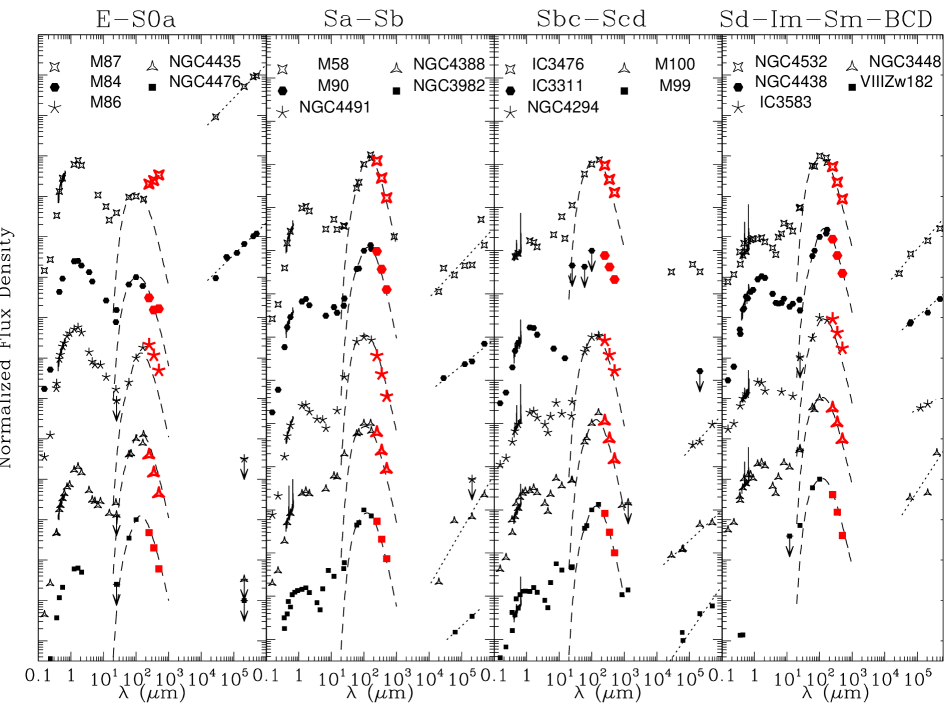
4 Spectral energy distributions
Combining integrated flux densities from UV to radio centimetre we constructed the observed SED of the target galaxies. Figure 2 shows some examples of UV to radio centimetre SEDs of galaxies according to their morphological type. Figure 2 shows that in the elliptical galaxies M87 and M84, the sub-mm domain is dominated by synchrotron emission. M87 is a powerful radio galaxy (Virgo A), where synchrotron dominates down to 10 m (Baes et al. 2010). M84 is a moderately active radio galaxy with a luminosity at 20 cm of 2 1023 W Hz-1. In spirals, the SPIRE data closely follow a modified black body (=2) of temperature 20 K (dashed line) (e.g., Bendo et al. 2003; 2010). This however can be taken just as a first order approximation since quantitative data in relation to dust can be determined only after an accurate SED fitting. To identify the heating sources of the emitting dust, we can use any tracer of the hardness of the interstellar radiation field. Here we adopt the birthrate parameter , defined as the ratio of the present star formation rate (SFR) to the SFR averaged along the life of the galaxy222The birthrate parameter is also called the specific star formation rate, hence . Following Boselli et al. (2001, 2009), SFR is proportional to the extinction-corrected UV or H flux, and to the NIR flux. Therefore is tightly related to the hardness of the UV radiation field. Figure 3 shows the relationship between the two colour indices and and the birthrate parameter, this last determined for late-type galaxies only.
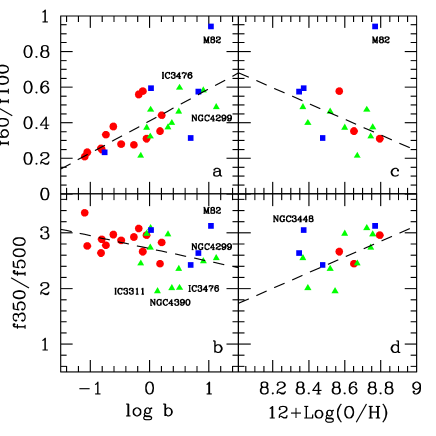
Figure 3 shows that the colour index , sensitive to the presence of warm dust, increases with , indicating that galaxies with the warmest dust temperature are those at present most active in star formation ( 1). In contrast, the temperature of the cold dust appears to be anticorrelated with , indicating an excess of the cold dust emission in the most active galaxies. These trends with may be non-universal since they might be related to the presence of cluster galaxies, which are characterised by a reduced star formation activity ( 0.1) because of their interaction with the cluster environment (e.g., Boselli & Gavazzi 2006). An opposite behaviour of the and colour indices is also present when plotted versus the gas metallicity index 12+log(O/H) (determined using the prescriptions of Kewley & Ellison (2008) based on the Pettini & Pagel (2004) calibration and using mainly the Gavazzi et al. 2004 spectroscopic data), i.e., while decreases with metallicity (with the exception of the starburst M82), seems to increase with 12+log(O/H), with a possible exception for the interacting system NGC 3448 (Arp 205). A similar radial trend with metallicity is also observed for both M99 and M100 (Pohlen et al. 2010). This result is consistent with the presence of emission at 850 m that could originate in 10 K dust (Galliano et al. 2005; Galametz et al. 2010; O’Halloran et al. 2010) or dust with 2 (e.g. Bendo et al. 2006), which may be more prominent in low metallicity galaxies. A value of 2 implies an enhanced contribution from carbonaceous dust because amorphous hydrocarbons have values of in the range 1-1.5. Before attempting to determine the origin of this cold dust component, this interesting result should be confirmed on a more robust statistical basis.
5 Conclusions
Our analysis has enabled us to reach the following conclusions: a) the infrared colour index is more capable of detecting a starburst than . b) Normal galaxies show a gradual increase in their dust temperature along the Hubble sequence, from Sa to Sc-Im-BCD with the exception of E-S0a, where the dust temperature is higher than in star-forming systems probably because of the different nature of their dust heating sources. c) SPIRE colours can be used to discriminate thermal from synchrotron emission in radio galaxies. d) In contrast to the warm dust, the colour temperature index decreases with star formation activity and increases with metallicity. This admittedly weak evidence might be indicative of an overabundance of cold dust or an emissivity parameter 2 in low metallicity, active systems.
Acknowledgements.
SPIRE has been developed by a consortium of institutes led by Cardiff University (UK) and including Univ. Lethbridge (Canada); NAOC (China); CEA, LAM (France); IFSI, Univ. Padua (Italy); IAC (Spain); Stockholm Observatory (Sweden); Imperial College London, RAL, UCL-MSSL, UKATC, Univ. Sussex (UK); and Caltech/JPL, IPAC, Univ. Colorado (USA). This development has been supported by national funding agencies: CSA (Canada); NAOC (China); CEA, CNES, CNRS (France); ASI (Italy); MCINN (Spain); Stockholm Observatory (Sweden); STFC (UK); and NASA (USA).References
- (1) Bendo, G., et al., 2010, A&A, this issue
- (2) Bendo, G., Joseph, R., Wells, M., et al., 2003, AJ, 125, 2361
- (3) Bendo, G., Dale, D., Draine, B., et al., 2006, ApJ, 652, 283
- (4) Boselli, A., Gavazzi, G., 2006, PASP, 118, 517
- (5) Boselli, A., Lequeux, J., Sauvage, M., et al., 1998, A&A, 335, 53
- (6) Boselli, A., Gavazzi, G., Donas, J., Scodeggio, M., 2001, AJ, 121, 753
- (7) Boselli, A., Gavazzi, G., Sanvito, G., 2003, A&A, 402, 37
- (8) Boselli, A., Cortese, L., Deharveng, JM., et al., 2005, ApJ, 629, L29
- (9) Boselli, A., Boissier, S., Cortese, L., Buat, V., Hughes, T., Gavazzi, G., 2009, ApJ, 706, 1527
- (10) Boselli, A., Eales, S., Cortese, L., et al., 2010, PASP, 122, 261
- (11) Chary, R., Elbaz, D., 2001, ApJ, 556, 562
- (12) Cortese, L., Davies, J., Pohlen, M., et al., 2010, A&A, this issue
- (13) Dale, D., Helou, G., 2002, ApJ, 576, 159
- (14) Dale, D., Helou, G., Contursi, A., Silbermann, N., Kolhatkar, S., 2001, ApJ, 549, 215
- (15) Dale, D., Bendo, G., Engelbracht, C., et al., 2005, ApJ, 633, 857
- (16) Dale, D., Gil de Paz, A., Gordon, K., et al., 2007, ApJ, 655, 863
- (17) Davies, J., Baes, M., Bendo, G., et al., 2010, A&A, this issue
- (18) Draine, B., Li, A., 2007, ApJ, 657, 810
- (19) Draine, B., Dale, D., Bendo, G., et al., 2007, ApJ, 663, 866
- (20) Galametz, M., et al., 2010, A&A, this issue
- (21) Galliano, F., Madden, S., Jones, A., Wilson, C., Bernard, J., 2005, A&A, 434, 867
- (22) Gavazzi, G., Boselli, A., Donati, A., Franzetti, P., Scodeggio, M., 2003, A&A, 400, 451
- (23) Gavazzi, G., Zaccardo, A., Sanvito, G., Boselli, A., Bonfanti, C., 2004, A&A, 417, 499
- (24) Griffin, M., et al., 2010, A&A, this issue
- (25) Kennicutt, R., 1983, A&A, 120, 219
- (26) Kewley, L., Ellison, S., 2008, ApJ, 681, 1183
- (27) Lequeux, J., 1971, A&A, 15, L42
- (28) O’Connell, R., 1999, ARA&A, 37, 603
- (29) O’Halloran et al. 2010, A&A, this issue
- (30) Pettini, M., Pagel, B., 2004, MNRAS, 348, L59
- (31) Pilbratt, G., et al. 2010, A&A, this issue
- (32) Pohlen, M., et al., this issue
- (33) Roussel, H., et al., 2010, A&A, this issue
- (34) Rowan-Robinson, M., Crawford, J., 1989, MNRAS, 238, 523
- (35) Swinyard, B., Ade, P, Baluteau, JP., et al., 2010, A&A, this issue
- (36) Wolfire, M., Hollenbach, D., McKee, C., Tielens, A., Bakes, E., 1995, ApJ, 443, 152