The effects of star formation on the low-metallicity ISM:
NGC4214 mapped with Herschel††thanks: Herschel is an ESA
space observatory with science instruments provided by
European-led Principal Investigator consortia and with important
participation from NASA./PACS spectroscopy
We present Herschel/PACS spectroscopic maps of the dwarf galaxy NC4214 observed in 6 far infrared fine-structure lines: [C ii] 158m, [O iii] 88m, [O i] 63m, [O i] 146m, [N ii] 122m, and [N ii] 205m. The maps are sampled to the full telescope spatial resolution and reveal unprecedented detail on 150 pc size scales. We detect [C ii] emission over the whole mapped area, [O iii] being the most luminous FIR line. The ratio of [O iii]/[C ii] peaks at about 2 toward the sites of massive star formation, higher than ratios seen in dusty starburst galaxies. The [C ii]/CO ratios are 20 000 to 70 000 toward the 2 massive clusters, which are at least an order of magnitude larger than spiral or dusty starbursts, and cannot be reconciled with single-slab PDR models. Toward the 2 massive star-forming regions, we find that L[CII] is 0.5 to 0.8% of the LTIR. All of the lines together contribute up to 2% of LTIR. These extreme findings are a consequence of the lower metallicity and young, massive-star formation commonly found in dwarf galaxies. These conditions promote large-scale photodissociation into the molecular reservoir, which is evident in the FIR line ratios. This illustrates the necessity to move to multiphase models applicable to star-forming clusters or galaxies as a whole.
Key Words.:
galaxies:ISM – galaxies:individual (NGC4214) – ISM: line and bands photon-dominated regions – galaxies: dwarf1 Introduction
As building blocks of larger galaxies, dwarf galaxies in the early universe presumably played an important role in the evolution of galaxies we see today. Understanding how stars form and evolve under low metallicity conditions and the process of subsequent enrichment of the interstellar medium (ISM) will help us constrain possible scenarios of galaxy formation and evolution. The Local Group dwarf galaxies provide laboratories to study in detail the effects of the lower metal abundance on the process of star formation and the feedback on the ISM.
To examine the interplay between massive star formation and low metallicity ISM, we have mapped the far infrared (FIR) fine structure lines in the Local Group Magellanic-type irregular galaxy, NGC4214, as part of the Herschel key proposal, SHINING (P.I. E. Sturm). NGC4214 harbors 2 main star-forming complexes containing hundreds of O stars as well as a super star cluster (SSC). Our aim here is to characterise the physical conditions and the structure of the different phases of the ISM in NGC4214. The proximity of NGC4214 (2.9Mpc, Maíz-Apellániz et al., 2002) and its low-metallicity (, Kobulnicky & Skillman, 1996) make it a choice target. The PACS spectrometer onboard the Herschel Space Observatory allows us to zoom into the low-metallicity photodissociation regions (PDRs) and their surroundings, tracing physical properties from 125 to 165 pc size scales.
The tools for this study are the FIR fine-structure lines arising from some of the most abundant species C, O, and N, which provide the most important cooling channels in the neutral and diffuse ionized ISM of galaxies. These lines trace H ii regions and PDRs, which are neutral atomic and molecular regions where penetrating FUV photons (6 eV 13.6 eV) dominate the energy balance and the chemical composition of the gas. Most of the ISM in galaxies is contained in PDRs. The FIR lines in combination with PDR models (Tielens & Hollenbach, 1985; Wolfire et al., 1990; Ferland et al., 1998; Kaufman et al., 1999; Abel et al., 2005; Röllig et al., 2006) can unveil the structure of these regions, which depends on both the strength of the FUV radiation field density () illuminating the cloud and the hydrogen density ().
2 Observations and data reduction
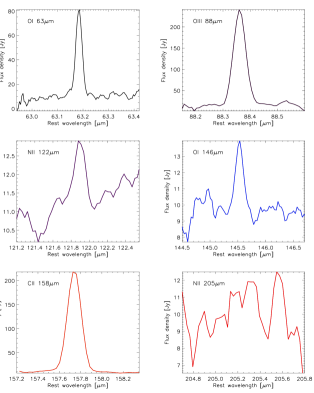
We mapped the 6 FIR fine-structure lines, [C ii] 158, [O iii] 88, [O i] 63, [O i] 146, [N ii] 122, and [N ii] 205m, using the PACS spectrometer (Poglitsch et al., 2010) on Herschel (Pilbratt et al., 2010). The PACS array consists of 5 x 5 spatial pixels of 9.4′′ size offering a total field-of-view of 47′′ on the sky. Each spatial pixel covers 16 spectral elements with a spectral resolution ranging from 100 to 300 km/s. The lines are not spectrally resolved for NGC4214. The 6 lines were observed in raster mapping mode over a total of 15h during the Science Demonstration Phase. The [O iii] 88m and [O i] 63m (“blue”) were mapped with 5 x 5 rasters and the other lines (“red”) with 3 x 3 rasters, all centered on 12h15m39.08s,+36d19m35.9s (J2000). Each raster pointing is separated by approximately half of the array (22′′, 24′′) in the “red” range and approximately one third of the array (14.5′′, 16′′) in the “blue” range, giving homogeneous coverage of the galaxy and a total field of view of 1.6′x1.6′. We selected the chop-nod mode with a chop throw of 6′ off the source.
The data were reduced with the PACS spectrometer pipeline of the Herschel Interactive Processing Environment (HIPE) v3.0.455. We show the 6 individual lines in Fig. 1. We fitted a spline plus Gaussian to the line and baseline and measured the noise of the residual. In this way, we estimate the overall noise in the maps to be 0.17, 0.42, 0.27, 0.07, 0.06, and 0.30 Jy/pix for the [C ii] 158m, [O iii] 88m, [O i] 63m, [O i] 146m, [N ii] 122m, and [N ii] 205m lines, respectively. We applied a flat field correction and divided by calibration correction factors of 1.1 (“red”) and 1.3 (“blue”) to obtain the final reduced maps.
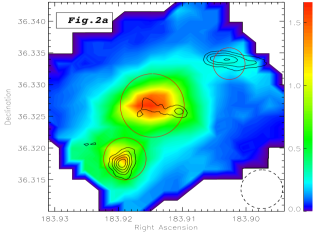
The rasters are combined by a drizzle scheme to produce final maps with 4′′ grid pixel size for the [O iii] and [O i] 63m lines, and 6′′ for the other lines. To compare the lines and create ratio maps, we scaled all maps down to the coarser resolution of 6′′. We analyze separately the whole map as well as three specific regions corresponding to NGC4214-I (center), NGC4214-II (southeast), and NGC4214-III (northwest). These are represented by the red circles on Fig. 2a. Regions I and II are centered on the [C ii] peaks, with radii encompassing most of the emisson (at the level of 50% of the peak), while region III was chosen by taking into account the peak of the CO emission as well as the brightest counterpart of the [C ii] emission (), which is truncated by the map edge.
3 Results
| NGC4214 | total | I | II | III |
|---|---|---|---|---|
| RA [J2000] | 12 15 39.1 | 12 15 39.1 | 12 15 40.5 | 12 15 36.7 |
| Dec [J2000] | 36 19 35.9 | 36 19 35.9 | 36 19 05.9 | 36 20 01.0 |
| Aperture (′′) | - | 18 | 12 | 9 |
| Quantity | Line ratios | |||
| 0.996 | 1.40 | 1.71 | 0.264 | |
| (0.009) | (0.007) | (0.014) | (0.053) | |
| 0.058 | 0.060 | 0.072 | - | |
| (0.015) | (0.011) | (0.023) | (0.095) | |
| 0.445 | 0.474 | 0.560 | 0.438 | |
| (0.007) | (0.004) | (0.008) | (0.035) | |
| 0.026 | 0.028 | 0.040 | - | |
| (0.007) | (0.005) | (0.013) | (0.042) | |
| [] | 37.7 | 8.60 | 4.52 | 0.522 |
| 2.77 | 8.11 | 6.50 | 11.1 | |
| + ) / | ||||
| / | 5.30 | 7.93 | 5.71 | 7.70 |
| / | 33.8 | 75.0 | 22.9 | 4.73 |
The Herschel/PACS maps clearly resolve the two star-forming regions NGC4214-I and NGC4214-II, where most of the emission originates. The [N ii] 122m emission is rather faint and the [N ii] 205m is not detected. The most prominent lines are the [C ii] 158m, [O iii] 88m, [O i] 63m, and, to a lesser extent, the [O i] 146m and [N ii] 122m lines. The emission from the [C ii] line is the most extended of all of the lines (Fig. 2a) and covers the entire map. The total [C ii] luminosity in the PACS map is with about 50% of the emission originating in the two bright star-forming sites and 50% in the surrounding medium. The [C ii] 158m line is known to be one of the most important tracers of physical conditions in PDRs because it is so luminous and has a low critical density for collisional excitation.
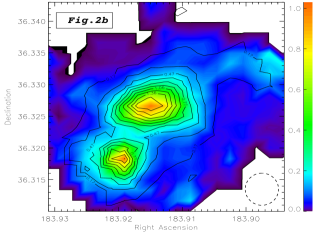
Comparing the [C ii] and [O i] 63m line emission, we find that the latter is a factor of two weaker integrated over the mapped region. These two lines show a very similar distribution (Fig. 2b), both peaking at the 2 star-forming sites and spanning a small range of ratios. These ratios vary by less than a factor of two across the entire map. The [C ii] line, in principle, may originate in the PDR and the diffuse media alike. The observed resemblance between the [O i] 63m and [C ii] maps (Fig. 2b) suggests that the [C ii] is dominated by the PDR component (see also Sect. 3.1).
The [O i] 146m line is fainter than the [O i] 63m line, and is barely detected in the outer regions of the map. Toward the 2 peaks, and in total, the ratios of the two [O i] lines are about 0.06 (Table 1), and do not vary much across the map. These ratios are insensitive to density since their critical densities are not very different. For moderate densities (n ), this ratio is more indicative of the gas temperature.
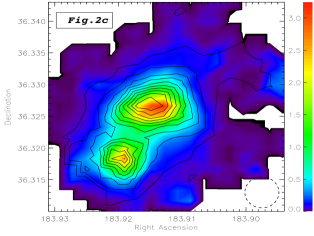
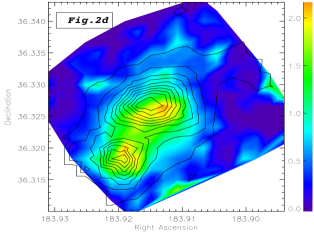
The [O iii] 88m line is the brightest of all lines observed in NGC4214 (Fig. 2c). A comparison of the [O iii] line map with the optical images of NGC4214 (Úbeda et al., 2007), illustrates that it coincides with the star formation sites and exhibits a peak toward the position of the SSC in NGC4214-I, thus tracing the ionization source. High ratios of [O iii] to [C ii] observed here (Table 1) are not commonly seen in dusty starbursts or spiral galaxies (Negishi et al., 2001; Malhotra et al., 2001), an example being M82 with a ratio of 0.7. However, high ratios have been observed in the observations of dwarf galaxies and may be explained by hot stars surrounded by optically thick PDRs (Hunter et al., 2001). The [O iii] / [C ii] ratio map of NGC4214 (Fig. 2d) exhibits peaks in intensity toward the 2 star-forming sites but drops off rapidly away from the peaks. We note that the peaks of the [O iii] / [C ii] ratio map appear to be offset from those of the [C ii] by 6′′, which is larger than the expected relative pointing uncertainty (on the order of several arcsecs). The shift in the [O iii] / [C ii] peak, corresponding to a shift of 80 pc, if real, implies that the ratio peak coincides with the SSC peak, the probable source of the ionization. Since O++ has an ionization potential of 35.1 eV, [O iii] traces the highly ionized medium around early O stars and is thus more confined than the [C ii] emission. This is consistent with the AKARI findings that the [O iii] 88m line traces excitation sources even more accurately than the radio continuum (Okada et al., 2009).
We show the CO contours from Walter et al. (2001) in Fig. 2a. There is a striking distinction between the three different regions in terms of [C ii]/CO (Table 1). NGC4214-III probably hosts little star formation, which explains its paucity in excited FIR line emission compared to its molecular reservoir. However, even the two main regions of active star formation exhibit very different [C ii]/CO ratios. One explanation of these high [C ii]/CO ratios is the presence of small clumps of CO embedded in large PDR envelopes. Applying this interpretation to these observations would imply that the star formation in the central region of NGC4214-I has (already) affected (photodissociated) most of the surrounding molecular reservoir, while many of the molecular clouds in the south eastern region are relatively unscathed. It is interesting to remark that NGC4214-II has a younger stellar population than NGC4214-I (Úbeda et al., 2007).
Using Spitzer data, we estimate the total infrared luminosity (LTIR) over the area mapped with PACS, following Dale & Helou (2002) (see Table 1). The [C ii] line alone accounts for 0.5% of the LTIR111To compare ratios using LFIR in the literature, for dwarf galaxies (Hunter et al., 2001), LTIR is approximately a factor of 2 greater than LFIR, as defined by IRAS 60 and 100m fluxes (Helou et al., 1988)., which is at the high end of the range of normal galaxies and starburst galaxies (Stacey et al., 1991; Negishi et al., 2001) and more typical of the elevated ratios seen in dwarf galaxies (Madden, 2000; Hunter et al., 2001). Toward the two bright star-forming regions, L[CII]/LTIR is similar to 30 Dor in the LMC (Poglitsch et al., 1995; Rubin et al., 2009). Likewise, L[OIII]/ either toward these 2 prominent star-forming regions or over the entire galaxy is an order of magnitude higher than what Negishi et al. (2001) find for normal and starburst galaxies. The FIR lines of the 2 star-forming regions contribute all together up to about 2% of their TIR flux.
3.1 Origin of the [C ii] line
Before we can consider PDR model solutions to the observations, we consider the origin of the C+ line, which is most often used as a diagnostic of PDR conditions because it is a primary coolant in PDRs. However, since the ionization potential of carbon (11.3 eV) is less than that of hydrogen, C+ can exist in both the ionized and neutral gas. In galactic nuclei, most of the [C ii] emission arises from the PDRs (Stacey et al., 1991; Negishi et al., 2001). With an ionization potential of 14.53 eV, the N+ emission originates only from the H ii regions. Therefore we use the [N ii] line to correct for a possible contribution of the ionized gas to the C+ line.
The [N ii] 205m line was not confidently detected and could not be analyzed but the [N ii] 122m line is detected in the two star-forming regions. We see evidence of [N ii] 122m emission over the central 3x3 pixels in each region and average them to obtain a higher signal-to-noise ratio and measure the intensity of the line in these two regions. The observed ratios of the [N ii] 122m/[C ii] 158m are 0.04 and 0.03 in NGC4214-I and NGC4214-II, respectively. Following Malhotra et al. (2001), we estimate a maximum contribution of the ionized medium to the [C ii] emission to be a factor of 11 times the flux of the [N ii] 122m. Therefore, at least 60% of the [C ii] emission originates in PDRs. To bound the physical conditions in NGC4214, we model the PDR (see Sect. 3.2) assuming that all [C ii] emission is from PDRs and that only 60% originates in PDRs.
3.2 Results from PDR models
As a first diagnostic of PDR properties, we use the model of Kaufman et al. (1999) by means of the web interface of the PDR Toolbox222http://dustem.astro.umd.edu/pdrt/index.html. This model, which assumes solar metallicity, calculates the intensity of the main PDR lines as a function of the physical conditions, which are the incident radiation field () and the density (). We can compare our observed line intensities to the model predictions to narrow down the range of the physical conditions.
We use [O i] 63m/[C ii], [O i] 146m/[C ii], [O i] 146m/[O i] 63m, and the ([C ii]+[O i] 63m)/ITIR and [C ii]/CO (Table 1). The ratio ([C ii]+[O i] 63m)/ITIR is interesting because it relates the “total” cooling of the gas to the total cooling by the dust, so measures the efficiency of the dust to heat the gas (photoelectric efficiency). The observed [C ii]/CO ratio disagrees significantly with those predicted by the best-fit solution for all the other line ratios. This has been noted before for other low metallicity PDRs (see Sect. 3.3) and may be a geometry or low metallicity effect not taken into account in the model. Using all the above line ratios except [C ii]/CO, the maximum values found for NGC4214-I are 333in units of Habing field: erg cm-2 s-1 and . For NGC4214-II, we find that and . The solution for the third region NGC4214-III infers a lower incident radiation field (). The quoted values above take into account the contribution to the [C ii] intensity of the ionized medium between 0 and 40%. In all cases, these PDR parameters are indicative of a relatively moderate gas density and radiation field.
3.3 [C ii]-to-CO ratio
We measure [C ii]/CO intensity ratios of 70 000 and 20 000 for NGC4214-I and II, respectively (Table 1). These values are at least an order of magnitude higher than those inferred for spiral or starburst galaxies (Stacey et al., 1991; Negishi et al., 2001) but in closer agreement with those of dwarf galaxies (Poglitsch et al., 1995; Madden et al., 1997; Hunter et al., 2001). NGC4214-I has a [C ii]/CO similar to 30 Dor (Poglitsch et al., 1995; Rubin et al., 2009). This high ratio could be explained by the paucity of dust; less dust shielding allows the photodissociating FUV photons to penetrate deeper into the cloud, reducing the size of the CO cores while leaving a large [C ii]-emitting envelope. This envelope may well contain self-shielded molecular hydrogen. If this were true, the [C ii] would be a more accurate tracer of the molecular reservoirs in low metallicity environments than CO.
4 Conclusion
These observations of NGC4214 with Herschel/PACS have enabled us to spatially resolve the FIR fine-structure lines in the low metallicity dwarf galaxy NGC4214. A very striking result from the mapping is the brightness of the [C ii] 158m , [O i] 63m, and the [O iii] 88m lines. The [C ii] alone corresponds to 0.5% of the total infrared luminosity. The combined luminosity of the FIR lines reaches 2% of the LTIR. The [O iii] 88m line is more confined to star-forming regions and the [O iii]/[C ii] reaches almost a factor of 2 close to the SSC in NGC4214-I.
The [C ii]/CO ratios are also exceptionally high (20 000 70 000). These extreme ratios are indicative of an ISM that is strongly affected by photodissociation and reflect the combined effects of low metallicity ISM and intense star formation. It should be borne in mind that, when comparing with models, the models predict line ratios for a single, homogeneous PDR. In reality, we observe a multiphase medium that probably harbors many extremely different PDR conditions. Therefore, this preliminary comparison indicates the need for more complete (complex) models to be able to derive accurate physical quantities.
Acknowledgements.
We would like to thank the referee for suggestions that improved this letter. Many thanks to Fabian Walter for sharing his valuable CO data with us, and Leonardo Úbeda for his HST images for us to compare with. We are also extremely grateful for the help of the PACS ICC and Herschel Science Centre. PACS has been developed by a consortium of institutes led by MPE (Germany) and including UVIE (Austria); KU Leuven, CSL, IMEC (Belgium); CEA, LAM (France); MPIA (Germany); INAF-IFSI/OAA/OAP/OAT, LENS, SISSA (Italy); IAC (Spain). This development has been supported by the funding agencies BMVIT (Austria), ESA-PRODEX (Belgium), CEA/CNES (France), DLR (Germany), ASI/INAF (Italy), and CICYT/MCYT (Spain).References
- Abel et al. (2005) Abel, N. P., Ferland, G. J., Shaw, G., & van Hoof, P. A. M. 2005, ApJS, 161, 65
- Dale & Helou (2002) Dale, D. A. & Helou, G. 2002, ApJ, 576, 159
- Ferland et al. (1998) Ferland, G. J., Korista, K. T., Verner, D. A., et al. 1998, PASP, 110, 761
- Helou et al. (1988) Helou, G., Khan, I. R., Malek, L., & Boehmer, L. 1988, ApJS, 68, 151
- Hunter et al. (2001) Hunter, D. A., Kaufman, M., Hollenbach, D. J., et al. 2001, ApJ, 553, 121
- Kaufman et al. (1999) Kaufman, M. J., Wolfire, M. G., Hollenbach, D. J., & Luhman, M. L. 1999, ApJ, 527, 795
- Kobulnicky & Skillman (1996) Kobulnicky, H. A. & Skillman, E. D. 1996, ApJ, 471, 211
- Madden (2000) Madden, S. C. 2000, New Astronomy Review, 44, 249
- Madden et al. (1997) Madden, S. C., Poglitsch, A., Geis, N., Stacey, G. J., & Townes, C. H. 1997, ApJ, 483, 200
- Maíz-Apellániz et al. (2002) Maíz-Apellániz, J., Cieza, L., & MacKenty, J. W. 2002, AJ, 123, 1307
- Malhotra et al. (2001) Malhotra, S., Kaufman, M. J., Hollenbach, D., et al. 2001, ApJ, 561, 766
- Negishi et al. (2001) Negishi, T., Onaka, T., Chan, K., & Roellig, T. L. 2001, A&A, 375, 566
- Okada et al. (2009) Okada, Y., Kawada, M., Murakami, N., et al. 2009, ArXiv e-prints 0911.3409
- Pilbratt et al. (2010) Pilbratt, G. et al. 2010, A&A, this volume
- Poglitsch et al. (1995) Poglitsch, A., Krabbe, A., Madden, S. C., et al. 1995, ApJ, 454, 293
- Poglitsch et al. (2010) Poglitsch, A. et al. 2010, A&A, this volume
- Röllig et al. (2006) Röllig, M., Ossenkopf, V., Jeyakumar, S., Stutzki, J., & Sternberg, A. 2006, A&A, 451, 917
- Rubin et al. (2009) Rubin, D., Hony, S., Madden, S. C., et al. 2009, A&A, 494, 647
- Stacey et al. (1991) Stacey, G. J., Geis, N., Genzel, R., et al. 1991, ApJ, 373, 423
- Tielens & Hollenbach (1985) Tielens, A. G. G. M. & Hollenbach, D. 1985, ApJ, 291, 722
- Úbeda et al. (2007) Úbeda, L., Maíz-Apellániz, J., & MacKenty, J. W. 2007, AJ, 133, 917
- Walter et al. (2001) Walter, F., Taylor, C. L., Hüttemeister, S., Scoville, N., & McIntyre, V. 2001, AJ, 121, 727
- Wolfire et al. (1990) Wolfire, M. G., Tielens, A. G. G. M., & Hollenbach, D. 1990, ApJ, 358, 116