Dust–temperature of an isolated star-forming cloud:
Herschel observations of the Bok globule
CB244††thanks: Herschel is an ESA space observatory with science
instruments provided by European-led Principal Investigator
consortia and with important participation from NASA.
We present Herschel observations of the isolated, low–mass star–forming Bok globule CB244. It contains two cold sources, a low–mass Class 0 protostar and a starless core, which is likely to be prestellar in nature, separated by 90 ( AU). The Herschel data sample the peak of the Planck spectrum for these sources, and are therefore ideal for dust–temperature and column density modeling. With these data and a near-IR extinction map, the MIPS 70 m mosaic, the SCUBA 850 m map, and the IRAM 1.3 mm map, we model the dust–temperature and column density of CB 244 and present the first measured dust–temperature map of an entire star–forming molecular cloud. We find that the column–averaged dust–temperature near the protostar is K, while for the starless core it is K, and that the effect of external heating causes the cloud dust–temperature to rise to K where the hydrogen column density drops below cm-2. The total hydrogen mass of CB 244 (assuming a distance of 200 pc) is . The mass of the protostellar core is and the mass of the starless core is , indicating that 45% of the mass in the globule is participating in the star–formation process.
Key Words.:
globules – ISM: individual (CB244) – infrared: ISM – (ISM:) dust, extinction1 Introduction
Bok globules are nearby, small, relatively isolated molecular clouds undergoing low–mass star–formation (e.g., Clemens & Barvainis 1988; Launhardt & Henning 1997). They tend to have only one or two star–forming cores that are embedded in a larger common cloud. These relatively simple characteristics make these objects ideal for studying the detailed processes taking place in low-mass star formation. Specifically, the temperature and density structure are fundamental physical parameters necessary to understand core fragmentation, collapse, and chemical evolution (e.g., Ward-Thompson et al. 2007; Stutz et al. 2008, 2009; Launhardt et al. 2010). The Herschel (Pilbratt et al. 2010) data cover the wavelength range which samples the peak of the Planck spectrum for cold sources (6 - 20 K). This wavelength regime is critical for accurate modeling of the temperature and density structure in the cold environments where stars are born (e.g., Shetty et al. 2009).
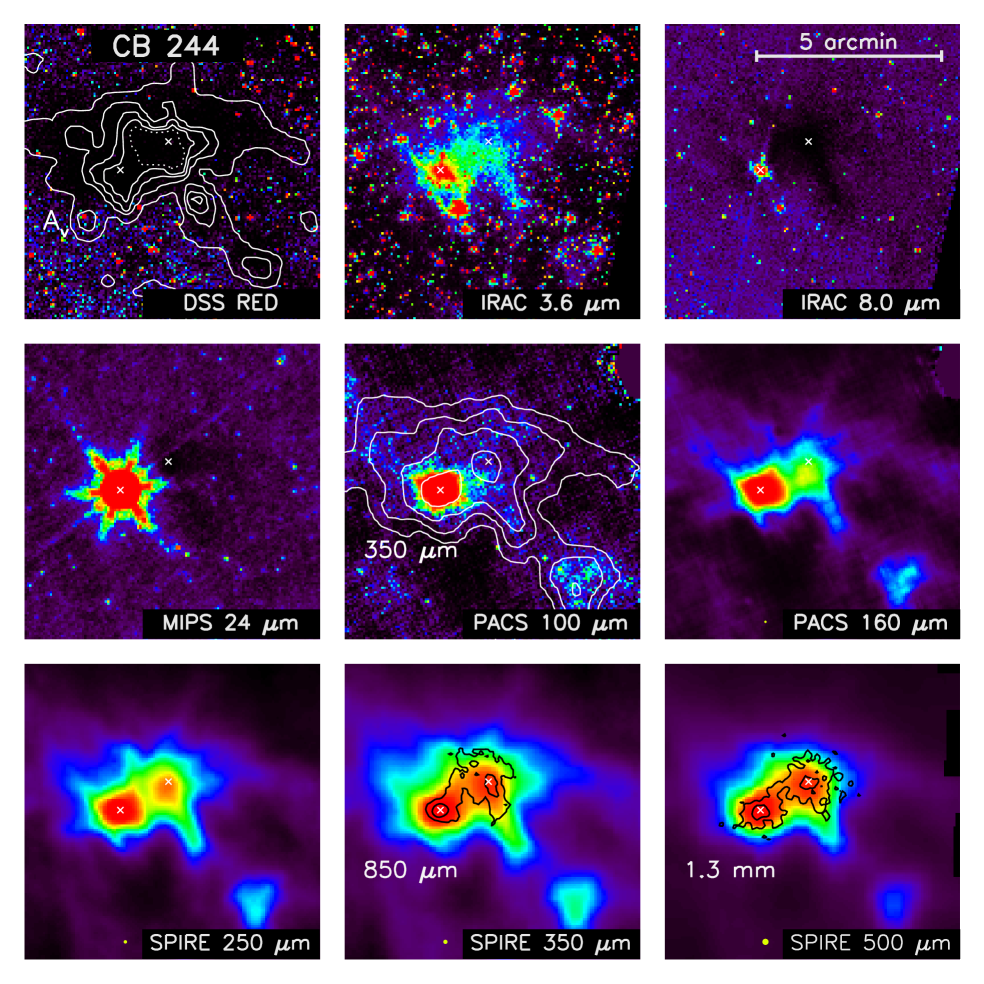
The Herschel Guaranteed Time Key Program “Earliest Phases of Star–formation” (EPoS; P.I. O. Krause) sample consists of the Photodetector Array Camera and Spectrometer (PACS; Poglitsch et al. 2010) and the Spectral and Photometric Imaging Receiver (SPIRE; Griffin et al. 2010) imaging–mode observations of sites of both high– and low–mass star formation. The low–mass Science Demonstration Phase portion of the sample is the focus of this contribution. The source CB 244 (L1262; Lynds 1962) is a Bok globule at a distance of pc (Hilton & Lahulla 1995), with an approximate extent of , or about 0.5 pc. The CB 244 globule contains two submm peaks, one associated with a Class 0 protostar located at R.A. = , Decl. = , and one associated with a starless core located at R.A. = , Decl. = . The protostar drives a molecular outflow (e.g., Clemens et al. 1991), while the detection of the CB 244 starless core was first published as an additional source inside the globule by Launhardt (1996) and Shirley et al. (2000) and produces both an 8 m (Tobin et al. 2010) and a 24 m shadow. The YSO and starless core are separated by , and are therefore well resolved throughout the PACS and SPIRE bands. We use Herschel imaging to construct spatially resolved spectral energy distributions (SEDs) of the entire cloud that cover both sides of the peak of the SED. These data allow us to reconstruct the dust–temperature map and column density distribution of the Bok globule and hence the density profiles and mass distribution with unprecedented accuracy. They also reveal the role of external heating and shielding by the envelopes in the energy balance of such cores in isolated globules.
2 Observations and data processing
2.1 Herschel observations
The source CB 244 was observed with the PACS instrument on board the Herschel Space Observatory on 2009, December 30, during the Science Demonstration Program. The globule CB 244 was observed at 100 m and 160 m. We obtained two orthogonal scan maps with scan leg lengths of 9 using a scan speed of 20/s. The scan leg position angles guarantee an almost homogeneous coverage of CB 244. We produced highpass–filtered intensity maps from these data using the HIPE software package (Ott 2010), version 3.0, build 455. Besides the standard steps leading to level–1 calibrated data, a second–level deglitching as well as a correction for offsets in the detector sub–matrices were performed. Finally, the data were highpass–filtered, using a median window with a width of 271 data samples to remove the effects of bolometer temperature drifts during the course of the data acquisition. Furthermore, we masked emission structures, in this case both the YSO and starless core regions, before computing the running median. Masking bright sources minimizes over–subtraction of source emission in the highpass filtering step. Finally, the data were projected onto a coordinate grid using the photProject routine inside HIPE. As a last step, the flux correction factors provided by the PACS ICC team were applied. We note that these data have relatively flat background values, indicating that the highpass reduction used in conjunction with the masking is a relatively robust scheme for avoiding artifacts and recovering extended emission in the PACS maps. In addition to these processing steps, we checked the pointing in the PACS 100 m map against the MIPS 24 m mosaic of the same region. Using point–sources detected in both images, we found a pointing offset of in the 100 m map relative to the 24 m mosaic. Because the 160 m PACS map contains no point–sources and was acquired at the same time as the 100 m data, we blindly applied the same pointing correction. The final PACS 100 and 160 m images are shown in Fig. 1.
Maps at 250, 350, and 500 m were obtained with SPIRE on October 20, 2009. Two 9 scan legs were used to cover the source. Two repetitions resulted in 146 s of scanning time with the nominal speed of 30′′/s. The data were processed within HIPE with the standard photometer script up to level 1. During baseline removal, we masked out the high–emission area in the center of the field. For these data no cross-scan was obtained; therefore, the resulting maps still showed residual stripes along the scan direction. We used the Bendo et al. (2010) de–stripping scheme to mitigate this effect. In addition, we checked the pointing in the SPIRE data by cross–correlating the images with the PACS 160 m image; we found that the pointing offsets for all three wavelengths are on order of 2 or smaller, and therefore we did not correct for this. The SPIRE 250, 350, and 500 m images are shown in Fig. 1.
2.2 Other data
Near-IR data: We observed CB 244 in the near-IR and
bands using Omega2000 at the Calar Alto Observatory. The field–of–view provided complete coverage of the
globule. A standard near–IR data reduction scheme was adopted. The
extracted photometric data where calibrated using the Two Micron All
Sky Survey (2MASS; Skrutskie et al. 2006). Following the NICE method
(Lada et al. 1994), the observed colors of stars were then
related to visual extinction by , assuming the Rieke & Lebofsky (1985) extinction law, where
is the mean intrinsic color of the stars
determined from edges of the field. The values for each star
were used to create an extinction map. The resulting extinction map
probes extinction values up to mag, with a
error of about 3 mag at mag.
Spitzer data: The Spitzer observations presented
here are from two programs: the MIPS observations are from program 53
(P.I. G. Rieke), while the IRAC observations are from program 58
(P.I. C. Lawrence). The MIPS observations were reduced using the
Data Analysis Tool (DAT; Gordon et al. 2005) according to steps
outlined in Stutz et al. (2007). The IRAC frames were processed using the
IRAC Pipeline v14.0, and mosaics were created from the basic
calibrated data (BCD) frames using a custom IDL program
(see Gutermuth et al. 2008).
(Sub)mm continuum data: The SCUBA 850 m and the
IRAM 1.3 mm maps are presented in Launhardt et al. (2010). The
850 m and 1.3 mm maps cover both sources, but do not extend
very far into the envelope. The maps have native beam sizes of
14.9 (850 m), and 10.9 (1.3 mm). For further
details see Launhardt et al. (2010). In Fig. 1 we show the
850 m and 1.3 mm emission as contours.
3 Dust temperature and column density modeling
We used the PACS 100 and 160 m, SPIRE 250, 350, and 500 m data in conjunction with the NIR extinction map, MIPS 70 m, SCUBA 850 m, and IRAM 1.3 mm dust emission maps to model the line–of–sight–averaged temperature and column density of CB 244. The calibrated maps were all homogeneously convolved to the largest FWHM beam size–of the data set, the SPIRE 500 m 37 beam, assuming Gaussian beam profiles, and projected onto a common 8 grid. This approach has the drawback that all spatial structures smaller than this beam size are smoothed, but ensures that the fluxes at all wavelengths in a given image pixel are derived from the same area in the source. We corrected the filtering of large spatial–scale emission in the PACS data using the Schlegel et al. (1998) 100 m IRAS maps and the ISO Serendipity Survey observations at 170 m: we added a zero level of emission of 0.3 and 0.8 mJy/ to the 100 and 160 m maps, respectively.
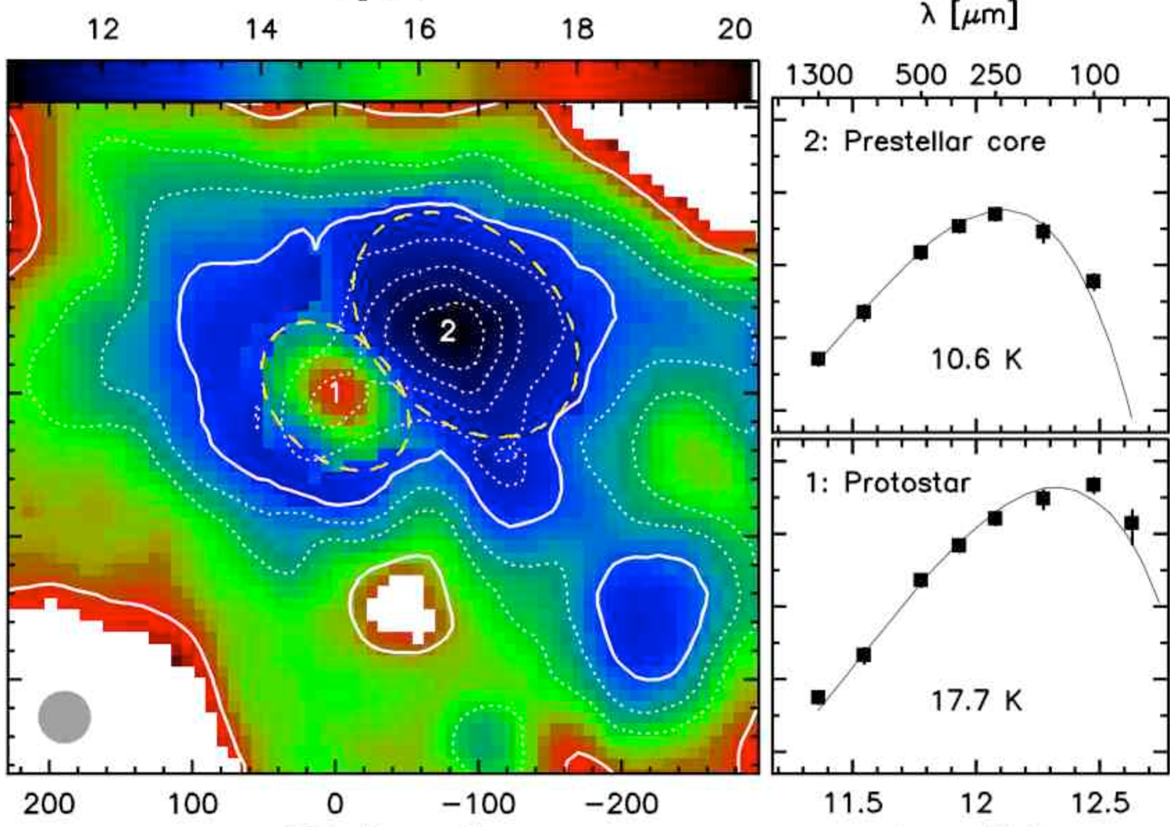
For each image pixel, an SED was extracted and fitted with a single–temperature modified black–body of the form , where is the solid angle of the emitting element, is the Planck function, is the dust–temperature, and is the optical depth at frequency . In a first iteration, we used a simple dust opacity model of the form to fit for , using minimization. We found that – fited the data best over the entire cloud. Note that compact structures were smoothed out; therefore this cannot be taken as evidence against grain growth in the centers of the two dense cores. In a second step, we then fixed the dust model to the Ossenkopf & Henning (1994) model for an MRN grain size distribution, with thin ice mantles and no coagulation, which has a cm2 g-1. The hydrogen–to–dust mass ratio was fixed to the canonical value of 110 (e.g., sodroski97). We then searched for the optimum and hydrogen column density values (the two free parameters) by calculating flux densities and values and then comparing to the emission and extinction observations, using minimization. The resulting line–of–sight–averaged dust–temperature and column density maps are shown in Fig. 2, together with the SED fits at the central positions of the two submillimeter peaks. We found the best–fit column–averaged dust–temperatures for the protostar and prestellar core of K and K, respectively. Despite the fact that each individual image pixel was fitted independently and the maps at different wavelengths have different outer boundaries, both the temperature and the column density maps have very little noise and are very smooth, demonstrating the robustness of our fitting approach. Furthermore, we evaluated the effect of a possible filtered–out extended emission component in the chopped 850 m and 1.3 mm maps. Adding in offsets of 60 mJy/15″ beam at 850 m and 12 mJy/11″ beam at 1.3 mm, corresponding to 20% of the peak surface brightness of the cold prestellar core, did not affect the fitted temperature and column density (less than a 2% change) for the prestellar core or the protostar. Hence, we conclude that possible missing extended emission in the (sub)mm maps does not affect our results.
4 Summary and conclusions
As shown in Fig. 2, the line–of–sight–averaged dust–temperature decreases constantly without any significant jump from K at the outer boundary of the cloud, where drops below cm-2 and mag, to K in the inner cloud at — cm-2 and – mag. Note that due to the two major drawbacks of our simplified approach, beam–smoothing and line–of–sight–averaging, the local dust–temperatures at the source centers will be higher in the protostar and lower in the prestellar core. Nevertheless, the boundaries of the two sources can be derived from the dust–temperature map rather than from the smooth column density map. We find that K marks the mean inner dust–temperature of the globule, from where the temperature towards the protostar rises steeply and that of the prestellar core decreases. We therefore adopt ellipses that follow the 13 K contour in the dust–temperature map as boundaries for the two sources (see Fig. 2). The mean radii of these ellipses are 50″ (10,000 AU) for the protostellar core and 76″ (15,000 AU) for the prestellar core. Integration of the column density map within these boundaries yields M⊙ for the protostellar core and M⊙ for the prestellar core, where the uncertainties are derived from an assumed K uncertainty in the dust–temperature. The total mass of the globule (within the cm-2 contour) is M⊙. We note that . These masses imply that 45% of the mass of the globule is participating in the star–formation process.
Including the new Herschel data, we derive the following parameters for the protostar: L , Lsubmm/L%, T K, and Menv/L /, (cf. Launhardt et al. 2010), confirming the Class 0 classification according to Chen et al. (1995) and Andre et al. (2000). Furthermore, the C18O (2–1) FWHM line width for the prestellar core is km s-1 (Stutz et al., in prep.); using our fitted prestellar core mass and temperature, we find that the ratio of gravitational energy to thermal and turbulent energy is Egrav / (Etherm E, a marginally sub–critical value which is expected for prestellar cores. For comparison, Tobin et al. (2010) derive a mass of 3 – 4 for the prestellar core (integrated over a similar area and scaled to a distance of 200 pc) using the 8 m shadow (see Fig. 1), a good agreement given the uncertainties in both mass derivation methods. The prominent and extended 3.6 m coreshine (see Fig. 1), originating from dust–grain scattering of the background radiation field, is an indication of grain growth (Steinacker et al. 2010) in the CB 244 cloud. These pieces of evidence together indicate that the CB 244 globule, and other globules like it, are excellent sources in which to study the earliest phases of low–mass star–formation. As a next step and in a follow–up paper, we will employ 3D–modeling to overcome the effects of line–of–sight averaging and beam-smoothing, and to reconstruct the full dust–temperature and density structure of CB 244 and the other sources in our sample. Measuring reliable temperatures and column densities with the Herschel data in a sample of prestellar and protostellar cores is a fundamental step towards revealing the initial conditions of low–mass star–formation.
Acknowledgements.
The authors thank J. Tobin for helpful discussions and D. Johnstone for a critical and helpful referee report. PACS has been developed by a consortium of institutes led by MPE (Germany) and including UVIE (Austria); KU Leuven, CSL, IMEC (Belgium); CEA, LAM (France); MPIA (Germany); INAF- IFSI/OAA/OAP/OAT, LENS, SISSA (Italy); IAC (Spain). This development has been supported by the funding agencies BMVIT (Austria), ESA-PRODEX (Belgium), CEA/CNES (France), DLR (Germany), ASI/INAF (Italy), and CICYT/MCYT (Spain). SPIRE has been developed by a consortium of institutes led by Cardiff University (UK) and including Univ. Lethbridge (Canada); NAOC (China); CEA, LAM (France); IFSI, Univ. Padua (Italy); IAC (Spain); Stockholm Observatory (Sweden); Imperial College London, RAL, UCL-MSSL, UKATC, Univ. Sussex (UK); and Caltech, JPL, NHSC, Univ. Colorado (USA). This development has been supported by national funding agencies: CSA (Canada); NAOC (China); CEA, CNES, CNRS (France); ASI (Italy); MCINN (Spain); Stockholm Observatory (Sweden); STFC (UK); and NASA (USA).References
- Andre et al. (2000) Andre, P., Ward-Thompson, D., & Barsony, M. 2000, Protostars and Planets IV, 59
- Bendo et al. (2010) Bendo, G. J. et al. 2010, A&A, this volume
- Chen et al. (1995) Chen, H., Myers, P. C., Ladd, E. F., & Wood, D. O. S. 1995, ApJ, 445, 377
- Clemens & Barvainis (1988) Clemens, D. P. & Barvainis, R. 1988, ApJS, 68, 257
- Clemens et al. (1991) Clemens, D. P., Yun, J. L., & Heyer, M. H. 1991, ApJS, 75, 877
- Gordon et al. (2005) Gordon, K. D. et al. 2005, PASP, 117, 503
- Griffin et al. (2010) Griffin, M. J. et al. 2010, A&A, this volume
- Gutermuth et al. (2008) Gutermuth, R. A., Myers, P. C., Megeath, S. T., et al. 2008, ApJ, 674, 336
- Hilton & Lahulla (1995) Hilton, J. & Lahulla, J. F. 1995, A&AS, 113, 325
- Lada et al. (1994) Lada, C. J., Lada, E. A., Clemens, D. P., & Bally, J. 1994, ApJ, 429, 694
- Launhardt (1996) Launhardt, R. 1996, PhD thesis, PhD Thesis, University of Jena, (1996)
- Launhardt & Henning (1997) Launhardt, R. & Henning, T. 1997, A&A, 326, 329
- Launhardt et al. (2010) Launhardt, R. L. et al. 2010, submitted to ApJ
- Lynds (1962) Lynds, B. T. 1962, ApJS, 7, 1
- Ossenkopf & Henning (1994) Ossenkopf, V. & Henning, T. 1994, A&A, 291, 943
- Ott (2010) Ott, S. 2010, in ASP Conference Series, Vol. 00, Astronomical Data Analysis Software and Systems XIX, 00
- Pilbratt et al. (2010) Pilbratt, G. L. et al. 2010, A&A, this volume
- Poglitsch et al. (2010) Poglitsch, A. et al. 2010, A&A, this volume
- Rieke & Lebofsky (1985) Rieke, G. H. & Lebofsky, M. J. 1985, ApJ, 288, 618
- Schlegel et al. (1998) Schlegel, D. J., Finkbeiner, D. P., & Davis, M. 1998, ApJ, 500, 525
- Shetty et al. (2009) Shetty, R., Kauffmann, J., Schnee, S., Goodman, A. A., & Ercolano, B. 2009, ApJ, 696, 2234
- Shirley et al. (2000) Shirley, Y. L., Evans, II, N. J., Rawlings, J. M. C., & Gregersen, E. M. 2000, ApJS, 131, 249
- Skrutskie et al. (2006) Skrutskie, M. F., Cutri, R. M., Stiening, R., et al. 2006, AJ, 131, 1163
- Steinacker et al. (2010) Steinacker, J., Pagani, L., Bacmann, A., & Guieu, S. 2010, A&A, 511, A9+
- Stutz et al. (2009) Stutz, A. M., Rieke, G. H., Bieging, J. H., et al. 2009, ApJ, 707, 137
- Stutz et al. (2007) Stutz, A. M. et al. 2007, ApJ, 665, 466
- Stutz et al. (2008) Stutz, A. M. et al. 2008, ApJ, 687, 389
- Tobin et al. (2010) Tobin, J. J., Hartmann, L., Looney, L. W., & Chiang, H. 2010, ApJ, 712, 1010
- Ward-Thompson et al. (2007) Ward-Thompson, D., André, P., Crutcher, R., et al. 2007, Protostars and Planets V, 33