Herschel-ATLAS: blazars in the SDP field††thanks: Herschel is an ESA space observatory with science instruments provided by European-led Principal Investigator consortia and with important participation from NASA.
To investigate the poorly constrained sub-mm counts and spectral properties of blazars we searched for these in the Herschel-ATLAS (H-ATLAS) science demostration phase (SDP) survey catalog. We cross-matched 500m sources brighter than 50 mJy with the FIRST radio catalogue. We found two blazars, both previously known. Our study is among the first blind blazar searches at sub-mm wavelengths, i.e., in the spectral regime where little is still known about the blazar SEDs, but where the synchrotron peak of the most luminous blazars is expected to occur. Our early results are consistent with educated extrapolations of lower frequency counts and question indications of substantial spectral curvature downwards and of spectral upturns at mm wavelengths. One of the two blazars is identified with a Fermi/LAT -ray source and a WMAP source. The physical parameters of the two blazars are briefly discussed. These observations demonstrate that the H-ATLAS survey will provide key information about the physics of blazars and their contribution to sub-mm counts.
Key Words.:
BL Lacertae objects: general – quasars: general – Submillimeter| H-ATLAS | |||||||
| name | arcsec | mJy | mJy | mJy | mJy | mJy | mJy |
| J090910.1+012135a | 0.3 | 571.7 | 137.3 | ||||
| J090940.3+015957b | 10.3 | 317.5 | |||||
| a [HB89] 0906+015, bPKS 0907+022 | |||||||
1 Introduction
Blazars, comprising BL Lac objects and flat-spectrum radio quasars, are a class of active galactic nuclei characterized by remarkable properties: high luminosities at the two extreme ends of the electromagnetic spectrum (i.e., in the radio and -ray bands), rapid variability, apparent superluminal jet speeds, flat or inverted radio spectrum, and high polarization in the optical waveband. They are interpreted in terms of relativistic effects due to jets propagating at velocities close to the speed of light almost along the line-of-sight. Their spectral energy distribution (SED) can be accounted for as a combination of synchrotron emission, peaking at a frequency that varies from Hz to Hz (Nieppola et al. 2006), and inverse Compton scattering, assumed to be responsible for the -ray peak.
Padovani & Giommi (1995) classified BL Lac objects into 3 subclasses (low, intermediate, and high frequency synchrotron peaked BL Lacs) depending on the value of . Abdo et al. (2009) extended the classification to all blazars, subdivided into low (LSP; Hz), intermediate (ISP; Hz), and high (HSP; Hz) synchrotron peaked blazars. For many years, the blazar selection has relied mostly on either radio or X-ray surveys. Radio surveys preferentially select LSPs, while X-ray surveys favor the HSPs. The resulting global distribution of is thus bimodal, although objects peaking at intermediate frequencies have also been found. The high sensitivity and nearly uniform sky coverage of the Fermi Gamma-ray Space Telescope made it a powerful tool for providing large blazar samples (Abdo et al. 2010).
In the present paper, we report on the blazars selected at sub-mm wavelengths in the Herschel-ATLAS (H-ATLAS; Eales et al. 2010) science demonstration phase (SDP) field. The Herschel data cover the poorly explored frequency range close to the synchrotron peak of the most luminous LSPs (Fossati et al. 1998; Padovani et al. 2006); carries crucial information about key physical parameters, such as the Lorentz factor of emitting electrons, the Doppler factor , and the magnetic field strength ().
Evolutionary models (De Zotti et al. 2005) predict brighter than mJy at m, the approximate detection limit of the H-ATLAS survey (Rigby et al. 2010, in preparation), so that the full survey may be expected to yield a sample of blazars selected, for the first time, at sub-mm wavelengths. This prediction assumes a flat radio spectral index (; ) followed by a parabolic decline close to and above a synchrotron peak frequency that increases with decreasing radio luminosity (Fossati et al. 2008). However, spectral measurements have provided evidence of a substantial spectral curvature downwards from cm to mm wavelengths (Waldram et al. 2007; Sadler et al. 2008). Vieira et al. (2009) find that their highest significance 150 GHz selected radio sources are consistent with flat spectral behavior (or ) between 5 GHz and 150 GHz but a possible steepening between 150 and 220 GHz. Voss et al. (2006) reported an excess (based however on the detection of only three blazars) above extrapolations from lower frequency counts of the surface density at mJy at 1.2 mm, suggesting that at least a fraction of blazars have inverted (i.e. rising with frequency) spectra at mm wavelengths, perhaps due to variability. The H-ATLAS data will also shed light on this issue.
2 Blazar candidates
Observations were performed with the ESA Herschel Space Observatory (Pilbratt et al. 2010). The H-ATLAS SDP field, centered on (, ), was observed with the Spectral and Photometric Imaging Receiver (SPIRE; Griffin et al. 2010) at 250, 350, and m and with the Photodetector Array Camera and Spectrometer (PACS; Poglitsch et al. 2010) at 100 and m. Details of the SPIRE and PACS mapmaking are given by Pascale et al. (2010, in preparation) and Ibar et al. (2010, in preparation), respectively. Sources were extracted from the m map (see Rigby et al. 2010, in preparation). For each source, 350 and m flux densities were estimated by extracting flux from the appropriate noise-weighted beam-convolved map at the source position determined in the m map. Fluxes at 100 and m were then assigned by matching to PACS sources within a positional tolerance of .
The selection of blazar candidates among H-ATLAS sources brighter than 50 mJy was made by identifying FIRST counterparts within a search radius of , the of a Gaussian model of the 500m beam. The probability that a true counterpart has an apparent positional offset is
| (1) |
where is the global positional uncertainty, taking into account both H-ATLAS and FIRST positional errors. Sources detected with signal-to-noise ratio (S/N) greater than 10 at m, such as the blazar [HB89] 0906+015 (J090910.1+012135; see Table 1), have a . For PKS 0907+022 (J090940.3+015957), which has data of lower S/N at m, is . The FIRST positions are accurate to better than 1 arcsec at the survey limit and to better than 0.5 arcsec for sources brighter than 5 mJy at 1.4 GHz (White et al. 1997). With our choice of the search radius, the probabilities of having missed true associations at separations are and , respectively, for the two values of and . We note that the two values of are representative of sources with data of high and low S/N at m.
Since the distribution of FIRST sources is to a large degree uniform, the probability that one of them lies by chance within the angular radius from a given Herschel source is
| (2) |
where is the flux of the sources we match to. The FIRST catalog is complete down to mJy/beam. The corresponding surface density is , implying that the maximum probability of a chance association within 15 arcsec is . Since there are 185 sources with mJy in the H-ATLAS SD field, the expected number of chance associations is . Simulations made by offsetting the radio positions at random and re-running the cross-matching yielded (68% confidence errors), consistent with expectations for Poisson statistics.
The cross-matching yielded 19 matches. Of them, 10 have far-IR/sub-mm colours typical of low- dusty galaxies. The far-IR/sub-mm SEDs of 4 others are consistent with those of dusty galaxies at –2 and their radio emission obeys the radio-FIR correlation (Yun et al. 2001). The other three sources are more than ( being the combined rms positional uncertainty) away from their nearest FIRST source, and are therefore very unlikely associations. We note that having 3 spurious associations within our search radius is fully consistent with the results of our simulations. All of these 17 sources were discarded. We note that we aim to select only sources with non-thermal emission brighter than 50 mJy at m, so we are not interested here in the weaker blazar nuclei that may be hiding in dusty galaxies. The FIRST and Herschel photometric data for the 2 remaining sources are shown in Table 1.
Both H-ATLAS J090910.1+012135 ([HB89] 0906+015) and H-ATLAS J090940.3+015957 (PKS 0907+022) are known blazars. The former is a flat-spectrum quasar with strong broad emission lines at a measured redshift of 1.018 (Falomo et al. 1994). The latter is a BL Lac with an estimated photometric redshift of 1.575 (Richard et al. 2004); a Keck spectrum obtained by E. Barton and J. Cooke does not show any clearly identifiable line. The surface densities of 1.4 GHz sources brighter than these sources are and , respectively. According to Eq. (2), the probability that they fall by chance within their angular distance, , from the H-ATLAS source is and , respectively, while, after Eq. (1), the probability that the true counterparts to the H-ATLAS sources have an apparent angular separation as large as the measured one, or larger, is 99% and 12%, respectively.
| Flux (mJy) | [HB89] 0906+015 | PKS 0907+022 |
|---|---|---|
| 941 | 144 | |
| 0.22 | ||
| 0.24 | ||
| 0.34 | ||
| 0.54 | ||
| – | ||
| – | ||
| – | ||
| – | ||
| – | ||
| Name | [HB89]0906+015 | PKS0907+022 |
|---|---|---|
| [Hz] | 12.6 | 13.3 |
| -11.5 | -12.0 | |
| [Hz] | 20.9 | – |
| -10.3 | – |
3 Spectral energy distributions of [HB89] 0906+015 and PKS 0907+022
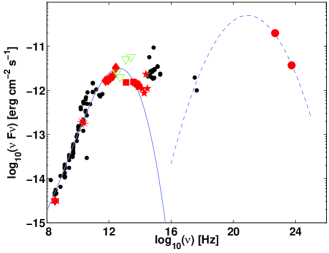
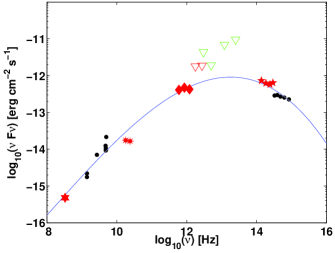
The photometric data for the two previously known blazars are shown in Figs. 1 and 2. To the data available from NED, we added the H-ATLAS fluxes, the UKIDSS data (Lawrence et al. 2007), new ATCA measurements around 20 GHz, new GMRT measurements at 332 MHz (Jarvis et al., in preparation), new Spitzer data (Jarvis et al., in preparation) for [HB89] 0906+015 along with upper limits that we obtained from IRAS maps (see Table 2). The ATCA measurements were performed by M. Massardi and L. Bonavera, in the framework of the Planck-ATCA Coeval Observation (PACO) project.
The blazar [HB89] 0906+015 was detected by the WMAP satellite (source 215 in the NEWPS5yr catalog; Massardi et al. 2009) and also by the Fermi/Large Area Telescope (LAT) (Abdo et al. 2010; note that in the previous bright gamma-Ray source list the -ray source was identified with PKS 0907+022). The shape of its SED exhibits the typical double hump distribution, attributable to synchrotron and inverse Compton, respectively.
To determine the SEDs, we followed the approach of Abdo et al. (2009). First we fitted the part of the SEDs dominated by the synchrotron emission using a third degree polynomial. From these fits, we obtained an estimate of the synchrotron peak energy, , and peak intensity, . Since [HB89] 0906+015 has strong broad emission lines, its optical-UV flux is most likely dominated by the thermal emission produced by the accretion disk, with only a minor contribution from the beamed non-thermal continuum (Ghisellini et al. 2010b). There are indeed clear indications of an optical-UV bump. To avoid biasing estimates of the synchrotron peak frequency and intensity, we excluded these data from the fit. Abdo et al. (2009) demonstrated that the peak of the inverse Compton SED component, , is strongly correlated with the -ray photon index (). We used their best fit – relationship (their Eq. (5)) to estimate for the HB89 blazar (=2.74). Finally we obtained the peak intensity by fitting the X-ray to -ray data points with a parabola peaking at in the – plane.
The SED parameters are summarized in Table 3. For PKS 0907+022, since no X-ray nor -ray measurements are available, we could only use the data fitting method for the synchrotron peak. In both cases, the available data from different instruments are non-simultaneous. As for all blazars, they may therefore by affected by variability, which causes additional uncertainty in the derived spectral parameters. This adds to the uncertainties in estimates of spectral parameters. Based on the best-fit model values of , both blazars can be classified as LSPs; however, an ISP classification cannot be ruled out.
4 Conclusions
The Herschel detection of two blazars in the SDP area is interesting in a number of ways. First of all, it confirms that the H-ATLAS survey can play an important role in determining properties of blazars in a crucially important spectral region. With an area of , the full H-ATLAS should yield a sample of blazars, the first statistically significant sample selected at sub-mm wavelengths. The large area is of crucial importance in this context, because the blazar counts are expected to be relatively flat. The H-ATLAS survey will extend by about one order of magnitude downwards in flux the blazar number counts from the Planck survey, which is predicted to have a (95% reliability) detection limit of 430 mJy at 545 GHz (Leach et al. 2008).
The number of detected blazars is consistent with the predictions of the De Zotti et al. (2005) model which yields brighter than mJy at m, i.e., 2.4 objects in the 16 SDP area. An observational estimate of the blazar surface density at 5 GHz was obtained by Padovani et al. (2007; see their Figs. 4 and 6). Taking into account the steepening at frequencies approaching the synchrotron peak, the effective 5 GHz to m spectral index yielded by the model is . The m flux limit of 50 mJy then corresponds to 130 mJy at 5 GHz; our results are then in very good agreement with the corresponding blazar surface density found by Padovani et al. (2007) and the relatively flat spectral index assumed by the de Zotti et al. model. If this result is confirmed by data of the full H-ATLAS blazar sample, future models will need to explain in addition evidence of a substantial spectral curvature downwards from cm to mm wavelengths (Waldram et al. 2007; Sadler et al. 2008).
The blazar catalog of Massaro et al. (2009) lists three more blazars in the SDP field: PKS0858-004 with mJy, 1RXS J085920.6+0047 with mJy, and 1RXS J085749.8+0135 with mJy. None of them has a plausible counterpart among the H-ATLAS sources. In the case of PKS0858-004, this implies that the effective 1.4 GHz to m spectral index has to be steeper than 0.3, i.e., steeper than the effective indices of the two detected blazars (0.13 and 0.25), but still within the range observed for these sources.
Based on the best-fit model estimate of the synchrotron peak frequency, , both [HB89] 0906+015 and PKS 0907+022 fall in the low frequency synchrotron peaked (LSP) category. This suggests that the H-ATLAS sample will set strong constraints on the abundance of blazars with low (Hz) values of , which, in the blazar sequence scenario, are those with more powerful jets, more luminous accretion disks and higher black hole masses (Ghisellini et al. 2010a).
Acknowledgements.
We are grateful to the referee, P. Padovani, for very useful comments. Thanks are due to the PACO collaboration for having made available the data on the 2 blazars. MM and LB thanks the staff at the Australia Telescope Compact Array site, Narrabri (NSW), for the valuable support they provide in running the telescope. Work partially supported by the Italian Space Agency (contract I/016/07/0 “COFIS” and ASI/INAF Agreement I/072/09/0 for the Planck LFI Activity of Phase E2). This research has made use of the NASA/IPAC Extragalactic Database (NED) which is operated by the Jet Propulsion Laboratory, California Institute of Technology, under contract with the National Aeronautics and Space Administration.References
- Abdo et al. (2009) Abdo, A. A., Ackermann, M., Ajello, M., et al. 2009, arXiv:0912.2040
- Abdo & for the Fermi-LAT Collaboration (2010) Abdo, A. A., for the Fermi-LAT Collaboration 2010, ApJ, 715, 429
- de Zotti et al. (2005) de Zotti, G., Ricci, R., Mesa, D., et al. 2005, A&A, 431, 893
- Eales et al. (2010) Eales, S., Dunne, L., Clements, D., et al. 2010, PASP, 122, 499
- Falomo, Scarpa, & Bersanelli (1994) Falomo, R., Scarpa, R., & Bersanelli, M. 1994, ApJS, 93, 125
- Fossati et al. (1998) Fossati, G., Maraschi, L., Celotti, A., Comastri, A., & Ghisellini G. 1998, MNRAS, 299, 433
- Ghisellini et al. (2010) Ghisellini, G., Dalla Ceca, R., Volonteri, M., et al. 2010a, MNRAS, 442
- Ghisellini et al. (2010) Ghisellini, G., Tavecchio, F., Foschini, L., Ghirlanda, G., Maraschi, L., & Celotti, A. 2010b, MNRAS, 402, 497
- (9) Griffin, M. et al. 2010, A&A, this volume
- Lawrence et al. (2007) Lawrence, A., Warren, S.J., Almaini, O., et al., 2007, MNRAS, 379, 1599
- Leach et al. (2008) Leach, S.M., Cardoso, J.-F., Baccigalupi, C., et al. 2008, A&A, 491, 597
- Massardi et al. (2009) Massardi, M., López-Caniego, M., González-Nuevo, J., et al. 2009, MNRAS, 392, 733
- Massaro et al. (2009) Massaro, E., Giommi, P., Leto, C., Marchegiani, P., Maselli, A., Perri, M., Piranomonte, S., & Sclavi, S. 2009, A&A, 495, 691
- Nieppola, Tornikoski, & Valtaoja (2006) Nieppola, E., Tornikoski, M., & Valtaoja E. 2006, A&A, 445, 441
- Padovani & Giommi (1995) Padovani, P., & Giommi, P. 1995, ApJ, 444,
- Padovani et al. (2006) Padovani, P., Giommi, P., Ábrahám, P., Csizmadia, S., & Moór, A. 2006, A&A, 456, 131
- Padovani et al. (2007) Padovani, P., Giommi, P., Landt, H., & Perlman, E. S. 2007, ApJ, 662, 182
- (18) Pilbratt, G. et al. 2010, A&A, this volume
- (19) Poglitsch, A. et al. 2010, A&A, this volume
- Richard et al. (2004) Richards, G. T., Nichol, R. C., Gray, A.G., et al. 2004, ApJS, 155, 257
- Sadler et al. (2008) Sadler, E. M., Ricci, R., Ekers, R. D., et al. 2008, MNRAS, 385, 1656
- Sault et al. (1995) Sault, R. J., Teuben, P. J., & Wright, M. C. H. 1995, Astronomical Data Analysis Software and Systems IV, 77, 433
- (23) Swinyard, B., et al. 2010, A&A, this volume
- Voss et al. (2006) Voss, H., Bertoldi, F., Carilli, C., et al. 2006, A&A, 448, 823
- Vieira et al. (2009) Vieira, J. D., Crawford, T. M., Switzer, E. R., et al. 2009, arXiv:0912.2338
- Waldram et al. (2007) Waldram, E. M., Bolton, R. C., Pooley, G. G., & Riley, J. M. 2007, MNRAS, 379, 1442
- White et al. (1997) White, R.L., Becker, R.H., Helfand, D.J., & Gregg, M.D., 1997, ApJ, 475, 479
- Yun et al. (2001) Yun, M.S., Reedy, N.A. & Condon, J.J., 2001, ApJ, 554, 803