The Evolution of Between z=2 and z=0
Abstract
We propose a novel method to estimate , the ratio of stellar mass () to black hole mass () at various redshifts using two recent observational results: the correlation between the bolometric luminosity of active galactic nuclei (AGN) and the star formation rate (SFR) in their host galaxies, and the correlation between SFR and in star-forming (SF) galaxies. Our analysis is based on and measurements in two large samples of type-I AGN at z1 and z2, and the measurements of in 0.05z0.2 red galaxies. We find that depends on at all redshifts. At z2, 280 and 40 for = and =, respectively. grows by a factor of 4-8 from z2 to z=0 with extreme cases that are as large as 10–20. The evolution is steeper than reported in other studies, probably because we treat only AGN in SF hosts. We caution that estimates of evolution which ignore the dependence of this ratio on can lead to erroneous conclusions.
keywords:
galaxies: active – galaxies: nuclei – galaxies: evolution – quasars: general.1 Introduction
Study of the co-evolution of Active Galactic Nuclei (AGN) and their host galaxies provides important clues about the growth of super massive black holes (SMBHs) and the star formation (SF) history of the Universe. In the local universe one finds a tight correlation between the SMBH mass () and the mass of the bulge of its host, (Marconi & Hunt, 2003; Häring & Rix 2004, hereafter HR04), or alternatively with the stellar velocity dispersion (Ferrarese & Merrit 2000; Gebhardt et al. 2000). Typically /500–1000. must have been smaller at high redshift. For example, are often observed at z=3–6 (e.g. Netzer 2003; Shemmer et al. 2004; Fan et al. 2006), yet galaxies that are 500-1000 times more massive are never observed at z0.5 and are very rare even at z0.
The evolution of the relationship has been studied in numerous papers. Examples are Shields et al. (2003) who find no evolution up to z2, and Woo et al. (2008) who suggest that has increased by a factor of 3 since z=0.6. The uncertainties in all such measurements are very large due to the difficulties in measuring or in high redshift AGN hosts. While measuring in high-redshift galaxies is difficult, the total stellar mass, is easier to obtain. This is achieved by multi-band spectral energy distribution (SED) fitting, which is used to constrain . However, obtaining for AGN hosts is severely limited by the problematic subtraction of the bright point-like continuum in type-I AGN and the estimation of in type-II AGN.
Several recent studies used deep imaging to estimate (or ) in z0.5–3 AGN by resolving the host galaxy emission and by careful PSF modelling (e.g. Kukula et al. 2001; Peng et al. 2006; Kotilainen et al. 2007; Bennert et al. 2010). The measured host luminosity was translated to by assuming a certain ratio. A common assumption is that AGN hosts are “red and dead”, with a stellar population which evolves passively from a high formation redshift, e.g. 5. A detailed study of this type, including a summary of many earlier findings, is given in Decarli et al. (2010; hereafter D10) who find that evolves following . The assumption of non-SF AGN hosts may describe some objects, but many studies find that hosts of luminous AGN often contain much younger stellar populations (e.g., Kauffmann et al. 2003; Jahnke et al. 2004; Silverman et al. 2009; Merloni et al. 2010, and references therein).
In this Letter we suggest a novel method to estimate the evolution of . Our approach makes use of the known relationships between star formation rate (SFR) and in SF galaxies (SFGs), and between the bolometric luminosity of AGN () and the SFR in their hosts. We describe these relationships in §2 and use them to estimate in SF galaxies at z0.15, z1 and z2 in §3. In §4 we discuss the implications to the co-evolution of SMBHs and their hosts. Throughout this work we assume a standard CDM cosmology with =0.7, =0.3 and =70 km s-1 Mpc-1.
2 SFR- and SFR- correlations
Our work is based on two empirical correlations. The first is the well established, redshift dependent, SF sequence (a correlation between SFR and total stellar mass, ) in SF galaxies. There are numerous papers on this issue and the following is only a partial list which is most relevant to our work. Brinchmann et al. (2004; hereafter B04) studied a large sample of low redshift SFGs in the Sloan Digital Sky Survey (SDSS). They show a clear relationship of the form . The result was later confirmed by Salim et al. (2007) who used a combination of SDSS and GALEX data. Similar relationships at higher redshifts, based on mid-IR and UV observations and multi-wavelength SED modelling, are reported in Elbaz et al. (2007; hereafter E07), Daddi et al. (2007; hereafter D07), Noeske et al. (2007), Drory & Alvarez (2008) and several other papers (see a more complete list in Dutton et al. 2009). E07 and D07 used the combined HST, Spitzer and ground-based photometry of the GOODS field. E07 studied blue () galaxies at z=0.8–1.2 and found . D07 studied BzK-selected galaxies at z1–3. For z2 they find . The scatter around both relations is 0.3-0.4 dex. Noeske et al. (2007) reports for z=0.2–0.7 AEGIS galaxies. Drory and Alvarez (2008) studied the FORS Deep field up to z4.5 and find similar trends, albeit with systematically lower SFR. Much of the differences between the various SFR- relations can be attributed to the selective inclusion of extremely low-SFR galaxies in the samples under study.
There is mounting evidence that many, perhaps most AGN hosts are actively forming stars. This relates to the issue of whether such hosts are “blue”, “red”, or “green valley” sources (e.g., Brammer et al. 2009 and references therein). This is especially important at high redshift due to the known tendency for the fraction of blue galaxies to increase with redshift (e.g. E07 and references therein). Works like Salim et al. (2007) show that low-z AGN hosts populate the more massive part of the SF sequence. These high masses, in turn, mean that the apparent “green” colours of many AGN hosts are the consequence of low specific SFR (SSFR), not a low SFR. Moreover, Brammer et al. (2009) show that many green valley galaxies belong to the blue sequence once reddening is properly taken into account. While such ideas are well supported for low redshift AGN, there is a need for more evidence at high-z. Some such data already exists, e.g. the Silvermann et al. (2009) work that claims that the SFR and in AGN hosts at z0.7-1 are indistinguishable from those of inactive SF galaxies. Given all the above, our first assumption is that the hosts of most luminous, optically-selected AGN are part of the SF sequence at all redshifts. This assumption is further justified in §3.1.
Our second assumption is that there exists a significant correlation between the bolometric luminosity of AGN () and the SFR of their hosts. This correlation is hinted at in various intermediate and high redshift studies (Netzer et al. 2007; Lutz et al. 2008) and in low redshift type-II AGNs (Netzer 2009; hereafter N09). Here we adopt an updated version of the correlation presented in N09, by excluding LINERs from the group of low-z AGN. This gives
| (1) |
This equation is not a fit to the data but rather a line that goes through the points. As discussed in N09, there is no simple way to derive a best fit function to this inhomogeneous data set.
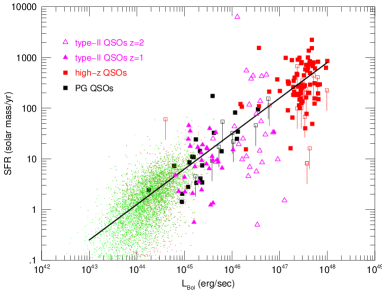
Since the above correlation is crucial for our study, we show the data used here in Fig. 1. In addition to the samples presented and discussed in N09, this version also includes two additional groups of zCOSMOS type-II AGNs at z1 and z2, kindly provided by V. Mainieri. These are X-ray selected sources where is estimated from and the SFR is based on multi-wavelength SED fitting. The two groups lie on the above relationship with a scatter in SFR of about 0.4 dex, comparable to the overall scatter. There are several reasons for this scatter. At the low- end, the scatter is related to the inaccuracies in SFR and determination as well as real scatter in these properties. At z1 and z2, the scatter reflects the uncertainty in SED modelling and the range of across the SF sequence. At the high- end, much of the scatter is due to observational uncertainties, the incompleteness of the high redshift AGN samples and, perhaps, the extreme SFR in mergers. A more complete account of these issues can be found in N09.
The following analysis relies on the combination of the above correlations for SF AGN hosts. Given , we can determine SFR (Eq. 1) and this, in turn, can be translated to given the redshift dependent SFR- correlations.
3 The redshift evolution of /
3.1 at low and high redshift
To explore , we define several samples of both AGN and non-AGN galaxies. The first is a large sample of 0.05z0.2 galaxies from the value-added MPA/JHU SDSS DR4 database. This includes photometry, , SFR and for all sources (B04). To justify the use of the - relation of Tremaine et al. (2002), we choose only red galaxies, following the colour cut of Baldry et al. (2004). The number of such sources, after applying some basic quality criteria, is 210,158. They cover the range and (the latter lower limit was chosen to filter out dubious measurements). is derived from the SDSS photometry and thus the flux limit of the sample () affects the number of low- galaxies. Here we deal mostly with the larger systems and these limitations do not affect our general conclusions.
The work involves also four AGN samples: type-I and type-II samples at 0.1z0.2, a type-I sample at z1 and a type-I sample at z2. The first two provide little new information but serve to test and to justify the general new method presented here. The 0.1z0.2 redshift range is chosen to enable proper measurements of type-I and type-II AGN (see details in N09). The type-II AGNs are “strong AGN” (Seyfert 2s - S2s but not LINERs) drawn from the local SDSS sample. for these 1152 AGN is determined by the [O i] and [O iii] method of N09. The 2814 type-I AGN are drawn directly from the SDSS/DR7 (Abazajian et al. 2009) database and are analyzed in a way similar to the one presented in Netzer & Trakhtenbrot (2007; hereafter NT07). Here is estimated from the monochromatic luminosity at 5100Å () and the FWHM of the H line. is determined from , using the bolometric correction factors of Marconi et al. (2004). To avoid selection biases, we applied a common observed flux limit for the type-I and type-II samples, such that only sources with F([O iii]) are included. Assuming a typical bolometric correction of 2500 (Netzer et al. 2006, NT07), this translates to .
We constructed the SF sequence for our type-II low redshift sample and compared it with the SF sequence presented in B04. The agreement is very good, with about 70% of the AGN hosts lying on the sequence. We also confirm earlier results (e.g. Salim et al. 2007) which suggest that AGN hosts concentrate at somewhat higher . We find that despite their apparently red colours, the majority of the red S2 hosts are actively forming stars and are situated on the SF sequence. These SF S2 hosts are, in fact, mostly green valley sources, with lower SSFR. Some 30% of the AGN are not part of the SF sequence. We suspect that the fraction of such sources at higher redshift is smaller but have no way to check it qualitatively. The remaining of the paper and the results concerning refer only to those AGN that are on the SF sequence.
Next, we translate to SFR for the 0.1z0.2 type-I AGN using Eq. 1. This is then converted to using the low redshift SF sequence of B04. Combining with the measured , we obtain for all these sources. This can be compared with measured directly for the type-II z=0.1–0.2 AGN. The overall good agreement justifies the use of a similar procedure for higher redshift AGN samples.
We selected two higher redshift type-I AGN samples from the SDSS/DR7. We chose sources in the range 0.9z1.1 and 1.8z2 (5330 and 4352 objects, respectively), which are the nominal redshift ranges of the SFG samples of E07 and D07. Full details of the sample selection, line fitting and related analysis will be given in a forthcoming publication. In short, we use a similar procedure to the one described in NT07 and in Shen et al. (2008) to measure the Mg ii emission line complex. The FWHM of the line and the adjacent continuum luminosity () are combined to estimate using the relation of McLure & Dunlop (2004). We calculate from by calibrating against in a separate sub-sample where the two continuum bands are observed in the spectrum. We then estimated the SFR by using Eq. 1. The distribution of inferred SFRs (not shown here) clearly shows that these AGN hosts are actively forming stars at rates that are comparable to the non-AGN SFGs at those redshifts. In particular, 99% of the z2 sources have SFR, the median SFR in the SF sequence of D07.
While most (not all, see earlier comments) high redshift AGN hosts are expected to lie on the SF sequence, the range in SFR and in can be very different from those found for non-AGN samples because of the differences in properties of the observed samples, in particular different flux limits. To examine this in detail, we focus on our z2 type-I AGN sample. We compare the range of derived SFR and possible range of to the same properties in the D07 sample, using data kindly provided by Emanuele Daddi. Such a comparison involves two crucial factors. First, the D07 sample includes much fainter sources. As explained above, almost all our type-I AGN occupy only the upper part of the z2 SF sequence. This is a direct consequence of the SDSS flux limit. Second, one can consider two approaches to deduce typical values of for the z1 and z2 samples, by either (1) converting each individual SFR to through the best fit SF sequence, at the appropriate redshift (i.e. E07 and D07), or (2) sampling the distribution of per given SFR (in the high-redshift SF sequences), for each deduced value of SFR. By definition, the latter will result in a considerably broader distribution of the derived , due to the wide range of properties in the observed samples. In the following analysis we only use the first approach, i.e. we derive for each z1 and z2 AGN host, by converting its (derived) SFR through the E07 and D07 relations, respectively. We note that the 0.4 dex scatter in these relations is a real uncertainty on our high-redshift results. The z2 sample covers and , while the z1 sample covers and . Clearly, the varying ranges of and in the different local and high-redshift samples prohibit a simplistic comparison of the mean . In what follows we thus preform a more careful comparison.
3.2 evolution
Standard galaxy evolution scenarios suggest that the end phase of many high redshift SF galaxies are massive, red ellipticals. Therefore, we use our data to compare the properties of the z1 and z2 AGN hosts to those of red galaxies in the local Universe. Fig. 2 shows the entire sample of 0.05z0.2 red galaxies, as a gray scale density map. The galaxies form a well-defined band in the - plane that follows the approximate relationship -0.7±0.1. Also shown is the sample of 0.1z0.2 type-II AGN that follows a similar trend.
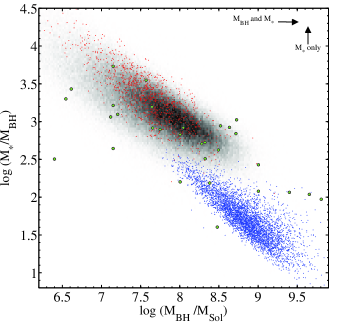
Fig. 2 also shows data for the 30 local galaxies from HR04 with dynamically measured . In this case we plot rather than . All are taken directly from HR04 except those of M 87, NGC 4649 and NGC 4697 where we used new measurements reported in Gebhardt & Thomas (2009), Shen & Gebhardt (2010) and Forestell et al. (2010). This sequence extends up to and 100 and shows a clear dependence on , similar to the red galaxies in our sample and in contradiction to to claims of a constant 500–1000. Several of the HR04 galaxies are, in fact, disk+bulge systems with relatively small bulges and the replacement of by will enlarge the plotted . Based on this fact and the large uncertainties on the estimated , we suggest that our sample of local red galaxies is consistent with the HR04 sequence. We also show in Fig. 2 and for our z2 sample. The high redshift objects form a similar sequence, shifted down by about 0.75 dex, with approximately the same slope. The z1 sequence (not shown) is situated between the two.
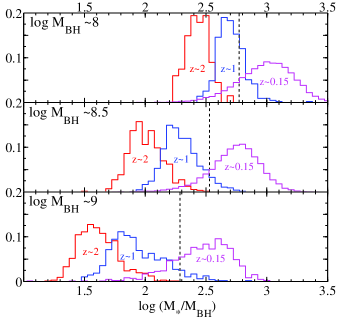
Fig. 2 provides important clues about the redshift evolution of . First, evolution must be considered for a given . The population mean of would fail to account for the fact that the way such samples are drawn is biased towards larger at higher redshifts. To demonstrate this, we show in Fig. 3 three histograms, representing three vertical cuts in Fig. 2 for 0.2 dex wide bins centred at , and . These correspond to the case of but no growth. The typical growth factors of between z=2 and z0.1 are 3.8 for =, 5.7 for =, and 7.8 for =. We also show, in dashed vertical lines, the mean in the HR04 sample for the same obtained from the best (BCES bisector) linear fit to their data. The corresponding growth factors are 2, 3.3, and 5.6, for the same values of .
4 Discussion
The analysis presented here suggests strong evolution in up to z=2, much steeper than what is suggested in other studies. In particular, our mean values of at z1 and z2 are smaller than the ones reported in D10, which is the most up-to-date compilation of such works. There are three main reasons for these differences:
-
1.
As already mentioned, most earlier works estimate by assuming a passive evolution from a high formation redshift. This is obviously an over-simplification of the evolution of most galaxies and significant epochs of SF at z4 (e.g. D07; E07; Drory & Alvarez 2008; van Dokkum et al. 2010, and references therein). Accounting for younger stellar populations would result in lower and thus lower (see D10 and Peng et al. 2006).
-
2.
The D10 sample represents the minority of the AGN population, as hinted by two biases. First, the majority of the D10 sources lie in the top 15% of the distributions corresponding to their redshift. Second, the selection criteria for the D10 HST observations could have been biased towards large, resolved galaxies with large .
-
3.
The mean in high redshift AGN samples is systematically larger than the corresponding low redshift . For example, in our large sample of red galaxies, 99% of the sources show while 20% of the z1 and 57% of the z2 AGN have larger . All the z2 sources in D10 have . Such objects should only be compared with local galaxies which host BHs that are at least as massive. As Fig. 2 shows, this corresponds to =100–200, instead of the commonly used 700.
In conclusion, while our work applies to most AGN, the D10 sample probably represents the remaining sources.
The results presented here point to a scenario where many galaxies have to increase their mass by factors of 4-8 (2-4) since z2 (z1). The growth factors for the most massive BHs are not well determined since the number of very massive galaxies in the local universe is not large enough to reliably extend the results of Fig. 2 beyond . These numbers represent the requirement for the galaxies to over-grow their SMBHs by the above factors. This seems to be consistent with models which suggest that the high mass SMBHs observed at z could have accumulated most of their mass by that redshift (Marconi et al. 2004). On the other hand, it may be in contradiction with at least some scenarios linking AGN activity to the shut-down of SF in their host galaxies (see Somerville et al. 2008; Cattaneo et al. 2009 and references therein).
While a full discussion of the various growth scenarios of is beyond the scope of this Letter, we comment briefly on some of these ideas. Major galaxy mergers would increase both and , either through starbursts and gas accretion in “wet mergers” or the possible coalescence of the two SMBHs involved in “dry mergers”. However, theoretical and observational arguments (e.g. Lotz et al. 2008; Genel et al. 2009) suggest a low rate of such events for z galaxies. Thus, major mergers cannot change by more than a factor of between z=2 and z=0. Small “dry mergers” may help. For example, Naab, Johansson & Ostriker (2009) show that present-day massive red ellipticals gain of their mass through accretion of smaller companions since z. Intense SF in outer parts of galaxies due to external source of cold gas which does not find its way to the centre (e.g. van Dokkum et al. 2010), is another possibility. More possibilities and more references are discussed in Benson & Devereux (2009). The distributions presented here suggest an increase in by factors beyond what is suggested in many theoretical studies.
Finally, we comment on the possibility that the suggested evolution of could be due to two wrong assumptions. First, many more AGN hosts may not lie on the SF sequence or may not obey the -SFR correlation used here. This is unlikely to be the case at low redshift, where SDSS type-II AGNs are used. However, the selection of at least some of the most luminous, high redshift high- sources in Fig. 1 may be biased towards high FIR luminosity, high SFR AGN hosts (e.g. Zheng et al. 2009) in particular if these are found in mergers that are not part of the SF sequence. Herschel observations of well-defined AGN samples are likely to resolve this issue. Second, the Drory & Alvarez (2008) work shows a decline in SFR at the high- end for z2 galaxies. Thus, some of our -based SFR estimates might be associated with considerably larger values of . The E07 and D07 SF sequences do not show such a decline.
We conclude that there is a steep evolution in from z to z=0 for SF AGN hosts. This trend is barely consistent with some, but not all galaxy and BH evolution models. We have also demonstrated the crucial importance of considering different groups separately when evaluating the evolution.
We thank an anonymous referee for very useful comments on the manuscript. We thank Ido Finkelmann for fruitful discussions; Vincenzo Mainieri for allowing us to use zCOSMOS results ahead of publication; Roberto Decarli and Emanuele Daddi for sending us their data; Niv Drory and Samir Salim for their thoughtful comments; and the MPA/JHU team for making their SDSS catalogues available to the public. This study makes use of data from the SDSS (http://www.sdss.org/collaboration/credits.html). Funding for this work has been provided by the Israel Science Foundation grant 364/07.
References
- Abazajian et al. (2009) Abazajian, K. N., et al. 2009, ApJS, 182, 543
- Baldry et al. (2004) Baldry, I. K., Glazebrook, K., Brinkmann, J., Ivezić, Ž., Lupton, R. H., Nichol, R. C., & Szalay, A. S. 2004, ApJ, 600, 681
- Bennert et al. (2010) Bennert, V. N., Treu, T., Woo, J.-H., Malkan, M. A., Le Bris, A., Auger, M. W., Gallagher, S., & Blandford, R. D. 2010, ApJ, 708, 1507
- Benson & Devereux (2010) Benson, A. J., & Devereux, N. 2010, MNRAS, 402, 2321
- Brammer et al. (2009) Brammer, G. B., et al. 2009, ApJ, 706, L173
- Brinchmann et al. (2004) Brinchmann, J., Charlot, S., White, S. D. M., Tremonti, C., Kauffmann, G., Heckman, T., & Brinkmann, J. 2004, MNRAS, 351, 1151
- Cattaneo et al. (2009) Cattaneo, A., et al. 2009, Nature, 460, 213
- Daddi et al. (2007) Daddi, E., et al. 2007, ApJ, 670, 156 (D07)
- Decarli et al. (2010) Decarli, R., Falomo, R., Treves, A., Labita, M., Kotilainen, J. K., & Scarpa, R. 2010, MNRAS, 27 (D10)
- Drory & Alvarez (2008) Drory, N., & Alvarez, M. 2008, ApJ, 680, 41
- Dutton et al. (2009) Dutton, A. A., van den Bosch, F. C., & Dekel, A. 2009, arXiv:0912.2169
- Elbaz et al. (2007) Elbaz, D., et al. 2007, A&A, 468, 33 (E07)
- Fan et al. (2006) Fan, X., et al. 2006, AJ, 131, 1203
- Ferrarese & Merritt (2000) Ferrarese, L., & Merritt, D. 2000, ApJ, 539, L9
- Forestell et al. (2010) Forestell, A. D., Gebhardt, K., & Fisher, D. 2010, AAS Meeting Abstracts, 215, #347.06
- Gebhardt et al. (2000) Gebhardt, K., et al. 2000, ApJ, 539, L13
- Gebhardt & Thomas (2009) Gebhardt, K., & Thomas, J. 2009, ApJ, 700, 1690
- Genel et al. (2009) Genel, S., Genzel, R., Bouché, N., Naab, T., & Sternberg, A. 2009, ApJ, 701, 2002
- Häring & Rix (2004) Häring, N., & Rix, H.-W. 2004, ApJ, 604, L89 (HR04)
- Jahnke et al. (2004) Jahnke, K., et al. 2004, ApJ, 614, 568
- Kauffmann et al. (2003) Kauffmann, G., et al. 2003, MNRAS, 346, 1055
- Kotilainen et al. (2007) Kotilainen, J. K., Falomo, R., Labita, M., Treves, A., & Uslenghi, M. 2007, ApJ, 660, 1039
- Kukula et al. (2001) Kukula, M. J., Dunlop, J. S., McLure, R. J., Miller, L., Percival, W. J., Baum, S. A., & O’Dea, C. P. 2001, MNRAS, 326, 1533
- Lotz et al. (2008) Lotz, J. M., et al. 2008, ApJ, 672, 177
- Lutz et al. (2008) Lutz, D., et al. 2008, ApJ, 684, 853
- Marconi & Hunt (2003) Marconi, A., & Hunt, L. K. 2003, ApJ, 589, L21
- Marconi et al. (2004) Marconi, A., Risaliti, G., Gilli, R., Hunt, L. K., Maiolino, R., & Salvati, M. 2004, MNRAS, 351, 169
- McLure & Dunlop (2004) McLure, R. J., & Dunlop, J. S. 2004, MNRAS, 352, 1390
- Merloni et al. (2010) Merloni, A., et al. 2010, ApJ, 708, 137
- Naab et al. (2009) Naab, T., Johansson, P. H., & Ostriker, J. P. 2009, ApJ, 699, L178
- Netzer (2003) Netzer, H. 2003, ApJ, 583, L5
- Netzer et al. (2006) Netzer, H., Mainieri, V., Rosati, P., & Trakhtenbrot, B. 2006, A&A, 453, 525
- Netzer & Trakhtenbrot (2007) Netzer, H., & Trakhtenbrot, B. 2007, ApJ, 654, 754 (NT07)
- Netzer et al. (2007) Netzer, H., et al. 2007, ApJ, 666, 806
- Netzer (2009) Netzer, H. 2009, MNRAS, 399, 1907 (N09)
- Noeske et al. (2007) Noeske, K. G., et al. 2007, ApJ, 660, L43
- Peng et al. (2006) Peng, C. Y., Impey, C. D., Rix, H.-W., Kochanek, C. S., Keeton, C. R., Falco, E. E., Lehár, J., & McLeod, B. A. 2006, ApJ, 649, 616
- Salim et al. (2007) Salim, S., et al. 2007, ApJS, 173, 267
- Shemmer et al. (2004) Shemmer, O., Netzer, H., Maiolino, R., Oliva, E., Croom, S., Corbett, E., & di Fabrizio, L. 2004, ApJ, 614, 547
- Shen et al. (2008) Shen, Y., Greene, J. E., Strauss, M. A., Richards, G. T., & Schneider, D. P. 2008, ApJ, 680, 169
- Shen & Gebhardt (2010) Shen, J., & Gebhardt, K. 2010, ApJ, 711, 484
- Shields et al. (2003) Shields, G. A., Gebhardt, K., Salviander, S., Wills, B. J., Xie, B., Brotherton, M. S., Yuan, J., & Dietrich, M. 2003, ApJ, 583, 124
- Silverman et al. (2009) Silverman, J. D., et al. 2009, ApJ, 696, 396
- Somerville et al. (2008) Somerville, R. S., Hopkins, P. F., Cox, T. J., Robertson, B. E., & Hernquist, L. 2008, MNRAS, 391, 481
- Tremaine et al. (2002) Tremaine, S., et al. 2002, ApJ, 574, 740
- van Dokkum et al. (2010) van Dokkum, P. G., et al. 2010, ApJ, 709, 1018
- Woo et al. (2008) Woo, J.-H., Treu, T., Malkan, M. A., & Blandford, R. D. 2008, ApJ, 681, 925
- Zheng et al. (2009) Zheng, X. Z., et al. 2009, ApJ, 707, 1566