Mass discrepancy in galaxy clusters as a result of the offset between dark matter and baryon distributions
Abstract
Recent studies of lensing clusters reveal that it might be fairly common for a galaxy cluster that the X-ray center has an obvious offset from its gravitational center which is measured by strong lensing. We argue that if these offsets exist, then X-rays and lensing are indeed measuring different regions of a cluster, and may thus naturally result in a discrepancy in the measured gravitational masses by the two different methods. Here we investigate theoretically the dynamical effects of such lensing-X-ray offsets, and compare with observational data. We find that for typical values, the offset alone can give rise to a factor of two difference between the lensing and X-ray determined masses for the core regions of a cluster, suggesting that such “offset effect” may play an important role and should not be ignored in our dynamical measurements of clusters.
keywords:
dark matter-gravitational lensing-X-rays: galaxies: clusters1 Introduction
Galaxy clusters, the largest gravitationally-bound structures in the universe, are ideal cosmological tools. Accurate measurements of their masses provide a crucial observational constraint on cosmological models. Several dynamical methods have been available to estimate cluster masses, such as (1) optical measurements of the velocity dispersions of cluster galaxies, (2) measurements of the X-ray emitting gas, and (3) gravitational lensing. Good agreements between these methods have been found on scales larger than cluster cores.
However, joint measurements of lensing and X-rays often identify large discrepancies in the gravitational masses within the central regions of clusters by the two methods, and the lensing mass has always been found to be times higher than the X-ray determined mass. This is the so-called “Mass Discrepancy Problem” (Allen 1998; Wu 2000). Many plausible explanations have been suggested, e.g., the triaxiality of galaxy clusters (Morandi et al. 2010), the oversimplification of the strong lensing model for the central mass distributions of clusters (Bartelmann & Steinmetz 1996), the inappropriate application of the hydrostatic equilibrium hypothesis for the central regions of clusters (Wu 1994; Wu & Fang 1997), or the magnetic fields in clusters (Loeb & Mao 1994).
Recently Richard et al. (2010) present a sample of strong lensing clusters taken from the Local Cluster Substructure Survey (LoCuSS), among which clusters have X-ray data from Chandra observations (Sanderson et al. 2009). They show that the X-ray/lensing mass discrepancy is at significance — clusters with larger substructure fractions show greater mass discrepancies, and thus greater departures from hydrostatic equilibrium.
On the other hand, lensing observations of the bullet cluster 1E0657-56 (Clowe et al. 2006), combined with earlier X-ray measurements (Markevitch et al. 2006), clearly indicate that the gravitational center of the cluster has an obvious offset from its baryonic center. Furthermore, recent studies (Shan et al. 2010) of lensing galaxy clusters reveal that offset between the lensing center and X-ray center appears to be quite common, especially for unrelaxed clusters. Among the recent sample of 38 clusters of Shan et al. (2010), have been found to have offsets greater than , and clusters even have offsets greater than . Motivated by such observations, we propose to investigate galaxy cluster models where the center of the dark matter (DM) halo does not coincide with the center of the X-ray gas (See Figure 1).
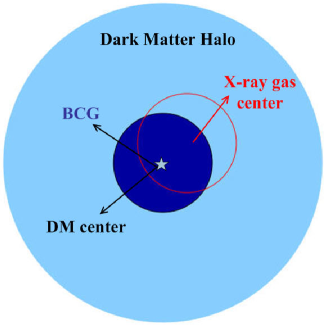
If the X-ray center of a cluster has an offset from its lensing (gravitational) center, then the X-rays and lensing are indeed measuring different regions of the cluster. Given the same radius, the lensing is measuring the DM halo centered at the gravitational center (shown by the dark blue sphere in Figure 1 ), while the X-rays are measuring the sphere of the halo that is offset from the true gravitational center (shown by the red circle in Figure 1). In this case, there will always be a natural discrepancy between the lensing and X-ray measured masses — or specifically, the X-ray mass will always be lower than the lensing mass, just as the long-standing “mass discrepancy problem” has indicated.
In this paper, we investigate the lensing-X-ray mass discrepancy caused by the offsets between DM and X-ray gas. To check our predictions, we compile a sample of clusters with good lensing and X-ray measurements. We conclude that such “offset” effect should not be ignored in our dynamical measurements of galaxy clusters. A flat CDM cosmology is assumed throughout this paper, where =0.3, =0.7, and .
2 Mass discrepancy as a result of the dark matter-baryon offset
We model our galaxy cluster with a fiducial model as the following: (1) the DM halo is modeled by the Navarro-Frenk-White (NFW) profile (Navarro et al. 1997) with concentration and scaled radius , (2) the gas distribution is modeled by a model with , the cluster core radius , and the gas fraction , (3) the mass density of the BCG is described by a Singular Isothermal Sphere (SIS) with a velocity dispersion of .
The projected mass within a sphere of radius is
where is the 2-D radius from the halo center, is the 2-D radius from the X-ray gas center, is the 2-D offset between the halo center and X-ray center, and , , and are the projected mass densities of the DM halo, the gas and the BCG, respectively. For a given radius , the gravitational mass measured by lensing can be given by (as shown by the dark blue sphere in Figure 1), while the projected mass measured by X-rays is described by (the mass within the red circle in Figure 1). We now calculate the mass ratio , or equivalently, .
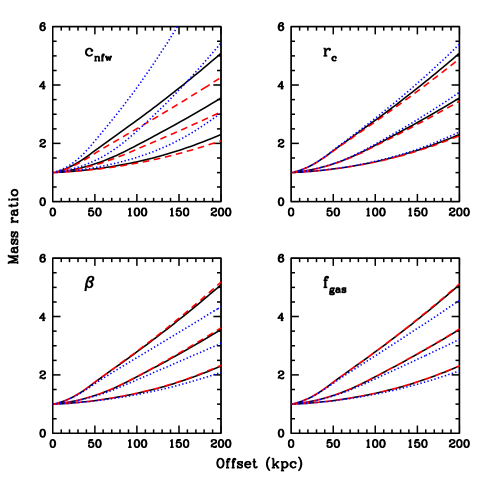
Figure 2 shows the mass ratio as a function of the 2-D offset , for a typical rich cluster. The solid curves are the mass ratio with the fiducial model, the dashed and dotted curves are the mass ratio with the NFW concentration and (top left), the cluster core radius and (top right), the index and (bottom left), the gas fraction and , respectively. For these cases, the three curves from top to bottom are for the three measuring radii , respectively. From Figure 2 we have the following conclusions:
(1) The lensing measured mass is always higher than the X-ray measured mass . For typical values of offset and , , comparable to the ratio found in early studies (Allen 1998; Wu 2000; Richard et al. 2010).
(2) The “Offset Effect” we are reporting here should contribute significantly to the long-standing “Mass Discrepancy Problem”.
(3) The ratio of increases with offset .
(4) depends very strongly on . Here acts like the arc radius in strong lensing, i.e., we only measure the enclosed mass within a small region of . When is very small, the offset effect is most prominent and gives large . Increasing will reduce . When is very large (compared with ), the offset effect will be “smeared out”, and the - discrepancy introduced by the offset will vanish.
(5) The mass ratio is very sensitive to the NFW concentration, and it increases dramatically with .
(6) The mass ratio increases with the core radius, and decreases with index and gas fraction. However, the mass ratio is not very sensitive to the gas model.
3 Comparison with Observational Data
To compare with our theoretical predictions, we compile a sample of clusters with arc-like images, which have both strong lensing and X-ray measurements. The clusters and their lensing and X-ray data are listed in Table 1. For the arcs that have no redshift information, we estimate their lensing masses by assuming the mean redshifts of and , respectively. The X-ray data are taken from Tucker et al. (1998), Wu (2000), Bonamente et al. (2006), and references therein. The offsets between lensing and X-ray centers are taken from Shan et al. (2010). The clusters in our table are classified as relaxed (with cooling flow) and unrelaxed (which are dynamically unmature), from their X-ray morphologies. The definition has been used in the literature by Allen (1998), Wu (2000), Baldi et al. (2007), and Dunn & Fabian (2008).
Mass from strong lensing. Assuming a spherical matter distribution, one can calculate the gravitational mass of a galaxy cluster projected within a radius of on the cluster plane as
| (1) |
where is the critical surface mass density, , and are the angular diameter distances to the cluster, to the background galaxy, and from the cluster to the galaxy, respectively. The above equation is actually the lensing equation for a cluster lens of spherical mass distribution with a negligible small alignment parameter for the distant galaxy within . The values of within the arc radius are listed in Table 1.
Allen (1998) pointed out that the use of more realistic, elliptical mass models can reduce the masses within the arc radii by up to , though a value of is more typical. However, such corrections are still not very significant compared with the large discrepancies between the lensing and X-ray determined masses. We will discuss it in more detail in the next section.
Mass from X-rays. Assuming that the intra-cluster gas is isothermal and in hydrostatic equilibrium, the cluster mass enclosed within a radius can be easily calculated from
| (2) |
where is the gas temperature, the gas number density, the proton mass, and the mean molecular weight. Here we assume that the gas follows the conventional model, i.e., . In order to compare the mass measured by X-rays with the lensing result, we need to convert this (i.e., 3-D) into the projected mass (see e.g. Wu 1994):
| (3) |
where
| (4) |
the mass ratio are listed in Table 1.
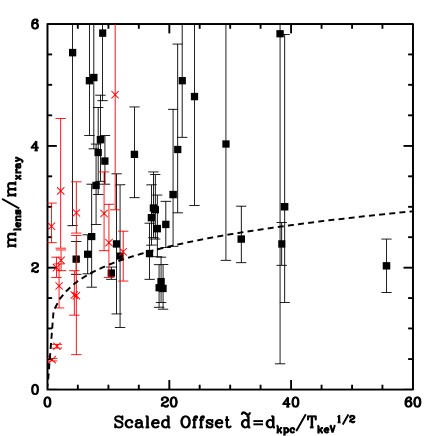
Figure 3 shows the relation between the mass ratios and the (scaled) offsets for our sample of clusters ( arc images). It should be pointed out that the clusters in our sample have quite different sizes and masses. This can be seen from the wide range of the cluster temperatures — from to . Therefore, it is useful to compare the offsets of the clusters on the same scale. We realize that the M-T relation of clusters scales as (e.g., Nevalainen et al. 2000; Xu et al. 2001), and that , where R is the size of the cluster. Therefore, in Figure 3, instead of using the physical offset , we use a scaled offset which is characterized by .
From Figure 3, the mass ratios exhibits large dispersions — roughly ranging from to . Many clusters have large error bars. It appears that relax clusters (marked by crosses) have smaller ratios. The fact that is consistent with our theoretical predictions, and the ratio of is also roughly consistent with our predictions as plotted in Figure 2.
However, no strong correlation has been found between the offset and mass discrepancies. We notice that many clusters in the sample have very small offset values — smaller than the errors in lensing and X-ray measurements which are typically a few arcseconds. So these offset values are not robustly measured themselves, and we thus remove these data points and only focus on clusters with large offsets of , as has been suggested in Shan et al. (2010). This leaves a sub-sample of only arc images. The dashed line in Figure 3 shows a fit to this sub-sample, which satisfies with a reasonable . We can find increasing slightly with .
4 Discussion and Conclusions
As has been reported by Shan et al. (2010), it might be fairly common in galaxy clusters that the X-ray center has an obvious offset from the gravitational center. We have explored the dynamical consequences of this lensing-X-ray offset and tried to attribute such an effect to the long-standing “Mass Discrepancy Problem” in galaxy clusters. Our theoretical model predicts that such an offset effect will always result in a larger than , with a typical mass ratio , which is consistent with observations.
To test our model, we have compiled a sample of clusters, and studied in detail their lensing and X-ray properties and obtained their lensing and X-ray masses, and . The lack of strong correlation between and the offset suggests that the problem is more complicated. As we have found in Section 2, is not only a function of , but also depends very strongly on (or the arc radius ). Apparently, each cluster in our sample has quite different .
Probably, other mechanisms than the offset effect should play important roles, and the lensing-X-ray mass discrepancy may not be just from one mechanism, but a combination of many effects:
(1) The central regions of clusters may be still undergoing dynamical relaxation, and the X-ray gas may not be in good hydrostatic equilibrium. Therefore, large errors could be induced in the X-ray measurement of cluster cores, especially for unrelaxed clusters.
(2) The spherical models are too simple to reflect the real mass distribution of clusters. The use of more realistic mass model could reduce the lens mass within the arc radius by up to , though values of are more typical (Bartelmann 1995; Allen 1998).
(3) The presence of substructures may complicate our simple spherical lens model, and hence could be a main source of uncertainties in . The absence of the secondary arc-like images in most arc-cluster systems may indicate the limitations of the spherical mass distribution in the central regions of clusters.
It should be noted that the mass ratios we obtained here are slightly higher than Allen (1998) and Wu (2000) because they unfortunately used a Hubble constant of . The use of here will of course make the mass discrepancy problem more pronounced.
It should be noted that the gas represents only a perturbation due to the small ratio of gas-to-DM in the central region, likewise the offset of the gas is only a small perturbation (less than ) to the otherwise concentric matter density or potential. It is unlikely to create a factor of two difference in the lensing-derived enclosed masses within an arc.
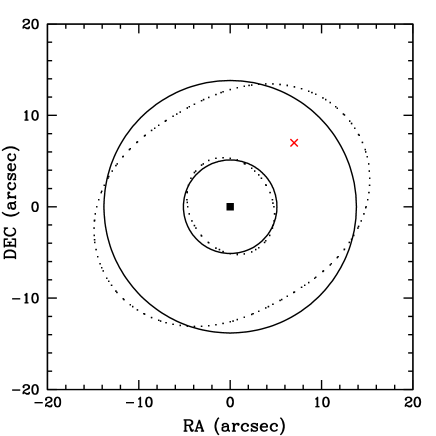
To illustrate the lensing effect of the offset perturbation and triaxiality, we show the critical curves in Figure 4. The solid curves indicate the critical curve of circular NFW plus model without offset, the dotted curves indicate the critical curve of elliptical NFW plus model with offset . The square and cross denote the center of dark matter and the hot gas, respectively. For the NFW profile, ; for the model, . We also introduce the triaxiality with the ellipticity and position angle . We also assume the lens and source redshifts , . We can see that the predicted critical curves (dotted lines) have very similar sizes as the predicted critical curves for a benchmark model (solid lines) with the same mass DM and gas mass but in concentric spheres.
Early studies have suggested that statistically unrelaxed clusters have larger mass discrepancies than relaxed clusters (Allen 1998; Wu 2000; Richard et al. 2010). As Shan et al. (2010) have reported, the clusters with large offset of are all unrelaxed clusters. If such offsets exist and are big, then they must come into play in our dynamical studies of galaxy cluster, and should not be ignored, especially for unrelaxed clusters.
Chapter \thechapter Acknowledgments
We thank Bernard Fort, Charling Tao, and Xiang-Ping Wu for discussions, and an anonymous referee for helpful suggestions. HYS and BQ are grateful to the CPPM for hospitality. This work was supported by the National Basic Research Program of China (973 Program) under grant No. 2009CB24901, and CAS grants KJCX3-SYW-N2 and KJCX2-YW-N32.
References
- (1) Allen, S.W., 1998, MNRAS, 296, 392
- (2) Baldi, A., et al., 2007, ApJ, 666, 835
- (3) Bartelmann, M.,1995, A&A, 299, 11
- (4) Bartelmann, M., & Evrard, A. E., 1996, MNRAS, 283,431
- (5) Bonamente, M., Joy, M., LaRoque, S., Carlstrom, J., Reese, E., & Dawson, K., 2006, ApJ, 647, 25
- (6) Bradac, M., et al., 2006, ApJ, 652, 937
- (7) Dunn, R. J. H., & Fabian, A. C., 2008, MNRAS, 385, 757
- (8) Gioia, I. M., Shaya, E. J., Le Fevre, O., Falco, E. E., Luppino, G. A., & Hammer, F., 1998, ApJ, 497, 573
- (9) Jee, M.J., et al., 2007, ApJ, 661, 728
- (10) Kneib, J.-P., Mellier, Y., Fort, B., & Mathez, G., 1993, A&A, 273, 367
- (11) Limousin, M., et al., 2007, ApJ, 668, 643
- (12) Loeb, A., & Mao, S., 1994, ApJ, 435, 109
- (13) Markevitch, M., 2006, xru, conf, 723
- (14) Morandi, A., Pedersen, K., & Limousin, M., 2010, ApJ, 713, 491
- (15) Morandi, A., Pedersen, K., & Limousin, M., 2010, arXiv: astro-ph/1001.1656
- (16) Navarro, J.F., Frenk, C.S., & White, S.D.M., 1997, ApJ, 490, 493
- (17) Nevalainen, J., Markevitch, M., & Forman, W., 2000, ApJ, 532, 694
- (18) Newbury, & Fahlman, 1999, arXiv: astro-ph/9905254
- (19) Richard, J., et al., 2010, MNRAS, 404, 325
- (20) Sand, D. J., Treu, T., Ellis, R. S., & Smith G. P., 2005, ApJ, 627, 32
- (21) Sanderson, A.J.R., Edge, A.C., & Smith, G.P., 2009, MNRAS, 398, 1698
- (22) Shan, H.Y., Qin, B., Fort, B., Tao, C., Wu, X.-P., & Zhao, H.S., 2010, MNRAS, accepted
- (23) Smith, G. P., Kneib, J., Smail, I., Mazzotta, P., Ebeling, H., & Czoske, O., 2005, MNRAS, 359, 417
- (24) Tucker, W., et al., 1998, ApJ, 496, 5
- (25) Wu, X.-P., 1994, ApJ, 436, 115
- (26) Wu, X.-P., & Fang, L.-Z., 1997, ApJ, 483, 62
- (27) Wu, X.-P., 2000, MNRAS, 316, 299
- (28) Xu, H., Jin, G., & Wu, X.-P., 2001, ApJ, 553, 78
| Cluster | Offset | Ref. Ad | kT | Classc | Ref.Bd | |||||||||
|---|---|---|---|---|---|---|---|---|---|---|---|---|---|---|
| (arcsec) | (kpc) | (Mpc) | (keV) | (Mpc) | ||||||||||
| 1E0657-56 | 0.296 | 47.4 | 209.2 | 3.24 | 0.25 | 4.37 | 3,4 | U | 12 | |||||
| A68a | 0.255 | 14.3 | 56.7 | 1.60 | 0.04 | 0.13 | 11 | U | 2 | |||||
| 1.60 | 0.10 | 0.80 | ||||||||||||
| 2.63 | 0.11 | 0.94 | ||||||||||||
| … | 0.211 | 4.49(3.54)b | ||||||||||||
| 0.86 | 0.28 | 7.49 | ||||||||||||
| … | 0.27 | 7.26(5.72)b | ||||||||||||
| 1.27 | 0.32 | 8.66 | ||||||||||||
| … | 0.12 | 1.54(1.22)b | ||||||||||||
| A267 | 0.230 | 9.62 | 35.3 | … | 0.12 | 1.48(1.20)b | 11 | U | 2 | |||||
| A370a | 0.375 | 19.9 | 102.7 | 1.30 | 0.41 | 13.1 | 7 | U | 13 | |||||
| 0.72 | 0.19 | 4.09 | ||||||||||||
| A697 | 0.282 | 3.07 | 13.1 | … | 0.12 | 1.51(1.15)b | 10 | U | 2 | |||||
| A773a | 0.217 | 6.43 | 22.6 | 0.65 | 0.11 | 1.39 | 11 | U | 2 | |||||
| 0.40 | 0.21 | 7.08 | ||||||||||||
| … | 0.25 | 6.50(5.36)b | ||||||||||||
| … | 0.23 | 5.41(4.45)b | ||||||||||||
| 1.11 | 0.213 | 4.34 | ||||||||||||
| 0.40 | 0.16 | 4.14 | ||||||||||||
| … | 0.04 | 0.18(0.15)b | ||||||||||||
| 0.49 | 0.23 | 7.42 | ||||||||||||
| A963a | 0.206 | 7.10 | 24.0 | … | 0.057 | 0.35(0.29)b | 11 | R | 13 | |||||
| 0.71 | 0.09 | 0.87 | ||||||||||||
| A1689 | 0.183 | 0.60 | 1.85 | … | 0.20 | 4.5(3.8)b | 8 | R | 13 | |||||
| A1835 | 0.252 | 1.61 | 6.33 | … | 0.17 | 2.82(2.23)b | 11 | R | 13 | |||||
| A1914 | 0.171 | 11.3 | 32.9 | … | 0.10 | 1.16(1.01)b | 10 | U | 2 | |||||
| A2204a | 0.151 | 1.20 | 3.15 | … | 0.025 | 0.08(0.07)b | 10 | R | 2 | |||||
| … | 0.01 | 0.013(0.012)b | ||||||||||||
| A2163 | 0.203 | 44.0 | 146.9 | 0.73 | 0.07 | 0.58 | 1 | U | 13 | |||||
| A2218a | 0.176 | 19.1 | 56.9 | 1.03 | 0.28 | 8.60 | 11 | U | 13 | |||||
| 0.70 | 0.09 | 0.89 | ||||||||||||
| 2.52 | 0.09 | 0.82 | ||||||||||||
| A2219a | 0.228 | 11.3 | 41.2 | … | 0.09 | 0.79(0.64)b | 11 | U | 13 | |||||
| … | 0.12 | 1.54(1.26)b | ||||||||||||
| A2259 | 0.164 | 16.3 | 45.9 | 1.48 | 0.04 | 0.13 | 10 | U | 2 | |||||
| A2261a | 0.224 | 1.31 | 4.72 | … | 0.12 | 1.49(1.22)b | 10 | R | 2 | |||||
| … | 0.11 | 1.26(1.03)b | ||||||||||||
| A2390 | 0.228 | 6.00 | 21.9 | 0.91 | 0.20 | 3.8 | 10 | U | 13 | |||||
| CL0024 | 0.395 | 13.2 | 70.4 | 1.68 | 0.26 | 4.7 | 6 | U | 13 | |||||
| MS0440 | 0.190 | 1.50 | 4.89 | 0.53 | 0.10 | 1.23 | 5,10 | R | 13 | |||||
| MS0451 | 0.550 | 12.1 | 76.8 | … | 0.23 | 7.6(3.5)b | 10 | U | 13 | |||||
| MS1008 | 0.360 | 5.43 | 27.3 | … | 0.30 | 9.2(6.2)b | 1 | R | 13 | |||||
| MS1358 | 0.329 | 2.79 | 13.2 | 4.92 | 0.14 | 1.24 | 10 | R | 13 | |||||
| MS1455 | 0.258 | 2.77 | 11.1 | … | 0.11 | 1.22(0.96)b | 9,10 | U | 13 | |||||
| MS2053 | 0.580 | 10.5 | 69.1 | 3.15 | 0.16 | 1.41 | 10 | U | 2 | |||||
| MS2137 | 0.313 | 5.70 | 26.1 | … | 0.10 | 0.99(0.72)b | 9,10 | R | 13 | |||||
| PKS0745 | 0.103 | 6.82 | 12.9 | 0.43 | 0.05 | 0.42 | 10 | R | 13 | |||||
| RXJ1347 | 0.451 | 2.81 | 16.2 | 0.81 | 0.28 | 8.9 | 1 | R | 13 | |||||
a Multiple-arc system.
b Arc-like image is assumed at .
c R: Relaxed, U: Unrelaxed.
d References: (1) Allen 1998; (2) Bonamente et al. 2006; (3) Bradac et al. 2006; (4) Clowe et al. 2006; (5) Gioia et al. 1998; (6) Jee et al. 2007; (7) Kneib et al. 1993; (8) Limousin et al. 2007; (9) Newbury & Fahlman 1999; (10) Sand et al. 2005; (11) Smith et al. 2005; (12) Tucker et al. 1998; (13) Wu 2000