Depletion of CCS in a Candidate Warm-Carbon-Chain-Chemistry Source L483
Abstract
We have carried out an observation of the CCS (=210) line with the Very Large Array in its D-configuration toward a protostellar core L483 (IRAS 181400440). This is a candidate source of the newly found carbon-chain rich environment called ”Warm-Carbon-Chain-Chemistry (WCCC)”, according to the previous observations of carbon-chain molecules. The CCS distribution in L483 is found to consist of two clumps aligned in the northwest-southeast direction, well tracing the CCS ridge observed with the single-dish radio telescope. The most remarkable feature is that CCS is depleted at the core center. Such a CCS distribution with the central hole is consistent with those of previously observed prestellar and protostellar cores, but it is rather unexpected for L483. This is because the distribution of CS, which is usually similar to that of CCS, is centrally peaked. Our results imply that the CCS (=210) line would selectively trace the outer cold envelope in the chemically less evolved phase that is seriously resolved out with the interferometric observation. Thus, it is most likely that the high abundance of CCS in L483 relative to the other WCCC sources is not due to the activity of the protostar, although it would be related to its younger chemical evolutionary stage, or a short timescale of the prestellar phase.
1 Introduction
We recently discovered a Class 0 protostellar core, L1527 in the Taurus molecular cloud, which is extremely rich in carbon-chain molecules (Sakai et al., 2008). Based on the detailed observations, carbon-chain molecules and their anions, CnH, CnH2, HCnN, and CnH-, are confirmed to be enhanced in the warm and dense gas near the protostar, IRAS 04368+2557, in L1527. We call such a newly found chemical environment ”Warm-Carbon-Chain-Chemistry (WCCC)”. The origin of WCCC is proposed to be a consequence of regeneration of carbon-chain molecules triggered by evaporation of CH4 from grain mantles in the warm (30 K) gas around the protostar (Sakai et al., 2008; Hassel et al., 2008). This mechanism has never been expected in classical chemical models for cold dark clouds where carbon-chain molecules are efficiently produced mainly through ion-molecular reactions initiated by atomic carbon before being fixed into CO (Suzuki et al., 1992; Bergin & Langer, 1997; Aikawa et al., 2001). Subsequently, we carried out a survey of several carbon-chain molecules toward low-mass protostellar cores, and found the second WCCC source, IRAS 153983359 in the Lupus molecular cloud (Sakai et al., 2009).
In addition to L1527 and IRAS 153983359, some possible candidates for WCCC were recognized. One of them is L483, where a rare molecule, l-C3H2, is detected and the C4H abundance is relatively high (Sakai et al., 2009). L483 is a well studied star-forming core associated with a protostar IRAS 181400440 in the Aquila rift at a distance of 200 pc (Tafalla et al., 2000). The evolutionary class of IRAS 181400440 (a transition from Class 0 to Class I) is almost similar to that of IRAS 04368+2557 in L1527. This source also seems to be outstanding in a survey of C3H2 (Benson et al., 1998), in which the C3H2 line is bright next to TMC-1 (cyanopolyyne peak and NH3 peak) and L1527.
At the same time, we also identified L483 as a distinctly rich source of carbon-chain molecules like CCS, HC3N, and HC5N among star-forming dense cores (Hirota et al., 2009). The CCS (=432) line is much brighter toward L483 than toward the two other WCCC sources (Benson et al., 1998; Hirota et al., 2009, N. Sakai et al. in preparation). Mapping observations with the 45 m telescope at the Nobeyama Radio Observatory (NRO) revealed that the distribution of CCS has a centrally peaked structure. This seems consistent with the interferometric map of the CS (=21) line which also shows a centrally peaked structure (Jørgensen, 2004). Although these features of CCS could be related to WCCC, no signature of the CCS depletion may be due to a coarse spatial resolution (37″) of the NRO 45 m telescope (Hirota et al., 2009). The resolution may be insufficient to resolve a central hole with the predicted radius of 5000 AU or 25″ at the distance of L483 (Aikawa et al., 2001). In fact, the central hole of CCS in a Class 0 protostellar core B335 is detected only by the interferometric observations (Velusamy et al., 1995). With this in mind, we have conducted a mapping observation of the CCS line toward L483 using the Very Large Array (VLA) of the National Radio Astronomy Observatory (NRAO).
2 Observation and Data Analysis
The observation was made with the VLA in its D-configuration on 2009 October 26. The observed line was CCS (=210) whose rest frequency is 22344.033 MHz (Yamamoto et al., 1990). Two intermediate frequency (IF) bands were employed to receive dual circular polarizations with the bandwidth of 3.125 MHz for each. A spectral resolution was set to be 24.414 kHz, or the velocity resolution of 0.32 km s-1. The target source L483, R.A.=18h17m29s.8 and decl. =04d39′38″.3, and a secondary calibrator, 1743-038, which is 8∘.4 away from L483, were observed over a cycle time of 12 minutes. For each cycle, 9 minutes were spent on L483 and 3 minutes on 1743-038. The observation was allocated for 9 hr and the total on-source integration time was 4.2 hr.
The data were edited and calibrated in the standard manner by using the NRAO Astronomical Image Processing System (AIPS) software package. The absolute flux density and bandpass calibrator was 1331+305 (3C286), for which we adopted a flux density of 2.53 Jy. Amplitudes and phases were calibrated by observing the secondary calibrator 1743-038. The bootstrapped flux density of 1743-038 was 2.99 Jy. The Doppler correction was applied in the post-processing using the AIPS task CVEL. Synthesis imaging and CLEAN were made by using the AIPS task IMAGR. In order to achieve higher sensitivity, we adopted the ROBUST weighting parameter of 5 (natural weighting) and the UVRANGE parameter from 0 to 25 k. The synthesized beam size was 7″.877″.15 with the position angle of -28∘.68. The resulting image sensitivity was 4 mJy beam-1 for each spectral channel.
3 Results
Figure Depletion of CCS in a Candidate Warm-Carbon-Chain-Chemistry Source L483 shows the integrated intensity map of the CCS (=210) line toward L483, superposed on that of the CCS (=432) line at the 45 GHz band taken with the NRO 45 m telescope (Hirota et al., 2009). Hereafter we just refer to the latter map as ”the single-dish CCS map”, although the observed transition is different from that of the VLA observation. The shortest projected baseline in the VLA observation was 1.85 k, and was comparable to the primary beam size of the VLA. Thus, the structure larger than about 60″ or a linear size of 12000 AU was significantly filtered out. Because we only observed the CCS (=210) spectrum toward the core center with the NRO 45 m telescope, as shown in Figure Depletion of CCS in a Candidate Warm-Carbon-Chain-Chemistry Source L483 (Hirota et al., 2009), a combined image by using both the interferometer and the single-dish data (e.g. Velusamy et al., 1995) could not be produced.
As depicted in Figure Depletion of CCS in a Candidate Warm-Carbon-Chain-Chemistry Source L483, the distribution of CCS consists of two compact clumps; one is located at northwest, (-28″, +12″) in right ascension and declination, respectively, of the protostar IRAS 18148-0440, and the other is a weak component located from southeast to south of the protostar. The northwest clump has an FWHM size of 30″18″ with the position angle of -26∘. Although the size is much smaller than the ridge structure extending from northwest to southeast seen in the single-dish CCS map (Hirota et al., 2009), these compact clumps apparently trace its portions (Figure Depletion of CCS in a Candidate Warm-Carbon-Chain-Chemistry Source L483). The southern clump agrees well with the local peak position of the single-dish map, which is slightly shifted to the south from the protostar position.
The most remarkable feature found in the VLA map is that the distribution of CCS is clearly depleted at the protostar position. The radio continuum source, IRAS point source (IRAS 18148-0440), and dust continuum peaks (Beltrán et al., 2001; Fuller & Wootten, 2000; Jørgensen, 2004) all lie between the two CCS clumps. This central depletion corresponds to that previously reported in the NH3 map taken with the VLA (Fuller & Wootten, 2000). Such a CCS hole is similar to the case of another protostellar core B335 (Velusamy et al., 1995) and a dynamically evolved prestellar core L1544 (Ohashi et al., 1999), observed with VLA and BIMA, respectively. It is unlikely that this hole is due to the self-absorption, because the CCS (=210) line is usually optically thin (Suzuki et al., 1992). The hole can be interpreted as a consequence of real abundance decrease of CCS in the central part of a chemically and dynamically evolved core (Bergin & Langer, 1997; Aikawa et al., 2001). No signature of depletion in the single-dish CCS map of L483 (Hirota et al., 2009) originates from an insufficient spatial resolution to resolve the central hole.
Figure Depletion of CCS in a Candidate Warm-Carbon-Chain-Chemistry Source L483 presents the total flux density of the CCS (=210) line observed with the NRO 45 m telescope whose beam size is 74″ at 22 GHz (Hirota et al., 2009), and the integrated flux density observed with the VLA. The VLA spectrum is obtained by summing over the emission region in the map by using the AIPS task ISPEC. The peak antenna temperature of the CCS (=210) line is derived from the NRO 45 m telescope to be 0.36 K (Hirota et al., 2009), corresponding to the total flux density of 1.18 Jy. On the other hand, the integrated flux density of the VLA map only recovers 0.43 Jy at the peak velocity channel. Even though we employ only a central part of the UV data, more than 60% of the flux is missing in the VLA image. The peak velocity channel derived from the VLA map, 5.1 km s-1, is slightly blueshifted from that of the single-dish spectrum, 5.36 km s-1 (Hirota et al., 2009). A possible reason is that the systematic and redshifted velocity components are more extended than the blueshifted one, and are resolved out more significantly. This means that the CCS distribution does not have a compact central condensation.
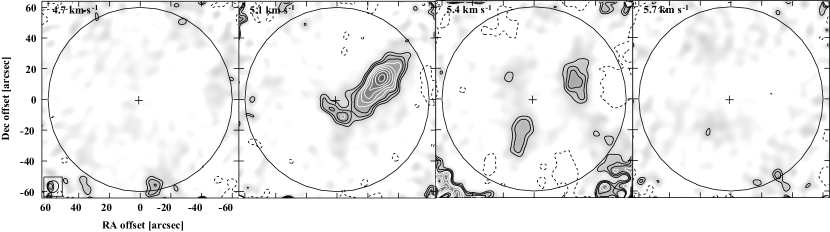
Figure 1 shows the channel maps of the CCS (=210) line. We detected the CCS line only at the central two channels above the 3 noise level. However, we can see a weak emission feature around the southeast of the protostar position at the 5.7 km s-1 channel. This emission feature is also evident at the 5.4 and 5.1 km s-1 channels, and hence, it could be real. Because of our coarse spectral resolution, 0.3 km s-1, it is difficult to detect a small velocity structures of the L483 core caused by rotation, infall, expansion, and/or outflow (e.g. Myers et al., 1995; Park et al., 2000; Fuller & Wootten, 2000; Jørgensen, 2004). In fact, no significant velocity gradient is seen between the northwest and southeast clumps.
4 Discussions
Various molecular lines have been mapped in high-resolution with interferometers toward L483, including HCO+, C3H2 (Park et al., 2000), NH3 (Fuller & Wootten, 2000), CN, C18O, CS, HCN, HCO+, N2H+, and their isotopic species (Jørgensen, 2004). Single-dish mapping observations have also been conducted for some molecular lines (e.g. Tafalla et al., 2000; Hirota et al., 2009) and dust continuum emission (Fuller & Wootten, 2000; Jørgensen, 2004). Nevertheless, none of them show a similar distribution to that of the CCS map taken with the VLA at first glance, except for the single-dish CCS map (Hirota et al., 2009). Since the CCS linewidth is only less than 0.6 km s-1 and no correspondence with the velocity structure relevant to the outflow can be seen, the CCS clumps do not seem to interact with the outflow in contrast to the other molecular species (Jørgensen, 2004).
It is reported that the distribution of CCS and NH3/N2H+ are anticorrelated with each other (Ohashi et al., 1999). This seems true for L483 as a whole. The NH3 distribution appears to extend toward three directions, northwest, northeast, and southwest (Fuller & Wootten, 2000). The northwestern clump of CCS is located at about 10″ west of the peak of the northwest NH3 ridge, although they are partly overlapped with each other. Similarly, the distribution of CCS and N2H+ show mutual anticorrelation except for slight overlapping at the western and southeastern ends of the N2H+ and CCS distributions, respectively (Jørgensen, 2004). Interestingly, all of CCS, NH3, and N2H+ show possible signature of depletion toward the protostar position (Fuller & Wootten, 2000; Jørgensen, 2004).
In contrast, C18O and CS are enhanced in the vicinity of the protostar (Jørgensen, 2004). This is interpreted as a consequence of evaporation from dust grains at the temperature above 40 K. In such a region, CH4, whose sublimation temperature is 30 K, could also be evaporated from dust grains as expected in WCCC (Sakai et al., 2008; Hassel et al., 2008).
It is surprising that the distributions of CCS and CS show anti-correlation, because CCS is believed to be closely related to CS (e.g. Bergin & Langer, 1997; Aikawa et al., 2001). Our results indicate that CCS is hardly enhanced by the activity of the central protostar, namely, a compact centrally condensed structure that is related to WCCC is not detected. The observed CCS clumps might represent remnants of a quiescent cold outer envelope that still remains chemically young. This is consistent with the results of the mapping observation of C4H toward L1527 and IRAS 153983359 (Sakai et al., 2008, 2009), reporting that the significant fraction of C4H is also distributed in the cold outer envelope as well as the vicinity of the protostar (Sakai et al., 2008, 2009). The contribution from the cold outer envelope relative to that from the central condensation seems to be larger than the C4H case in L1527.
If above considerations are true, higher abundance of CCS in L483 (Hirota et al., 2009) implies its earlier evolutionary phase or faster contraction timescale than in the case of L1527 (Sakai et al., 2009). According to the previous survey (Hirota et al., 2009), the column densities of CCS are 12.31012 cm-2 and 5.11012 cm-2 toward L483 and L1527, respectively. Although the NH3/CCS ratio in L483 (121) is larger than that in L1527 (98) only by a factor of 1.2 (Hirota et al., 2009), the column density of CCS in L483 is larger than L1527 by a factor of 2.4. The column density of CCS in IRAS 153983359 is not as high as that in L483 (N. Sakai, in preparation). On the other hand, the column densities of C4H in L1527 and IRAS 153983359 are larger by a factor of about 2 than that in L483 (Sakai et al., 2009). This is probably due to the heavier depletion of sulfur in L1527 and IRAS 153983359. The chemical model calculation by Hassel et al. (2008) predicts that CCS is not very abundant in the WCCC environment compared with the cold early phase before onset of star-formation. Thus, the higher abundance of CCS in L483 means that its outer envelope would be in a less evolved phase, or close to the ”cold peak” of chemical evolution (Hassel et al., 2008). The chemical evolutionary phase of L483 would be rather close to those in typical prestellar cores such as L1544 (Ohashi et al., 1999; Aikawa et al., 2001) or chemically young dark cloud cores which are rich in carbon-chain molecules (Hirota & Yamamoto, 2006). It is also likely that such a difference can be an evidence of variation of contraction and depletion timescale between L483 and other WCCC sources. A similar idea has been proposed for a starless carbon-chain rich core L492, which is also located in the Aquila rift (Hirota & Yamamoto, 2006), as well as for recent survey observations of carbon-chain molecules (Sakai et al., 2009; Hirota et al., 2009).
It should be noted that the anti-correlation between CCS and CS could be attributed to the difference in the gas densities traced by these lines. The critical densities for the CCS (=210) and CS (=21) lines are 8104 cm-3 and 1.7106 cm-3, respectively. Hence, the VLA map of the CCS (=210) line would preferentially trace the outer less-dense regions.
In order to address the issue whether CCS is not really related to the WCCC possibly occurring in deep inside the dense and warm gas in L483, observations of CCS in higher frequency bands would be required. For example, the critical densities of the CCS (=765, 81 GHz) and CCS (=876, 93 GHz) lines are 4.2106 cm-3 and 6.9106 cm-3, respectively, which can trace almost the same volume of gas as of the CS (=21) line. Future observations with ALMA will be able to reveal the high-resolution CCS distributions at the vicinity of the newly born protostar IRAS 18148-0440, along with the extended outer envelope, thanks to its high dynamic-range imaging capability. In addition, it would be essential to investigate the distributions of CCS in other prototypical WCCC sources, L1527 and IRAS 153983359, with high resolution observations in order to understand the production mechanism of CCS in the WCCC environment.
Detailed studies on WCCC in comparison with hot corino chemistry are important to understand chemical variation in low-mass star-formation processes followed by planetary formation (Sakai et al., 2009). Thus, further high resolution observations, in particular with ALMA, of variety of longer carbon-chain molecular species including CnH and CnH2, HCnN and CnH-, as well as CnS, will be crucial for L483 and more protostellar cores in order to shed light on the chemical and dynamical evolutionary scheme of low-mass star-formation.
References
- Aikawa et al. (2001) Aikawa, Y., Ohashi, N., Inutsuka, S., Herbst, E., & Takakuwa, S. 2001, ApJ, 552, 639
- Beltrán et al. (2001) Beltrán, M. T., Estalella, R., Anglada, G., Rodríguez, L. F., & Torrelles, J. M. 2001, AJ, 121, 1556
- Benson et al. (1998) Benson, P. J., Caselli, P., & Myers, P. C. 1998, ApJ, 506, 743
- Bergin & Langer (1997) Bergin, E. A. & Langer, W. D. 1997, ApJ, 486, 316
- Fuller & Wootten (2000) Fuller, G. A. & Wootten, A. 2000, ApJ, 534, 854
- Hassel et al. (2008) Hassel, G. E., Herbst, E., & Garrod, R. T. 2008, ApJ, 681, 1385
- Hirota & Yamamoto (2006) Hirota, T., & Yamamoto, S. 2006, ApJ, 646, 258
- Hirota et al. (2009) Hirota, T., Ohishi, M., & Yamamoto, S. 2009, ApJ, 699, 585
- Jørgensen (2004) Jørgensen, J. K. 2004, A&A, 424, 589
- Myers et al. (1995) Myers, P. C., Bachiller, R., Caselli, P., Fuller, G. A., Mardones, D., Tafalla, M., & Wilner, D. J. 1995, ApJ, 449, L65
- Ohashi et al. (1999) Ohashi, N., Lee, S. W., Wilner, D. J., & Hayashi, M. 1999, ApJ, 518, L41
- Park et al. (2000) Park, Y. -S., Panis, J. -F., Ohashi, N., Choi, M., & Minh, Y. C. 2000, ApJ, 542, 344
- Sakai et al. (2009) Sakai, N., Sakai, T., Hirota, T., Burton, M. G., & Yamamoto, S. 2009, ApJ, 697, 769
- Sakai et al. (2008) Sakai, N., Sakai, T., Hirota, T., & Yamamoto, S. 2008, ApJ, 672, 371
- Suzuki et al. (1992) Suzuki, H., Yamamoto, S., Ohishi, M., Kaifu, N., Ishikawa, S., Hirahara, Y., & Takano, S. 1992, ApJ, 392, 551
- Tafalla et al. (2000) Tafalla, M., Myers, P. C., Mardones, D., & Bachiller, R. 2000, A&A, 359, 967
- Velusamy et al. (1995) Velusamy, T., Kuiper, T. B. H., & Langer, W. D. 1995, ApJ, 451, L75
- Yamamoto et al. (1990) Yamamoto, S., Shuji, S., Kawaguchi, S., Chikada, Y., Suzuki H., Kaifu, N., Ishikawa, S., & Ohishi, M. 1990, ApJ, 361, 318
![[Uncaptioned image]](/html/1007.1066/assets/x1.png)
Integrated intensity map of the CCS (=210) line observed with the VLA (bold line). The velocity range for integration is 5.1 and 5.4 km s-1, and the interval of the contours for the VLA map is 6 mJy beam-1 (1) with the lowest one of 18 mJy beam-1 (3). A large cross indicates the radio counterpart of IRAS 18148-0440 (VLA-2; Beltrán et al., 2001). A circle indicates the primary beam size of the VLA, and the data outside of this region are clipped for clarify the image. Thin contours represent the integrated intensity map of the CCS (=432) line observed with the NRO 45 m telescope (Hirota et al., 2009). The observed grid points are indicated by small crosses.
![[Uncaptioned image]](/html/1007.1066/assets/x2.png)
Spectra of the CCS (=210) line observed with the NRO 45 m telescope (thin line; Hirota et al., 2009) and the VLA (bold line). The VLA spectrum is obtained by integrating the channel map with the AIPS task ISPEC.