CALICE Second Generation AHCAL Developments
Abstract
The CALICE Collaboration is developing and commissioning a technological prototype of a hadronic sandwich calorimeter with approximately 2500 scintillating plates, individually read out by multi-pixel silicon photomultipliers. The new prototype for the AHCAL aims to demonstrate the feasibility to build a calorimeter with fully integrated electronics meeting the constraints of a real detector for the International Linear Collider. The concept of the prototype, as well as the first results obtained in the on going test-beam campaign at DESY are reported here.
1 Introduction
The CALICE collaboration [1] is performing calorimeter development aiming to fulfill the hardware and physics demands of the International Linear Collider (ILC) physics program [2]. The ambitious required jet energy precision () could be achieved with extremely segmented calorimeters using the particle flow approach [2].
For the Analogue Hadron Calorimeter (AHCAL) option for the ILC a physics prototype was successfully used in test-beam campaigns at DESY, CERN and FNAL in the years 2006-09, together with an electromagnetic calorimeter and a tail-catcher muon trigger prototype. That AHCAL prototype is a layer sampling calorimeter with m2 lateral dimension, and total thickness of nuclear interaction lengths. Each layer consists of cm thick steel absorber and a plane of cm thick plastic scintillator tiles. The tile sizes vary from x cm2 in the center of the layer, to x cm2 and x cm2 in the outer regions, resulting in scintillating plates in total. Each tile is coupled to a SiPM via a wavelength shifting fiber. The physics prototype aims to verify the fulfilling of the requirements driven by the physics program forseen at the ILC using a highly granular and segmented tile hadronic calorimeter with silicon photomultiplier (SiPM) readout. For the first time ever, SiPMs were used in a large scale real experiment, showing a stable behavior and efficiency. The main results on the detector calibration and data analysis are reported in [3].
More recently, a new prototype for the AHCAL is under development and commissioning to demonstrate the feasibility to build a calorimeter with fully integrated electronics meeting the constraints of a real detector. In order to cope with the expected channel number of the AHCAL barrel of about 3.9 million, reliable assembly and production procedures have to be developed. A new one-layer integration prototype with about 2500 detector channels is currently under development in order to test all assembly and integration issues.
2 Technological Prototype Concept and Realization
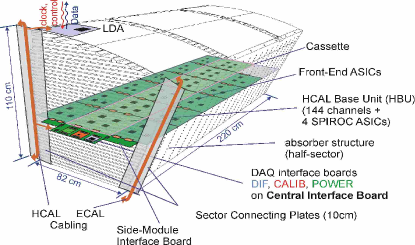
The circular structure of the AHCAL will be divided into sectors. The resulting half of a sector is shown in the left panel of Fig. 1.
There are detector layers foreseen in the current proposal of a sector. Each layer consists of the tiles and the front-end electronics, integrated into the absorber structure and a cm thick stainless steel absorber plate. The typical size of a layer is x m2. The electronics of the sector layers is divided into base units (HBUs) in order to keep the single modules at reasonable sizes concerning the production and handling. The HBU with a typical size of x cm2 integrates 144 scintillating tiles each with SiPMs together with the front-end electronics and the light calibration system. The analogue signals of the SiPMs are read out by four front-end low power dissipation SPIROC ASICs [4] designed at LAL Laboratory in Orsay. Each SPIROC handles the signal from independent channels. After signal pre-amplification and shaping, the peaking amplitude is stored sequentially in one of the cells (capacitors) of the analogue memory array, one array per channel. In order to cover the full depth of cm of a sector layer, HBUs are connected together, forming an electrical layer unit within a layer cassette, a slab. Each sector layer will be equipped with three or four slabs. The new integration prototype that is currently under development will cover one layer cassette.
The top view of the sofar realized prototype modules is shown in the right panel of Fig. 1.
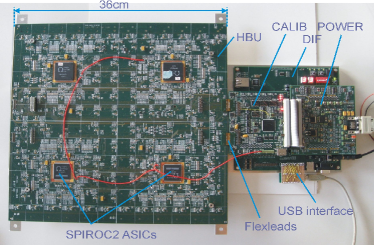
Each module is equipped with two ASICs of the first SPIROC generation and two of the current chip generation (SPIROC2). The results presented here refer to the two SPIROC2. On the right hand side of the HBU the interface modules CALIB (for controlling the LED light-calibration system, and for slow-control monitoring of temperature, supply-voltages and -currents) and POWER (for providing all necessary inner detector supply voltages) are visible. They are connected as mezzanine modules to the Central Interface Board (CIB) module. The CIB is the only interface to the global data acquisition and hosts both, the fast interface path to the front-end ASICs and all slow-control tasks. The size of the modules CALIB, POWER and CIB has to be adapted to the final ILC mechanical environment in the next integration step. Details of the prototype realization can be found in [5].
3 First Results
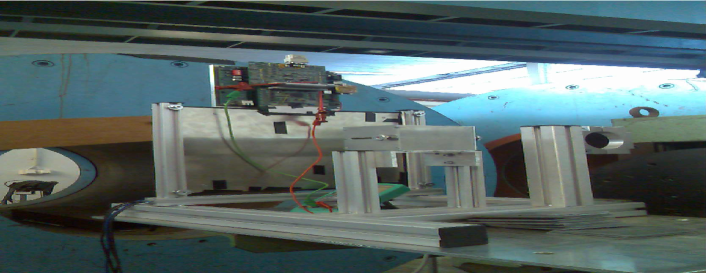
The commissioning of one module prototype is on going since this Spring at the DESY test-beam area, Fig. 2, while a second module is in the laboratory for debugging purposes. In the laboratory environment, measurements help to understand all newly developed system components and the system behavior. The full operation chain of the system, including the programming of slow-control data, data taking with external trigger or ASIC internal trigger, and data readout is established.
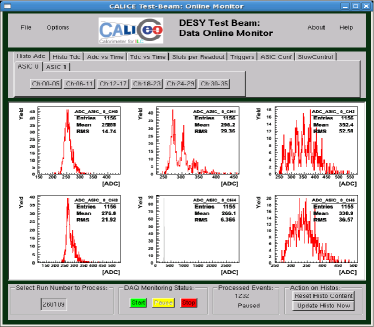
In the test-beam area the prototype is connected to the preliminary DAQ system that connects the system via USB-bus to a Linux PC with LabVIEW as graphical user interface, left panel of Fig. 3. When the prototype will be extended to the aimed 2500 detector channels (a three-slab layer), the DAQ will be replaced by the final CALICE DAQ. Due to the data structure different from the previous CALICE test-beam campaigns, a new online monitor has been written from scratch, scalable with the number of operating SPIROCs in the system, right panel of Fig. 3.
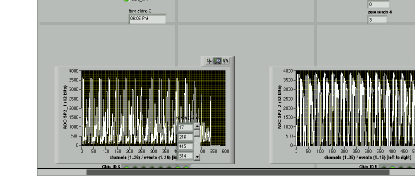
The first measurements were focused to the investigation of the noise level in all the channels for different setting of the ASICs. An example of noise uniformity measurements is presented in the left panel of Fig. 4.
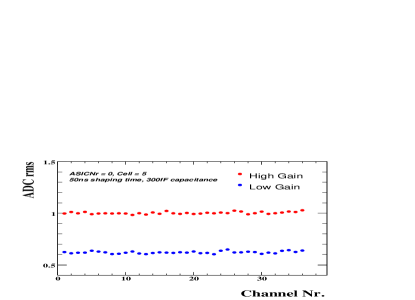
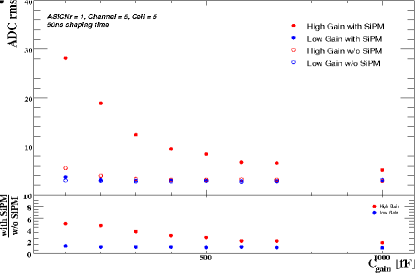
The results are shown in terms of ADC units (two ADC units correspond to mV, and one photoelectron peak corresponds to around e operating the SiPMs at their nominal voltage). While the noise is sufficiently small and uniform for the channels of the presented ASIC, the second SPIROC shows a much higher and non-uniform noise, whose source is under investigation. The noise was measured in high and low gain mode for different values of the pre-amplification capacitance, with and without powering on the SiPM. An example of such measurements is presented in the right panel of Fig. 4, showing that the system noise is dominated by the SiPMs.
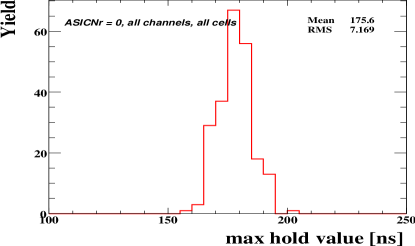
By varying the delay of event triggers, signal values are eventually held inside the chip at different values of their amplitude, and the corresponding charge is then stored in the analogue memory. It is quite crucial to identify the proper trigger delay to store the value of the signal at its peaking amplitude. A scan of delay values was performed flashing the tiles with LED light of the calibration system [5] to investigate the uniformity of the peaking time for all the slots of all channels. The distribution of the measured peaking time values is shown for one ASIC in the top left panel of Fig. 5. Here the scan was performed with ns steps. SPIROCs are operated at a fixed peaking time, and the observed ns spread was found (preliminary) to bias the measurement of the peaking time typically of less than .
Similar measurements using mip-like particles (electrons) from the test-beam are on going.
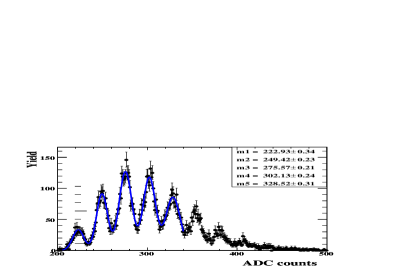
The gain of SiPMs was investigated flashing the tiles with low intensity LED light and fitting the single-pixel ADC spectra with a multi-gaussian function, to eventually extract the distance between the peak maxima. An example of the procedure is presented in the top right panel of Fig. 5. The spread of the measured gain of the available SiPMs was found consistent with what reported in the datasheet provided by the manufactor.
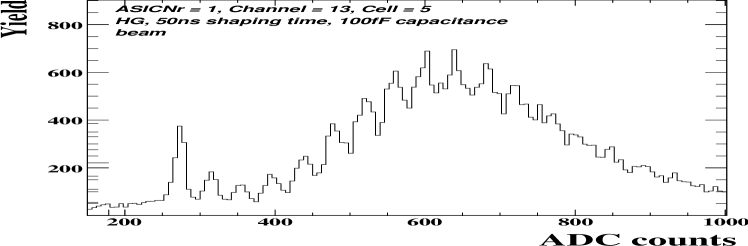
A necessary step for establishing the electromagnetic energy scale of the prototype is the detection of mips. An example of mip spectrum taken using GeV test-beam electrons is shown in the bottom panel of Fig. 5, where the ADC distribution has a maximum around - pixels, in agreement with the datasheet parameters of SiPMs.
In summary, the technological prototype (with integrated electronics) of the AHCAL for the ILC is under development and commissioning to test all assembly and integration issues. The initial stage of the test-beam campaign at DESY has already helped in tuning the DAQ for commissioning the available modules. Several features of the system have been investigated, as the noise level and its uniformity among the several channels, the peaking time determination for the signal from SiPMs, and the measurement of the gain of SiPMs. Also, first mip-signals were observed, necessary for the determination of the electromagnetic scale of the detector. At the same time, close collaboration is on going with the ASIC designers to understand the observed anomalous features of the SPIROC, in order to fix them in the next chip versions, possibly available for the next integration steps.
4 Acknowledgments
The author gratefully acknowledges P. Göttlicher, M. Reinecke, M. Terwort at DESY, and J. Sauer at the University of Wuppertal for their valuable contribution to the results here presented.
References
- [1] CALICE home page: https://twiki.cern.ch/twiki/bin/view/CALICE/CaliceCollaboration
- [2] J. Brau et al., ”International Linear Collider Reference Design Report”, ILC-REPORT-2007-001 (2007).
- [3] R. Fabbri for the CALICE Collaboration, ”Tile AHCAL Test Beam Analysis: Positron and Hadron Studies”, Proc. 2009 IEEE Nuclear Science Symposium (NSS09), NSSMIC.2009.5402374; S. Lu for the CALICE Collaboration, ”Comparison of AHCAL Hadron Shower Data with Simulations”, these proceedings; K. Seidel for the CALICE Collaboration, ”AHCAL Energy Resolution”, these proceedings.
- [4] L. Raux et al., ”SPIROC Measurement: Silicon Photomultiplier Integrated Readout Chips for ILC”, Proc. 2008 IEEE Nuclear Science Symposium (NSS08), NSSMIC.2009.5401891; R. Fabbri, B. Lutz and W. Shen, ”Overview of Studies on the SPIROC Chip Characterisation”, arXiv:0911.1566 and EUDET-Report-2009-05, October 2009.
- [5] M. Reinecke et al., ”Integration Prototype of the CALICE Tile Hadron Calorimeter for the International Linear Collider”, Proc. 2008 IEEE Nuclear Science Symposium (NSS08), NSSMIC.2008.4774800; T. Buanes et al., ”The CALICE Hadron Scintillator Tile Calorimeter Prototype”, Proc. of Techn. and Instr. in Part. Physics (TIPP), 2009, to be published in Nucl. Instr. and Meth. A; P. Göttlicher for the CALICE collaboration, ”First Results of the Engineering Prototype of the CALICE Tile Hadron Calorimeter”, Proc. 2009 IEEE Nuclear Science Symposium (NSS09), NSSMIC.2009.5402334.