Systematic errors in weighted 2–point correlation functions: An application to interaction–induced star formation
Abstract
Weighted correlation functions are an increasingly important tool for understanding how galaxy properties depend on their separation from each other. We use a mock galaxy sample drawn from the Millenium simulation, assigning weights using a simple prescription to illustrate and explore how well a weighted correlation function recovers the true radial dependence of the input weights. We find that the use of a weighted correlation function results in a dilution of the magnitude of any radial dependence of properties and a smearing out of that radial dependence in radius, compared to the input behavior. We present a quantitative discussion of the dilution in the magnitude of radial dependence in properties in the special case of a constant enhancement at . In this particular case where there was a SFR enhancement at small radius kpc, the matching of one member of an enhanced pair with an unenhanced galaxy in the same group gives an artificial enhancement out to large radius kpc. We compare this with observations of SFR enhancement from the SDSS (Li et al. 2008; MNRAS, 385, 1903) finding very similar behavior — a significant enhancement at radii kpc and a weak enhancement out to more than 150 kpc. While we explore a particular case in this Letter, it is easy to see that the phenomenon is general, and precision analyses of weighted correlation functions will need to account carefully for this effect using simulated mock catalogs.
keywords:
galaxies: general — galaxies:statistics1 Introduction
Correlation functions (2-point and higher order ones) have proved to be powerful statistical tools in order to address the study of the galaxy clustering (e.g. Peebles & Groth, 1976; Groth & Peebles, 1977; Peebles, 1980; Davis & Peebles, 1983) and are still widely used in both local (Connolly et al., 2002; Eisenstein et al., 2005; Masjedi et al., 2006) and high-redshift Universe (Giavalisco et al., 1998; Blain et al., 2004). Studies of the two point correlation function have matured to the point that one can study how galaxies populate dark matter halos in detail (e.g., Zehavi et al., 2004), the typical halo masses of galaxy populations as a function of redshift (e.g., Lyman breaks - Giavalisco et al., 1998), the relative clustering of different populations (e.g., the tendency of AGN to cluster like the massive galaxy population as a whole; Li et al., 2006), and the use of clustering measures on the smallest scale to constrain the merger history of galaxies (e.g., Patton et al., 2002, Bell et al., 2006, Robaina et al., 2010).
Furthermore, the correlation function method allows us not only to study the clustering of the galaxies themselves, but also how some of their properties are clustered. Weighted correlation functions (Boerner et al., 1989) or in a general sense, marked statistics (Beisbart & Kerscher, 2000; Gottlöber et al., 2002; Faltenbacher et al., 2002; Skibba et al., 2006; Robaina et al., 2009) have been widely used in the last ten years in order to study how observables depend on the separation between galaxies. In particular, weighted correlation functions are frequently used to study the dependence of star formation rate (SFR) on separation between galaxies, in great part to explore the influence of galaxy interactions on enhancing a galaxy pair’s SFR (e.g. Li et al., 2008; Robaina et al., 2009).
The goal of this Letter is to explore the application of weighted correlation functions to study the variation of observables (e.g., SFR, color, AGN accretion rate, morphology) as a function of radius. We briefly introduce weighted 2 point correlation functions in §2. We then construct a toy model with which we study the behavior of the inferred weighted quantities relative to the input behavior (§3). This toy model is primarily to illustrate some general features of how weighted correlation functions recover input behavior, and we stress that the framework discussed in this Letter applies generally to any application of weighted correlation function analysis, while noting that we choose to present a case that is most directly analagous to the study of SFR enhancement in close pairs of galaxies. We show the results of this analysis in §4. In §5, we briefly compare with observational results of SF enhancement derived using the Sloan Digital Sky Survey (Li et al., 2008). In §6, we present our conclusions. When necessary, we have assumed , , .
2 Background
In this work, we explore the possible artifacts that the use of a marked correlation function could introduce when studying the clustering of galaxy properties. A full explanation of the methodology followed in this work has been already presented in Robaina et al. (2009), and is similar to the methodology adopted by Skibba et al. (2006) and Li et al. (2008); we summarize here the basics of the method but we refer the reader to those papers for a deeper explanation.
The 2–point correlation function is the excess probability of finding a galaxy at a given distance from another galaxy:
| (1) |
where is the probability of finding a galaxy in volume element at a distance from a galaxy, and is the galaxy number density. A simple estimator of the unweighted correlation function is , where is the histogram of separations between galaxies and is the histogram of separations between galaxies in a randomly-distributed catalog. In a similar way, one can estimate the weighted correlation function as , where is the weighted histogram of real galaxies and the weighted histogram of separations from the catalog with randomized coordinates.
We choose to use an additive weighting scheme (the weight of the pair is the sum of the weights of individual galaxies) for concreteness (e.g., Robaina et al., 2009), while noting that a multiplicative weighting would yield a qualitatively similar result. Then, we can define the ‘mark’ as the excess clustering of the weighted correlation function compared to the unweighted correlation function:
| (2) |
3 An idealised experiment
We use De Lucia et al. (2006) catalog at derived from the Millenium simulation (Springel et al., 2005) in order to study how the enhancement in a physical quantity caused by a galaxy–galaxy interaction (e.g., a SF enhancement) would be recovered by weighted 2–point correlation function techniques. We manually assign a weight (we refer to it as the mark) to every galaxy in the sample, giving a mark=1 to galaxies which are not closer than kpc to any other galaxy and mark (with ) to those galaxies which are in close, 3D pairs with separation kpc. For concreteness, we consider simulated galaxies with stellar masses , noting that the conclusions reached in this Letter are generally applicable, in a qualitative sense.
We now examine how the marks of galaxy pairs relate to the actual behavior of the enhancement as a function of separation from their nearest neighbor. The mark is estimated by dividing the weighted correlation function by its unweighted counterpart, and recall that the correlation function relates every galaxy to every other galaxy in the sample 111Even in the case in which some criteria for pair-matching are imposed, like line-of-sight constraints, mass ratio, etc., one particular galaxy will be matched with many secondaries at very different separations.. The weight is additive, and since every galaxy with a companion closer than has weight , the mark of a close pair is . Yet, the galaxies in this close pair will be matched also to every other galaxy in the sample. Therefore, when a galaxy in the same group or cluster at a distance from the enhanced pair is matched with a galaxy in the pair, the mark of that pair will be (1 being the default weight of non-enhanced galaxies). We see that a pair with will show an enhancement when, in reality, there is no physical interaction-induced enhancement at that radius. As that third galaxy will be matched with both galaxies in the neighbor close pair, two pairs with mark= will be contributed. Furthermore, imagine now that there is another real close pair of galaxies placed at several Mpc from the first close pair, in which both galaxies will also have mark=. From matching all those 4 galaxies, the final product will be 6 galaxy pairs displaying mark=. This will clearly affect both the normalization of the mark and the recovered value for the enhancement, producing a tail of false enhancement in the regions where more companions would be found (representing dense regions of the Universe) and decreasing the enhancement found at .
4 Results
We show this effect in Fig. 1. Clearly, a relatively weak tail of enhancement is recovered out to large separations. The amplitude of this tail has a radial dependence, as close pairs of galaxies tend to be found in dense regions of the Universe (Barton et al., 2007). As the magnitude of this tail depends on the distribution of neighbors as a function of the separation it will be more relevant for galaxy samples in which the clustering is stronger (e.g., massive galaxies, or non star-forming galaxies).
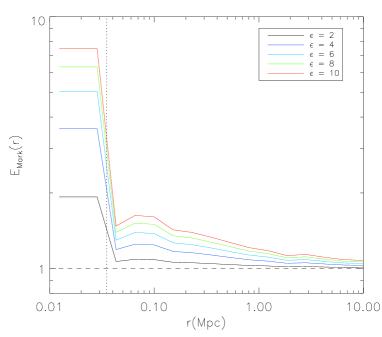
Also visible in Fig. 1 is the dilution of the recovered enhancement compared with the actual enhancement for pairs with ; . The value of is lower than the ”real” enhancement by a factor which increases with . This effect is better seen in Fig. 2, where we show the relative discrepancy between and , as a function of . In this idealised case, this discrepancy can be exactly recovered by accounting carefully for the different pairs formed by galaxies in the sample. The relationship between and is:
| (3) |
where is the total number of pairs which can be formed from the galaxy sample222When performing an autocorrelation, the total number of unique pairs would be , being the number of galaxies in the sample., is the total number of pairs which can be formed with galaxies belonging to close pairs333This is not the same as the number of close pairs, as we already explained., is the weight associated with those pairs, is the number of pairs in which only one galaxy belongs to a close pair, is the weight associated with them, and and are respectively the weight and the number of pairs in which none of the galaxies belongs to a close pair.

In our particular case of an additive weight, this expression reduces to:
| (4) |
where is the fraction of galaxies in close pairs. The degree of clustering of the sample is reflected in the value of , so this expression is valid under different clustering conditions. For the purposes of this work, we calculate directly from the mock catalogue, but real galaxy surveys lack of accurate 3D information. It is common to calculate from the inferred real space correlation function by integrating Eq. 1 out to (Masjedi et al., 2006; Bell et al., 2006). In their analysis, in the limit of small , and if the correlation function is parametrised as a power law , then:
| (5) |
| (6) |
It is worth noting that in the above example we have studied the simple case in which the enhancement is present only in close galaxy pairs, with the enhancement represented by a step function. When applying weighted correlation functions to more complex problems, like those involving clustering of the mass or colour, the function describing the behavior of the weight on separation would be much more complex. In that case, an expression for the behavior of the weight as a function of separation will have to be derived on a case-by-case basis and matched with the data. Yet, even in that more complex case, the underlying problem is very similar: the magnitude of any radial dependence in properties will be diluted and smeared out in radius by the use of weighted 2 point correlation function methods.
5 An example application to observations
In order to test the relevance of this analysis to the real Universe, we compare our predictions with a well-established phenomenon: the enhancement of the star formation rate (SFR) in galaxy interactions. This observable has two obvious advantages. Firstly, there are a number of works in which this enhancement has been studied (Barton et al., 2000; Lambas et al., 2003; Li et al., 2008; Robaina et al., 2009). Second, the SFR is expected to be enhanced only at scales at which galaxy-galaxy interactions are relevant; beyond that scale star formation is not only not expected to be enhanced, but should be depressed because of the well known SFR-density anticorrelation (e.g., Balogh et al., 2002). From the above mentioned works we choose to compare with Li et al. (2008) for three reasons: a) they use marked statistics, b) their large sample allowed an accurate estimate of enhancement to be made, and c) SDSS clustering has been shown to be similar to the one present in the De Lucia et al. (2006) mock catalogue from the Millenium Simulation in the local Universe (Springel et al., 2005).

Real galaxy surveys, even spectroscopic surveys, have no access to the real space separation of galaxies. Li et al. (2008) used a projected correlation function to circumvent this difficulty, where the projected correlation function is related to the 3D correlation function via:
| (7) |
where is the coordinate along the line of sight, and is the projected separation transverse to the line of sight. We use for this exercise galaxies more massive than in order to match the selection citeria in Li et al. (2008). Moreover, they did not use an additive weight but used the SSFR of the primary galaxy as the weight of the pair. We also use such a scheme here to perform our weighted analysis in the simulation. Li et al. (2008) calculated the cross-correlation between a subsample of galaxies which are forming stars (primaries) and all the galaxies in the sample (secondaries). As we lack of such information we run a correlation using all the galaxies as both primaries and secondaries. As previously, we assign an average enhancement to all galaxies found physically in very close pairs, but in order to mimic the the pair selection in Li et al. (2008), who cross-correlate a sample of spectroscopically defined star forming galaxies with a photometric catalog of all galaxies above the stellar mass limit, we run the correlation function selecting galaxy pairs with “line-of-sight” separations of less than 100 Mpc. Our results are not sensitive to this choice of maximum separation; correlations between galaxies on scales larger than 100 Mpc are extremely weak, in comparison to the strong clustering on scales. We choose to model the data with a constant enhancement at , with kpc, Motivated by the star formation enhancement observed in galaxy samples selected in a similar manner at different redshifts (Li et al., 2008; Robaina et al., 2009) we choose to model the data with for galaxies in pairs with separations kpc and for those in pairs with kpc. We also neglect any environmental suppression of star formation at separations (Barton et al., 2000; Balogh et al., 2002). These are clearly oversimplifications, as the real dependence of enhancement (and suppression at large radii) on separation will be considerably more complex. Yet, this simple model suffices to illustrate the recovered enhancement signature expected from a model in which SF is enhanced only at small radii.
Notwithstanding these limitations, we compare the results of our simple model with the data in Fig. 3. Strikingly, we find that the tail of enhanced SF out to 200kpc seen in the data may, in great part, be a reflection of the use of marked correlation functions statistics to explore the radial dependence of SF enhancement in galaxies. This has direct relevance in the interpretation of the results from Li et al. (2008). If one argued that the enhancement at kpc (or much of it) was real, one would need to fulfil two criteria to produce such an effect. Firstly, assuming that the triggering event is the first pass, one would need an enhancement lifetime of at least 300Myr (longer than the internal dynamical time) for typical orbital velocities of 300km/s or less. Secondly, a significant fraction of the secondaries would need to have near-radial orbits in order to produce such an enhancement. If, as we suggest instead, the enhanced SF at kpc is an artifact of the use of the 2 point correlation function, then one would argue that enhancement happens only for close pairs and shorter interaction-induced SF timescales and a greater diversity of orbits would be permitted. While developing a model that realistically reproduces the data is beyond the scope of this Letter, one can clearly see that this effect needs to be accounted for in order to robustly interpret the behavior of marked correlation functions.
6 Conclusions
Weighted correlation functions are an increasingly important tool for understanding how galaxy properties depend on their separation from each other. We use a mock galaxy sample drawn from the Millenium simulation, assigning weights using a simple prescription to illustrate and explore how well a weighted correlation function recovers the true radial dependence of the input weights. We find that the use of a weighted correlation function results in a dilution of the magnitude of any radial dependence of properties and a smearing out of that radial dependence in radius, compared to the input behavior. We present a quantitative discussion of the dilution in the magnitude of radial dependence in properties in the special case of a constant enhancement for pairs separated by . In this particular case the matching of one member of an enhanced pair with an unenhanced galaxy in the same group gives an artificial enhancement out to large radii , and matches of one member of an enhanced pair with a member of another very distant enhanced pair pulls down the value of the recovered enhancement, with the discrepancy between the input and recovered enhancement being a function of the fraction of galaxies in close pairs and the value of the input enhancement. This systematic error is for enhancements , but precision measurements should account for this effect. We compare these results with observations of SFR enhancement from the SDSS Li et al. (2008), finding very similar behavior — a significant enhancement at radii kpc and a weak enhancement out to more than 150 kpc, lending credibility to the notion that weak enhancement in SFR seen out to large radii is an artifact of the use of weighted correlation function statistics. While we explored a particular case in this Letter, it is easy to see that the phenomenon is general.
Given this difference between input weights and those recovered by the weighted 2 point correlation function, one might ask if one shouldn’t use a different method to explore radial trends in observables. We would argue that most different methods boil down to weighted 2 point correlation functions implicitly anyway, and that one is stuck at least at the qualitative level with the differences between input and recovered weights that we have discussed above. For example, partnering projected pairs into different ’pairs’ (i.e., not matching every galaxy with every other galaxy) suffers from two drawbacks: this is still a projected analysis, and many projected close pairs will be separated by significant distances along the line of sight; and second, one may choose the wrong galaxy to partner with, a particularly acute issue for triplets or groups of galaxies. One can see that such a method will suffer from a similar supression of enhancement from the inclusion of non-pairs in the pair sample; of course, radial smearing is not possible in such a case, as there is only one radial bin. We conclude that those wishing to quantitatively analyze weighted correlation functions (or related observables) will need to account carefully for this effect using an analysis of simulated mock catalogs.
Acknowledgments
We thank Cheng Li for sharing with us the electronic version of the results of their work. A. R. R. acknowledges the Heidelberg–International Max Planck Research School program.
References
- Balogh et al. (2002) Balogh, M. L., Couch, W. J., Smail, I., Bower, R. G., & Glazebrook, K. 2002, MNRAS, 335, 10
- Barton et al. (2000) Barton, E. J., Geller, M. J., & Kenyon, S. J. 2000, ApJ, 530, 660
- Barton et al. (2007) Barton, E. J., Arnold, J. A., Zentner, A. R., Bullock, J. S., & Wechsler, R. H. 2007, ApJ, 671, 1538
- Bell et al. (2006) Bell, E. F., Phleps, S., Somerville, R. S., Wolf, C., Borch, A., & Meisenheimer, K. 2006, ApJ, 652, 270
- Blain et al. (2004) Blain, A. W., Chapman, S. C., Smail, I., & Ivison, R. 2004, ApJ, 611, 725
- Beisbart & Kerscher (2000) Beisbart, C., & Kerscher, M. 2000, ApJ, 545, 6
- Boerner et al. (1989) Boerner, G., Mo, H., & Zhou, Y. 1989, A&A, 221, 191
- Connolly et al. (2002) Connolly, A. J., et al. 2002, ApJ, 579, 42
- Davis & Peebles (1983) Davis, M., & Peebles, P. J. E. 1983, ApJ, 267, 465
- De Lucia et al. (2006) De Lucia, G. et al. 2006, MNRAS, 366, 499
- Eisenstein et al. (2005) Eisenstein, D. J., et al. 2005, ApJ, 633, 560
- Faltenbacher et al. (2002) Faltenbacher, A., Gottlöber, S., Kerscher, M., Muumlller, V. 2002, A&A, 395, 1
- Giavalisco et al. (1998) Giavalisco, M., Steidel, C. C., Adelberger, K. L., Dickinson, M. E., Pettini, M., & Kellogg, M. 1998, ApJ, 503, 543
- Gottlöber et al. (2002) Gottlöber, S., Kerscher, M., Kravtsov, A. V., Faltenbacher, A., Klypin, A., Muumlller, V. 2002, A&A, 387, 778
- Groth & Peebles (1977) Groth, E. J., & Peebles, P. J. E. 1977, ApJ, 217, 385
- Lambas et al. (2003) Lambas, D. G., Tissera, P. B., Alonso, M. S., & Coldwell, G. 2003, MNRAS, 346, 1189
- Li et al. (2006) Li, C., Kauffmann, G., Wang, L., White, S. D. M., Heckman, T. M., & Jing, Y. P. 2006, MNRAS, 373, 457
- Li et al. (2008) Li, C., Kauffmann, G., Heckman, T. M., Jing, Y. P., & White, S. D. M. 2008, MNRAS, 385, 1903
- Masjedi et al. (2006) Masjedi, M., et al. 2006, ApJ, 644, 54
- Patton et al. (2002) Patton, D. R., et al. 2002, ApJ, 565, 208
- Peebles & Groth (1976) Peebles, P. J. E., & Groth, E. J. 1976, A&A, 53, 131
- Peebles (1980) Peebles, P. J. E. 1980, Research supported by the National Science Foundation. Princeton, N.J., Princeton University Press, 1980. 435 p.,
- Robaina et al. (2009) Robaina, A. R., et al. 2009, ApJ, 704, 324
- Robaina et al. (2010) Robaina, A. R., Bell, E. F., van der Wel, A., Somerville, R. S., Skelton, R. E., McIntosh, D. H., Meisenheimer, K., & Wolf, C. 2010, accepted in ApJ, arXiv:1002.4193
- Skibba et al. (2006) Skibba, R., Sheth, R. K., Connolly, A. J., & Scranton, R. 2006, MNRAS, 369, 68
- Springel et al. (2005) Springel, V., et al. 2005, Nat, 435, 629
- Zehavi et al. (2004) Zehavi, I., et al. 2004, ApJ, 608, 16