Thermoelectric Power of the YbT2Zn20 (T = Fe, Ru, Os, Ir, Rh, and Co) Heavy Fermions
Abstract
The thermoelectric power, , of the heavy fermions YbT2Zn20 ( = Fe, Ru, Os, Ir, Rh, and Co) has been measured to shed further light on their strong electronic correlations. A large, negative, local minimum in with approximately -70 V/K is found for all compounds. From the observed local minimum, the energy scales associated with both the Kondo temperature and the crystalline electric field splitting are deduced and compared to previous specific heat measurements. At low temperatures, a highly enhanced value is observed for all members, although does show a deviation from a purely linear temperature dependence, = , for T Fe members. In the zero temperature limit, estimated by a simple linear extrapolation, the enhanced value strongly correlates with the electronic specific heat coefficient, .
pacs:
72.15.Jf, 72.15.Qm, 75.20.Hr, 75.30.MbI Introduction
In a heavy fermion (HF) Kondo lattice system, the ground state is a Fermi-liquid (FL) state formed out of Landau quasi-particles. In Ce-, Yb-, and U-based intermetallic systems the conduction electrons compensate, or screen, the localized moments of the -electrons where localized electrons together with their screening cloud form quasi-particles. These quasi-particles have heavy masses, reflected in an enhanced value of the Sommerfeld coefficient, = , at low temperatures Hewson1993 .
For Yb-based HF systems, the electrical resistivity and thermoelectric power (TEP) reveal complex temperature dependencies with a local extrema. In general, these extrema are related to Kondo scattering associated with the ground state and excited states of the CEF energy levels Bhattacharjee1976 ; Lassailly1985 ; Maekawa1986 . The characteristic temperature of the local maximum shown in and the local minimum developed in allow for an estimate of the Kondo temperature, , and the crystalline electric field (CEF) splitting, , as relevant energy scales in Yb-based HF systems.
The FL state in HF Kondo lattice systems shows strong correlations among physical quantities. One such correlation is the Kadowaki-Woods (K-W) ratio, a relation between the electrical resistivity ( = ) and specific heat ( = ), given by what was originally thought to be an universal ratio = 1.010-5 cm/(mJ/molK)2 Kadowaki1986 ; Miyake1989 . Recently, systematic deviations of the K-W ratio in many HF systems (especially for Yb-based compounds) have been explained by Tsujii ., taking into account the ground state degeneracy ( = 2+1) Tsujii2003 ; Kontani2004 ; Tsujii2005 . A FL state is also characterized by the Wilson ratio () which links to the Pauli susceptibility Weigman1983 ; Auerbach1986 ; Lee1986 , which is given by = , where , , and are the Boltzman constant, Lande’s factor, and Bohr magneton, respectively Hewson1993 . In addition to the and the K-W ratio, the zero temperature limit of the TEP divided by temperature, = , for several correlated materials has shown a strong correlation with via the dimensionless ratio = = Behnia2004 , where is the Avogadro number and is the carrier charge. It is very important to test the universality of the K-W ratio, Wilson’s number, and q ratio for a number of isostructural materials; the YbT2Zn20 compounds offer six isostructural materials where the local environment of the hybridizing Yb-ion is identical (nearest and next nearest neighbors are all Zn).
In this paper, TEP measurements on YbT2Zn20 (T = Fe, Ru, Os, Ir, Rh, and Co) are presented as functions of temperature and magnetic field to study their temperature and magnetic field dependence and to evaluate the correlation between specific heat and TEP in the zero temperature limit. These compounds crystallize in the cubic CeCr2Al20-type structure (, No.227) Thiede1998 and have been reported to be HF metals with no long range order down to 20 mK Torikachvili2007 . In the FL regime it has been shown that the and K-W ratios in this family follow the theoretical predictions with different ground state degeneracies. The TEP data of YT2Zn20 (T = Fe, Co) are also presented for comparison. YFe2Zn20 is an example of a nearly ferromagnetic Fermi liquids (NFFL) with a highly enhanced magnetic susceptibility value at low temperatures Jia2007 , whereas YCo2Zn20 shows un-enhanced Pauli paramagnetic, metallic behavior.
II Experimental
Single crystals of YbT2Zn20 (T = Fe, Ru, Os, Ir, Rh, and Co) and isostructural YT2Zn20 (T = Fe and Co) were grown out of excess Zn Torikachvili2007 ; Jia2007 using standard solution growth techniques Canfield1992 ; Canfield2010 . The TEP was measured using a dc, alternating heating, technique that utilizes two heaters and two thermometers Mun2010 . A Quantum Design Physical Property Measurement System provided the temperature (from 2 to 300 K) and magnetic field (up to 140 kOe) environment. For T = Fe, Rh, and Co, zero-field TEP measurements were extended down to 0.4 K, measured using the same technique Mun2010 , in a CRYO Industries of America, 3He system. The heat current was generated in the (111)-plane of the samples ( (111)) and the magnetic field was applied along the [111]-direction maintaining a transverse configuration, H.
III Results
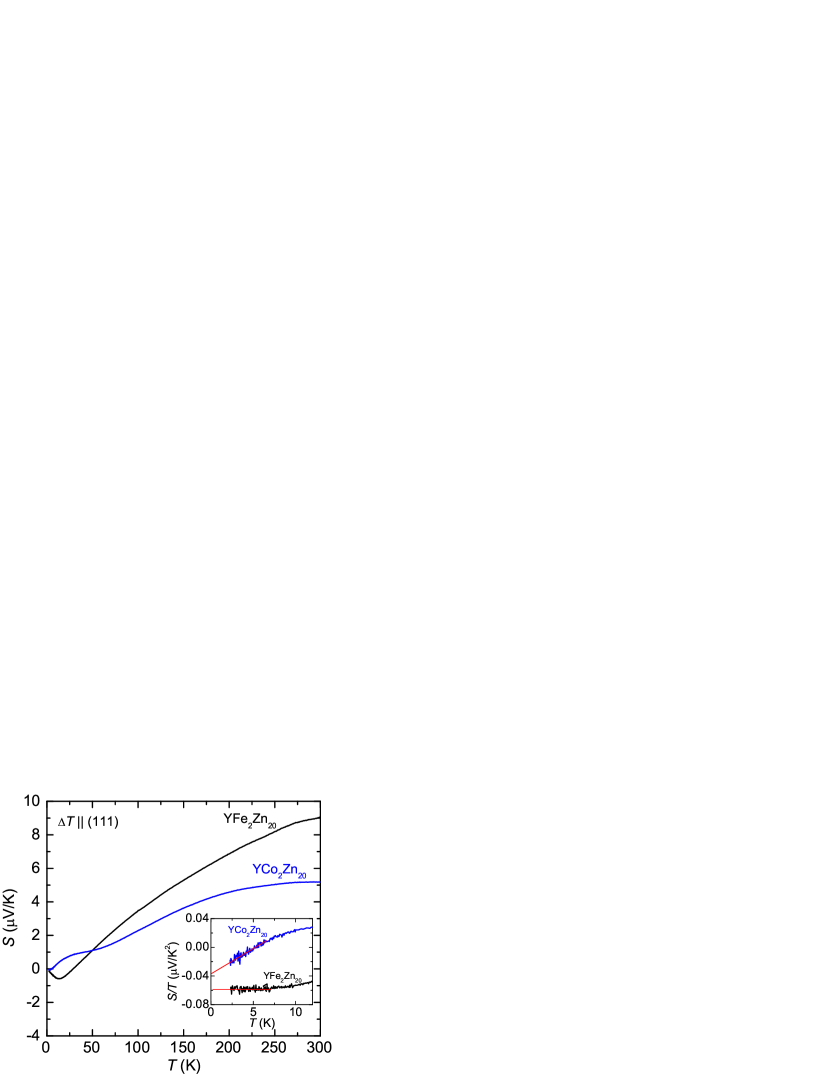
Figure 1 shows the TEP data for YFe2Zn20 and YCo2Zn20. The temperature-dependent TEP, , of these compounds is similar to normal metallic systems. At 300 K, of both compounds is positive and has an absolute value of 9 V/K for YFe2Zn20 and 5 V/K for YCo2Zn20, and then decrease monotonically to below 50 K with decreasing temperature. With further cooling, of YCo2Zn20 passes through a broad peak (/12 Jia2008 , where is the Debye temperature) expected to be due to phonon-drag Blatt1976 . On the other hand, of YFe2Zn20 shows a local minimum around 14 K (/23 Jia2008 ) that is not currently understood. The absolute value of the TEP for YFe2Zn20 is much smaller than other NFFL systems. A signature of the spin fluctuation temperature, , has been inferred from a shoulder in Fe4Sb12 ( = Ca, Sr, and Ba) data Takabatake2006 and as a minimum developed in Co2 ( = Y, Sc, and Lu) data Gratz2001 . The minimum developed near 14 K may be related to the signature of spin fluctuation, combined with phonon-drag in the YFe2Zn20 system. In the 0 K limit, the magnitude of of YFe2Zn20 is larger than that of YCo2Zn20 as shown in the inset of Fig. 1.
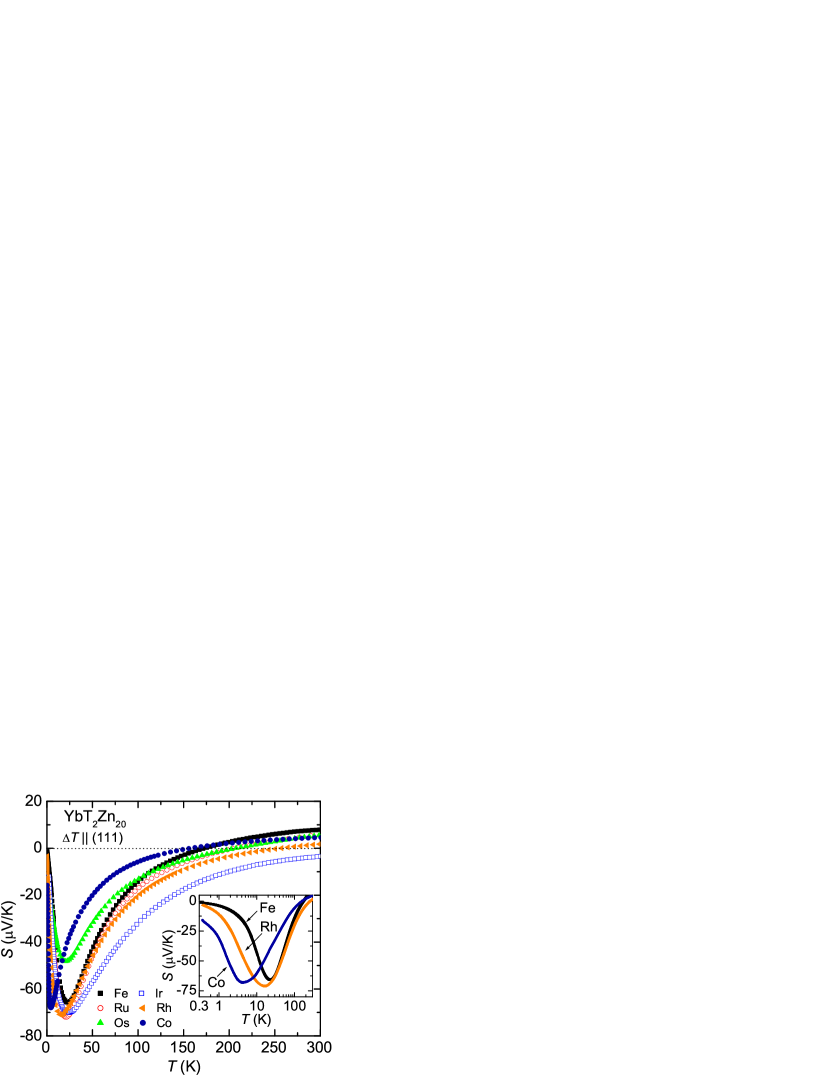
The zero field data of the YbT2Zn20 (T = Fe, Ru, Os, Ir, Rh, and Co) compounds are plotted in Fig. 2. In contrast to the isostructural Y-based compounds, of the Yb-based compounds exhibits a large, negative minimum (between -75 and -45 V/K) and the sign of changing above 150 K from negative to positive (not observed in this temperature range for T = Ir). The absolute TEP values of Yb-based compounds are much larger than Y-based compounds at low temperatures, whereas they have a similar order of magnitude compared to Y-based compounds around 300 K. A negative, highly enhanced value of the TEP, over the temperature region measured, is typical of those found in other Yb-based Kondo lattice systems Foiles1981 ; Andreica1999 ; Deppe2008 .
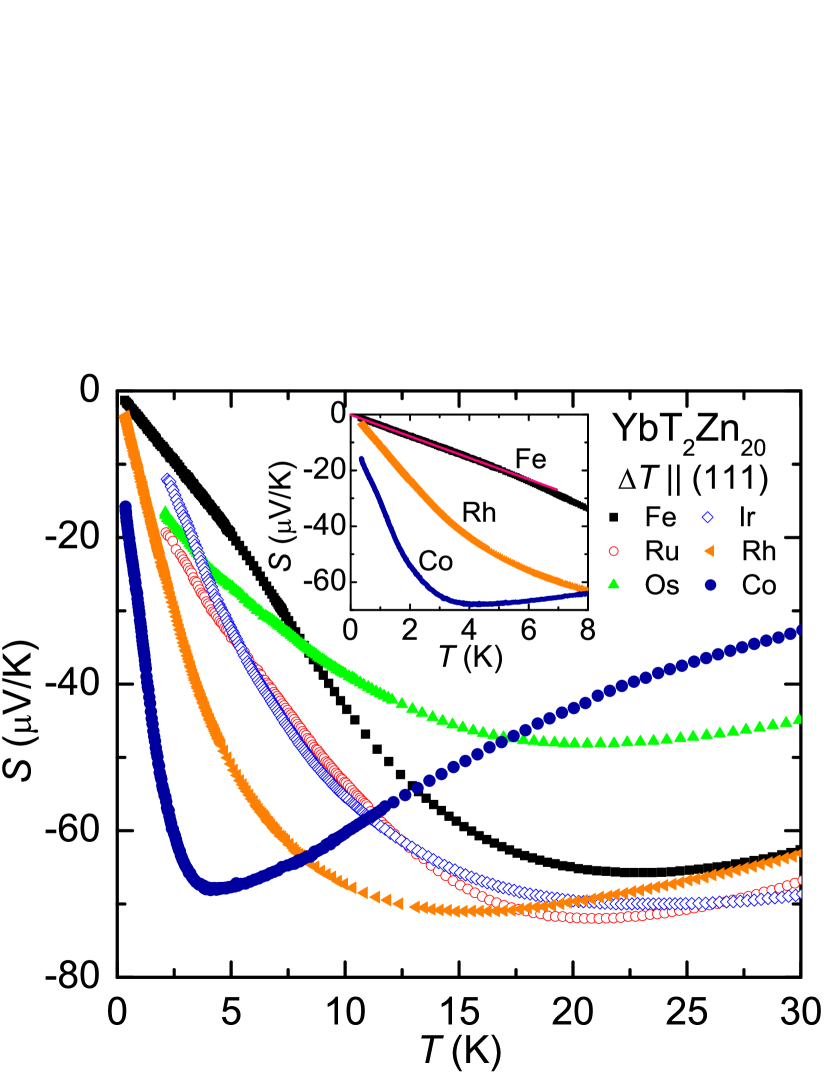
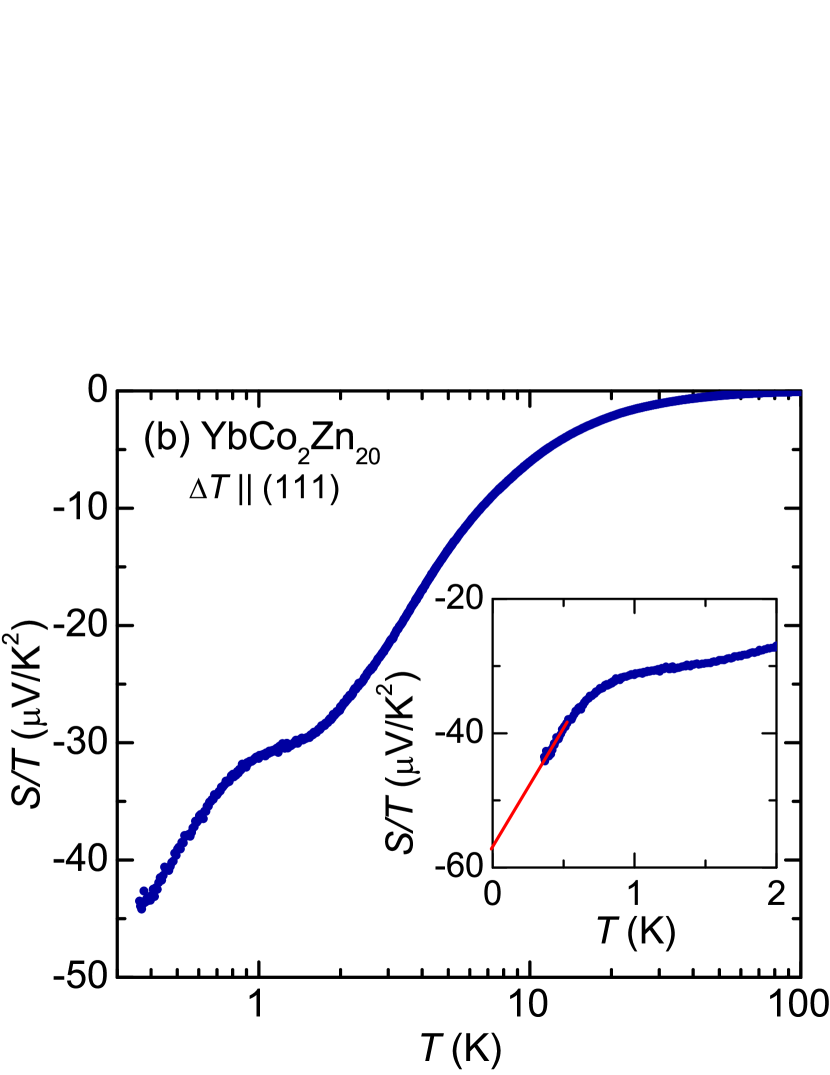
Figure 3 shows the low temperature of YbT2Zn20. For T = Fe and Ru, a broad minimum of -70 V/K is shown at the temperature 22 K. For T = Os, Ir and Rh, a similar broad minimum develops at a temperature of 16-23 K, where the width of the peak is wider than that for T = Fe and Ru. For T = Co, shows a similar temperature dependence but with the minimum shifted to 4 K and it also shows slope changes around 1 K and 8 K. The width of the minimum for T = Co is narrower than that for the other members of this family. Above 10 K, the absolute value of the TEP for T = Co reduces more rapidly as the temperature increases than it does for the other YbT2Zn20 compounds and the sign of the TEP changes from negative to positive close to 150 K. For comparison, curves for T = Co together with T = Fe and Rh are plotted on a semi-logarithmic scale in the inset of Fig. 2. A smaller local minimum ( -48 V/K) is observed for YbOs2Zn20. It is not clear at present if this is related to the electrical resistivity measurement that showed a larger residual resistivity in YbOs2Zn20 compared to other members (T = Fe, Ru, Ir, and Rh) Torikachvili2007 . of YbIr2Zn20 is negative over the whole temperature range measured, the sign change from negative to positive being expected around 400 K, based on a linear extrapolation of above 250 K. Below 10 K (or 3 K for T = Co), data for all compounds show a tendency of approaching zero and reveal linear temperature dependencies that, to varying degrees, approach = . The inset of Fig. 3 shows data down to 0.4 K for T = Fe, Rh, and Co and shows roughly this linear behavior in greater detail.
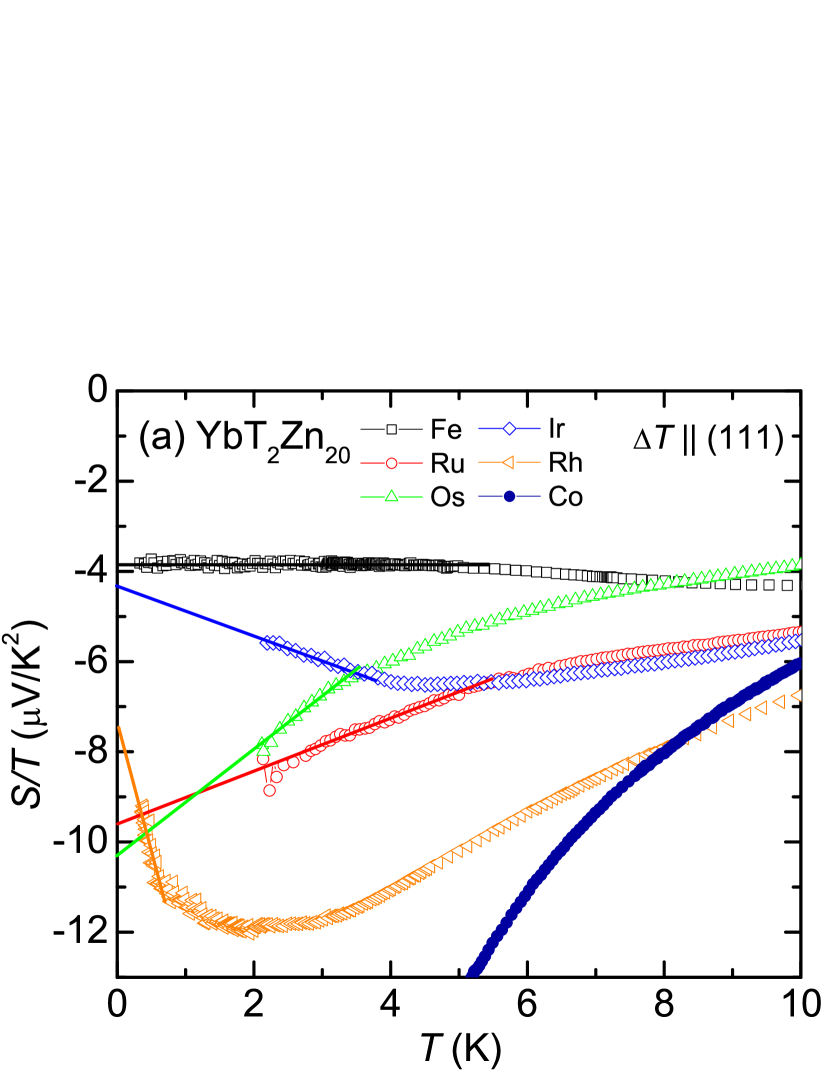
The precise temperature dependence of can be seen more quantitatively in Fig. 4 where the of YbT2Zn20 below 10 K is presented. For T = Fe the clear, linear temperature dependence of TEP, , is revealed below 4 K. For other compounds, shows an additional temperature dependence (probably due to the CEF effect and tiny phonon contribution). For T = Rh, the shows a strong temperature dependence at low temperature which is consistent with the temperature dependence of Torikachvili2007 , where both and revealed a broad peak structure centered around 23 K. For T = Ir, the and also shows a broad feature around 4 K. Similar linear versus (i.e. ) behavior was noted for the majority of HF compounds discussed in Ref. Behnia2004 . This being said, the observed temperature dependence of is not similar to the behavior shown in the resistivity, but is consistent with . The fact that temperature region manifesting the Fermi liquid behavior in the resistivity is not the same as that of the , can be due to the several additional contribution to . Since the additional contributions cannot be completely separated, by using a first and simple approximation, the zero temperature limit of has been estimated by linear extrapolating from 2 K (or 0.4 K) to = 0 (solid lines in Fig. 4), where the inferred values for T = Fe, Ru, Os, Ir, and Rh range between -3.8 -10 V/K2. For T = Co, the value at 0.4 K reaches -42 V/K2 and is still decreasing (see Fig. 4 (b)). By using a linear extrapolation, value for T = Co is found to be -57 V/K2.
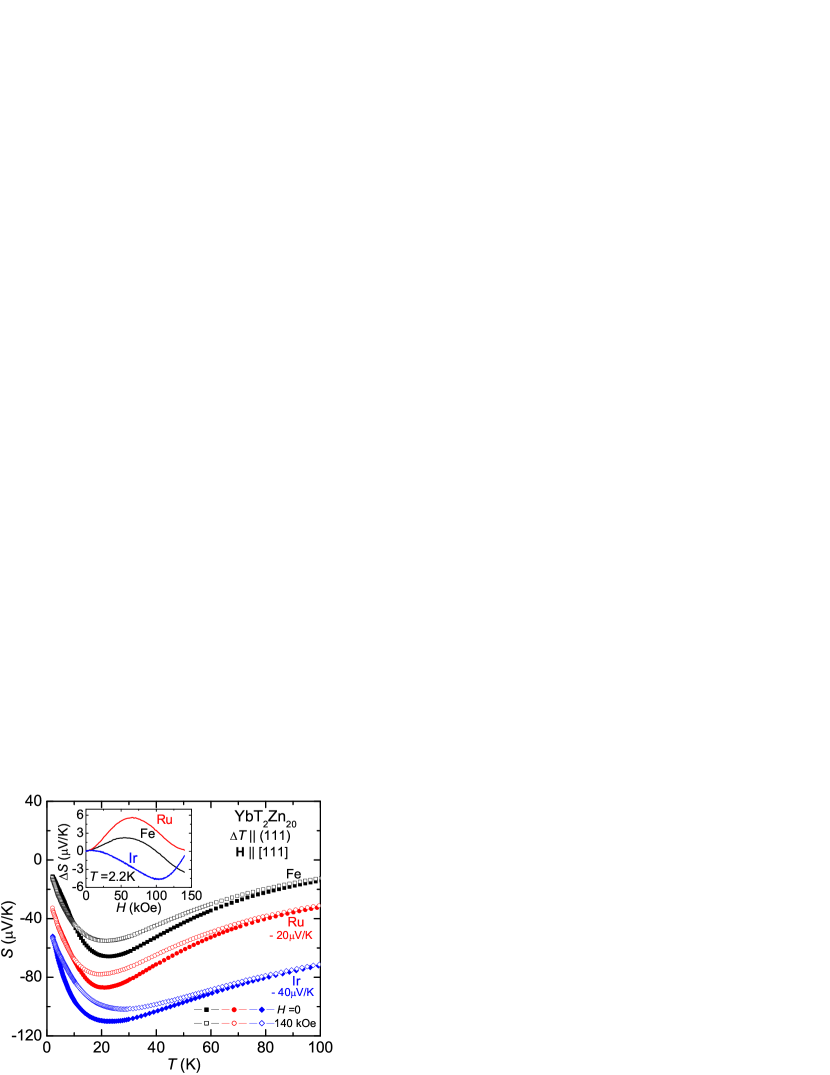
In Fig. 5, the results of measurements at = 0 and 140 kOe are shown for T = Fe, Ru and Ir. For clarity, the absolute value of the TEP is shifted by -20 V/K for T = Ru and -40 V/K for T = Ir. A slight change of and a reduction of absolute value are seen for the = 140 kOe data. Above 100 K, for = 140 kOe remains essentially the same as for = 0. In the zero temperature limit for = 140 kOe data, whereas for T = Ru remain essentially the same, at 140 kOe for T = Fe and Ir decrease from -3.8 to -6.4 V/K2 and from -4 to -6.6 V/K2, respectively. In the inset, the TEP measured at = 2.2 K is plotted as a function of magnetic field for T = Fe, Ru, and Ir, where . An interesting point of this result is the appearance of a maximum around 70 kOe for T = Fe and Ru and a minimum around 100 kOe for T = Ir. For T = Ir the local minimum field shown in TEP is roughly matched with the metamagnetic-like anomaly seen around = 120 kOe in magnetization isotherms, , Yoshiuchi2009 for H [110]. For T = Fe and Ru the data at = 2 K do not show any signature of metamagnetic-like behavior up to 70 kOe Mun2010c , with being linear in magnetic field for both compounds. In order to clarify this point, it is necessary to measure for magnetic fields higher than 70 kOe, to see whether the anomaly in is related to features in magnetization or electronic data.
IV Discussion
Based on earlier thermodynamic and transport measurements of this family Torikachvili2007 , data for YbT2Zn20 (T = Fe, Ru, Os, Ir, Rh, and Co) can be understood qualitatively by considering the Kondo () and CEF () effects. The compounds in this series appear to be a set of model Kondo lattice systems with varying energy scales: and . In Fig. 6 (a), the Kondo temperature, , determined from Torikachvili2007 and local minimum temperature, , observed in the zero field data are plotted as a function of the transition metal, T. The value of correlates strongly with the value of for T = Os, Ir, Rh, and Co.
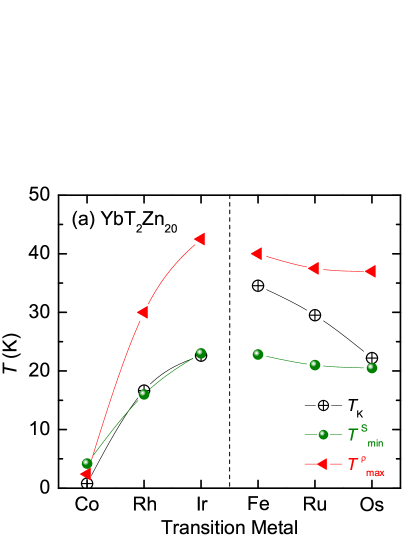
A similar trend can be found in the previously published electrical resistivity, , results Torikachvili2007 . For T = Co, manifests a clear local maximum, , around 2.4 K followed by a logarithmic temperature dependence as temperature decreases. Whereas is clear in the data for T = Co, data from the other members of this family only show a clear local maximum after subtracting the resistivity data of the isostructural LuT2Zn20 (T = Fe, Ru, Os, Ir, and Rh) compounds. The local maximum temperatures, , taken from Ref. Mun2010a are plotted in Fig. 6 (a). The variation of follows the same trend as with 2 even for T = Fe and Ru.
In a Kondo lattice system, a single minimum developed in is expected when is either close to or higher than . Typically, an intermediate valence system such as YbAl3 Foiles1981 and YbCu2Si2 Andreica1999 and a fully degenerate Kondo lattice system such as Yb2Pt6Al15 Deppe2008 exhibit a single minimum in the TEP, developing below . When , more than one peak has been frequently observed in the TEP Andreica1999 ; Huo2001 ; Wilhelm2004 ; Kohler2008 . The low temperature extremum is usually located close to , and the high temperature extremum located at 0.4-0.6 is attributed to Kondo scattering off of the thermally populated CEF levels, which is in agreement with theoretical predictions Bhattacharjee1976 ; Maekawa1986 ; Bickers1985 ; Mahan1997 ; Zlatic2003 ; Zlatic2005 . Therefore, the peak position can represent and as relevant energy scales in Kondo lattice systems.
For the YbT2Zn20 family, and the ground state degeneracy play important roles in the thermodynamic and transport properties. By considering the ground state degeneracy ( = 8 for T = Fe and Ru, and = 4 for T = Os, Rh, Ir, and Co Torikachvili2007 ) it is expected that for T = Fe and Ru and for T = Os, Ir, Rh, and Co. Based on this, for T = Fe and Ru, it is reasonable to assume that and simply reflect ; with the fully degenerate case corresponding to = 8. For T = Os, Ir, Rh, and Co, the two extrema in the data associated with Kondo scattering on the ground state and thermally populated CEF levels could be expected, however, only one broad peak structure is developed for T = Os, Ir, Rh, and Co. We thus expect that a single broad minimum is produced by merging more than one peak structure due to the relatively small CEF level splitting ( ).
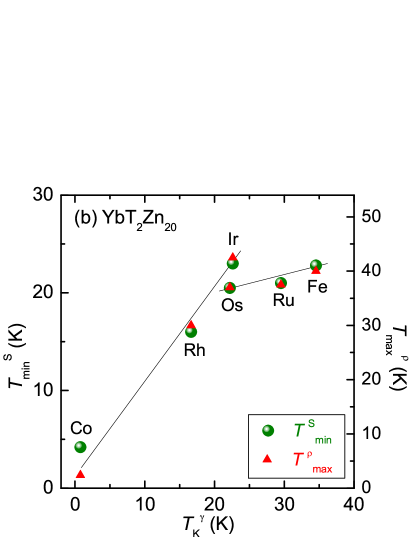
To reiterate: A strong correlation between the two local extrema and develops and remains robust even when dependence on appears to break down (Fig. 6 (b)). 2 for T = Fe, Ru, Os, Ir, and Rh, and for T = Os, Ir, Rh, and Co and 2 .
As shown in Fig. 5 the magnetic field dependence of the TEP observed in YbT2Zn20 (T = Fe, Ru, and Ir) is anomalous. In the simplest case of a two band model, the carrier density of electrons, , and holes, , can be taken as = = . The diffusion TEP in magnetic field with several assumptions Sondheimer1948 can be expressed as
where , and with and (Lorentz number); = 1/ and are the electrical conductivity and thermal conductivity, respectively, in zero magnetic field. At low temperatures = , (the residual resistivity), and the diffusion TEP in zero magnetic field is proportional to the temperature, . Therefore, for simple metals = 0 when = 0, and for very low temperatures . At high temperatures = , and and are both proportional to temperature, so that tends to zero like 1/ as . In general, the change in the TEP will be too small to be detected at room temperature. Since the magnetoresistance (MR) for T = Fe and Ru is positive and increases monotonically at 2 K for H [111] up to 140 kOe Mun2010a , the change of the TEP () should increase or saturate with increasing magnetic field. The field dependence of the TEP is not consistent with the MR results. Generally, the phonon-drag itself is not sensitive to the applied magnetic field Blatt1976 , so it is clear that neither conventional phonon-drag nor diffusion TEP of conduction electrons can account for the magnetic field dependence of the TEP in these compounds. Thus, multiple factors, such as the Kondo effect and CEF contributions, have to be considered. In order to understand the observed behavior in more detail, a theoretical analysis of the TEP as a function of field for this systems will be necessary.

Earlier thermodynamic and transport measurements Torikachvili2007 showed that the and K-W ratios of YbT2Zn20 agree well with the FL picture of the HF ground state. A clear dependence of the ratio on the degeneracy is shown in the inset of Fig. 7 (b), where the and values are taken from Ref. Torikachvili2007 and lines for degeneracies are based on Ref. Tsujii2005 . A Fermi liquid state can also be characterized by the ratio between and the zero temperature limit of Behnia2004 ; Grenzebach2006 ; Zlatic2007 : a “quasi universal” ratio = remains close to = 1 for metals and the sign of depends on the type of carriers. Although for strongly correlated electronic materials like HF systems, a single band and single scattering process is not generally thought to be sufficient for explaining the strong correlation effects, given that and are most sensitive to the position of the heavy band, a quasi universal ratio is expected to hold at low temperatures Miyake2005 ; Kontani2003 .
As shown in Figs 1 and 4, a clear Fermi liquid behavior, , is shown for YFe2Zn20 and YbFe2Zn20. The other compounds in this family reveal a deviation from the linear temperature dependence of TEP within the measured temperature range, where the feature shown in temperature dependence is similar to that of . Since several effects in are included, such as CEF and phonon contribution, vs is compared both at finite temperature and the zero temperature limit (the latter being the same approach used for the majority of HF systems shown in Fig. 1 of Ref. Behnia2004 ). In Fig. 7 (a), at lowest temperature measured vs is plotted, where 0.4 K for T = Fe, Rh, Co and 2 K for T = Ru, Os, Ir, as shown by open symbols. The zero temperature limit of , estimated by simple linear extrapolation of from 2 K (or 0.4 K) to = 0 (solid lines in Fig. 4 (a)), is also plotted (closed symbols in Fig. 7 (a)). Both the zero temperature limit and value at the lowest temperature measured are locating close to the line with = -1.
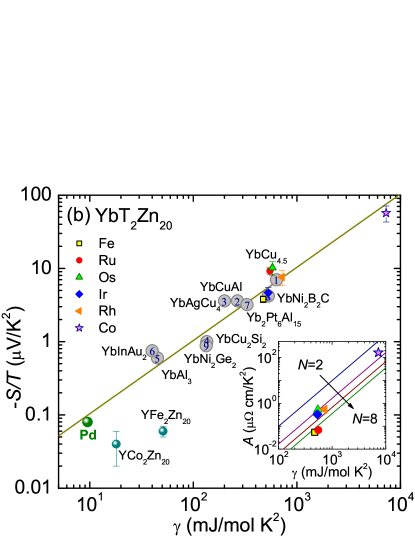
The experimental correlation between the zero temperature limit of and for YbT2Zn20 (T = Fe, Ru, Os, Ir, Rh, and Co) and YT2Zn20 (T = Fe and Co) is presented in Fig. 7 (b). Though error bars cannot be determined exactly from the present data because additional contributions such as phonon and CEF effect in cannot be completely separated, one can use the difference between the base temperature value measured and the extrapolated value to = 0. The error bars in Fig. 7 (b) are based on the difference between the values determined from the base temperature value measured and linear extrapolation to = 0 (other experimental error has not been applied to the error bar in Fig. 7 (b), where the experimental error is smaller than the error bar determined). Given that Fig. 7 (b) is a log-log plot, spanning orders of magnitude, the error bars are of limited concern. For comparison, data for several other Yb-based HF compounds as well as Pd are also plotted in the same figure Behnia2004a . The calculated values of Yb-based compounds vary from -0.77 for T = Fe to -1.4 for T = Rh, which are close to the value = -1, expected for hole-like charge carriers.
As shown in Fig. 7 (b), each Yb-based data point is close to a line represented by = -1 which means that the zero temperature limit of is strongly correlated to due to the enhanced density of state at the Fermi level; the larger density of states at the Fermi level results in a larger and . For YFe2Zn20 and YCo2Zn20, though, the calculated ( -0.1) value is 10 times smaller than that for the free electron case. This can be understood, at least in part, by appreciating the fact that, since the term is not dominated by a huge Yb-contribution, the value should probably be expressed in terms of per-mole-atomic, reduced by a factor of 20. Such a reduction of would place these two data points more or less on the = -1 line.
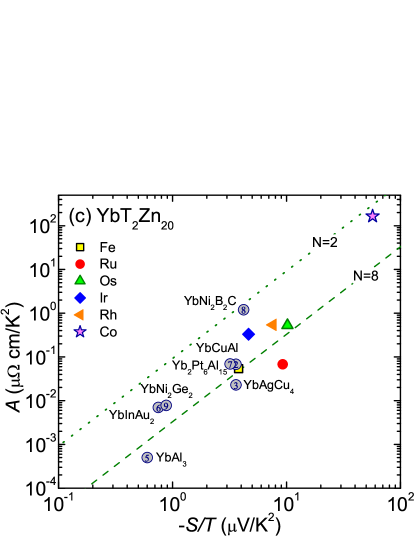
Given the large range of and values found for the YbT2Zn20 compounds we can examine the direct correlation found between and for Yb-based materials. In Fig. 7 (c) data from Ref. Tsujii2003 ; Deppe2008 along with our data for the six YbT2Zn20 compounds are shown. At the grossest level, larger values corresponds to larger values. More quantitatively, in a naive picture, since and , then . In Fig. 7 (c), the dotted and dashed lines are the lines with prefactors appropriate for = 2 and = 8, respectively, discussed for the generalized K-W ratio; = 9.216 104 / cm/K2/(C/mol V/K)2, where = 1.010-5 / cm/(J/molK)2 Tsujii2005 and = -1 Behnia2004 are used. As can be seen, virtually all of the data, for a diverse set of structures, Kondo temperatures, and Yb-content, fall between these two extremes, simultaneously (i) giving some sense that they are capturing the salient correlation between these values and (ii) demanding a more detailed and formal, theoretical examination of the relation between these two transport properties in strongly correlated electron systems.
V Summary
The thermoelectric power measurements on the YbT2Zn20 (T = Fe, Ru, Os, Ir, Rh, and Co) compounds are in agreement with the behavior observed in many heavy fermion Kondo lattice systems. The evolution of the local minimum in and the local maximum (coherence temperature) in with variation of the transition metals can be understood based on the energy scale of Kondo temperature in conjunction with the influence of the crystalline electric field splitting. The large value of in the zero temperature limit can be scaled with the electronic specific heat coefficient, , which is reflected by a strong correlation via the universal ratio and confirms the validity of Fermi-liquid descriptions. In addition, for a wide range of Yb-based materials there is a clear, apparently simple, correlation between and .
Acknowledgements.
This work was supported by the U.S. Department of Energy, Office of Basic Energy Science, Division of Materials Sciences and Engineering. The research was performed at the Ames Laboratory. Ames Laboratory is operated for the U.S. Department of Energy by Iowa State University under Contract No. DE-AC02-07CH11358.References
- (1) A. C. Hewson, Kondo Problem to Heavy Fermion (Cambridge University Press, Cambridge, England, 1993).
- (2) A. K. Bhattacharjee and B. Coqblin, Phys. Rev. B 13, 3441 (1976).
- (3) Y. Lassailly, A. K. Bhattacharjee, and B. Coqblin, Phys. Rev. B 31, 7424 (1985).
- (4) S. Maekawa, S. Kashiba, M. Tachiki, and S. Takahashi, J. Phys. Soc. Jpn. 55, 3194 (1986).
- (5) K. Kadowaki and S. B. Woods, Solid State Commun. 58, 507 (1986).
- (6) K. Miyake, T. Matsuura, and C. M. Varma, Sold State Commun. 71, 1149 (1989).
- (7) N. Tsujii, K. Yoshimura, and K. Kosuge, J. Phys.: Condens. Matter 15, 1993 (2003).
- (8) H. Kontani, J. Phys. Soc. Jpn. 73, 515 (2004).
- (9) N. Tsujii, H. Kontani, and K. Yoshimura, Phys. Rev. Lett. 94, 057201 (2005).
- (10) P. B. Weigman and A. M. Tsvelik, J. Phys. C: Solid State Phys. 16, 2281 (1983), J. Phys. C: Solid State Phys. 16, 2321 (1983).
- (11) A. Auerbach and K. Levin, Phys. Rev. B 34, 3524 (1986).
- (12) P. A. Lee, T. M. Rice, J. W. Serene, L. J. Sham, and J. W. Wilkins, Comments Condens. Matter Phys. 12, 99 (1986).
- (13) K. Behnia, D. Jaccard, and J. Flouquet, J. Phys.: Condens. Matter 16, 5187 (2004).
- (14) V. M. T. Thiede, W. Jeitschko, S. Niemann, and T. Ebel, J. Alloys and Compd. 267, 23 (1998).
- (15) M. S. Torikachvili, S. Jia, E. D. Mun, S. T. Hannahs, R. C. Black, W. K. Neils, D. Martien, S. L. Bud’ko, and P. C. Canfield, Proc. Natl. Acad. Sci. U.S.A. 104, 9960 (2007).
- (16) S. Jia, S. L. Bud’ko, G. D. Samolyuk, and P. C. Canfield, Nat. Phys. 3, 334 (2007).
- (17) P. C. Canfield and Z. Fisk, Philos. Mag. B 65, 1117 (1992).
- (18) P. C. Canfield, Solution growth of intermetallic single crystals: a beginner’s guide (Book Series on Complex Metallic Alloys 2010, 93-111, World Scientific Publishing Co. Pte. Ltd.).
- (19) E. Mun, S. L. Bud’ko, M. S. Torikachvili, and P. C. Canfield, Meas. Sci. Technol. 21, 055104 (2010).
- (20) S. Jia, N. Ni, G. D. Samolyuk, A. Safa-Sefat, K. Dennis, Hyunjin Ko, G. J. Miller, S. L. Bud’ko, and P. C. Canfield, Phys. Rev. B 77, 104408 (2008). Note that the Debye temperatures used in this paper are recalculated; (YFe2Zn20) = 350 K and (YCo2Zn20) = 344 K.
- (21) F. J. Blatt, P. A. Schroeder, C. L. Foiles, and D. Greig, Thermoelectric Power of Metals (Plenum, New York, 1976). F. J. Blatt, A. D. Caplin, C. K. Chiang, and P. A. Schroeder. Solid State Commun. 15, 411 (1974).
- (22) T. Takabatake, E. Matsuoka, S. Narazu, K. Hayashi, S. Morimoto, T. Sasakawa, K. Umeo, and M. Sera, Physica B 383, 93 (2006).
- (23) E. Gratz and A. S. Markosyan, J. Phys.: Condens. Matter 13, R385 (2001).
- (24) C. L. Foiles, J. Appl. Phys. 52, 2217 (1981).
- (25) D. Andreica, K. Alami-Yadri, D. Jaccard, A. Amato, and D. Schenck, Physica B 259-261, 144 (1999).
- (26) M. Deppe, S. Hartmann, M. E. Macovei, N. Oeschler, M. Nicklas, and C. Geibel, New J. Phys. 10, 093017 (2008).
- (27) S. Yoshiuchi, M. Toda, M. Matsushita, S. Yasui, Y. Hirose, M. Ohya, K. Katayama, F. Honda, K. Sugiyama, M. Hagiwara, K. Kindo, T. Takeuchi, E. Yamamoto, Y. Haga, R. Settai, T. Tanaka, Y. Kubo, and Y. Onuki, J. Phys. Soc. Jpn. 78, 123711 (2009).
- (28) E. Mun, unpublished data.
- (29) Eundeok Mun, Ph. D. thesis, Iowa State University. In zero field, the resistivity data for YbT2Zn20 compounds were taken from Ref. Torikachvili2007 . The resistivity data for LuFe2Zn20 and LuCo2Zn20 compounds were taken from: S. Jia, N. Ni, S. L. Bud’ko, and P. C. Canfield, Phys. Rev. B 80, 104403 (2009). The resistivity data for LuT2Zn20 (T = Ru, Os, Ir, and Rh) are unpublished.
- (30) D. Huo, J. Sakurai, O. Maruyama, T. Kuwai, and Y. Isikawa, J. Magn. Magn. Mater. 226-230, 202 (2001).
- (31) H. Wilhelm and D. Jaccard, Phys. Rev. B 69, 214408 (2004).
- (32) U. Köhler, N. Oeschler, F. Steglich, S. Maquilon, and Z. Fisk, Phys. Rev. B 77, 104412 (2008).
- (33) N. E. Bickers, D. L. Cox, and J. W. Wilkins, Phys. Rev. Lett. 54, 230 (1985).
- (34) G. D. Mahan, Phys. Rev. B 56, 11833 (1997).
- (35) V. Zlatić, B. Horvatić, I. Milat, B. Coqblin, G. Czycholl, and C. Grenzebach, Phys. Rev. B 68, 104432 (2003).
- (36) V. Zlatić and R. Monnier, Phys. Rev. B 71, 165109 (2005).
- (37) E. H. Sondheimer, Proc. R. Soc. Lond. A 193, 484 (1948).
- (38) C. Grenzebach, F. B. Anders, Gerd Czycholl, and T. Pruschke, Phys. Rev. B 74, 195119 (2006).
- (39) V. Zlatić, R. Monnier, J. K. Freericks, and K. W. Becker, Phys. Rev. B 76, 085122 (2007).
- (40) K. Miyake and H. Kohno, J. Phys. Soc. Jpn. 74, 254 (2005).
- (41) H. Kontani, Phys. Rev. B 67, 014408 (2003).
- (42) The zero temperature limit of and for YbCuAl, YbInAu2, YbAl3, YbCu2Si2, YbAgCu4, and YbCu4.5 are taken from the table of Ref. Behnia2004 . and of Yb2Pt6Al15 are taken from Ref. Deppe2008 . value of YbNi2B2C and YbNi2Ge2 are taken from Ref. Li2006 and Ref. Budko1999 , respectively. The TEP data of YbNi2B2C and YbNi2Ge2 are taken from Ref. Mun2010a .
- (43) S. Li, M. C. De Andrade, E. J. Freeman, C. Sirvent, R. P. Dickey, A. Amann, N. A. Frederick, K. D. D. Rathnayaka, D. G. Naugle, S. L. Bud’ko, P. C. Canfield, W. P. Beyermann, M. B. Maple, Philos. Mag. B 86, 3021 (2006).
- (44) S. L. Bud’ko, Z. Islam, T. A. Wiener, I. R. Fisher, A. H. Lacerda, P. C. Canfield, J. Magn. Magn. Mater. 205, 53 (1999).