Tuning Low Temperature Physical Properties of CeNiGe3 by Magnetic Field.
Abstract
We have studied the thermal, magnetic, and electrical properties of the ternary intermetallic system CeNiGe3 by means of specific heat, magnetization, and resistivity measurements. The specific heat data, together with the anisotropic magnetic susceptibility, was analyzed on the basis of the point charge model of crystalline electric field. The = 5/2 multiplet of the Ce3+ is split by the crystalline electric field (CEF) into three Kramers doublets, where the second and third doublet are separated from the first (ground state) doublet by 100 K and 170 K, respectively. In zero field CeNiGe3 exhibits an antiferromangeic order below = 5.0 K. For H a two metamagnetic transitions are clearly evidenced between 2 4 K from the magnetization isotherm and extended down to 0.4 K from the magnetoresistance measurements. For H a, shifts to lower temperature as magnetic field increases, and ultimately disappears at 32.5 kOe. For , the electrical resistivity shows the quadratic temperature dependence (). For , an unconventional -dependence of with emerges, the exponent becomes larger as magnetic field increases. Although the antiferromagnetic phase transition temperature in CeNiGe3 can be continuously suppressed to zero, it provides an example of field tuning that does not match current simple models of Quantum criticality.
pacs:
75.30.Kz, 75.30.Mb, 75.50.EeI introduction
The ground state of Ce-based intermetallic compounds is often determined by a competition between the intersite Ruderman-Kittel-Kasuya-Yosida (RKKY) interaction and the onsite Kondo fluctuation, a competition that leads to a plethora of unusual ground states. Depending on the strength of the hybridization between 4 and conduction electrons relative to their coupling strength, the ground states broadly occur either as magnetically ordered or nonmagnetic (paramagnetic). In addition to these two interactions, the crystalline electric field (CEF) plays a significant role in determining the temperature-dependent thermodynamic and transport properties. With increasing hybridization, the magnetic moments associated with localized 4 electrons are increasingly screened by the conduction electrons, leading to a reduction of magnetic moments Hewson . The strength of the hybridization can be varied by suitable control parameters, such as pressure (), composition (), and magnetic field (). A quantum critical point (QCP) can be approached by tuning the second order phase transition temperature down toward 0 K with an external, non-thermal, control parameters (, , ) Stewart ; Lohneysen . Of these three parameters, magnetic field is often considered to be an ideal control parameter, since it can be reversibly, and continuously, used to tune the system towards the QCP. Many antiferromagnetic (AFM) heavy fermion (HF) compounds with field-induced QCP have been identified and exhibit prominent non-Fermi liquid (nFL) behavior expanding out (to higher temperature) from the QCP, triggered by quantum fluctuations Gegenwart ; Custers ; Balicas ; Budko1 ; Niklowitz ; Tokiwa .
CeNiGe3 has been studied and identified as an AFM Kondo system Pikul . Strong anisotropy in thermodynamic and transport properties can be expected from the crystal structure; CeNiGe3 crystallizes in the orthorhombic SmNiGe3-type structure (, No 65) with lattice parameters = 4.139 Å, = 21.828 Å, and = 4.1723 Å Pikul ; Bodak . A layered structure, CeNiGe3 is assembled by a sequence Ge2Ni-CeGe2Ce-NiGe2 layers along the b-axis Pikul ; Hyunjin . In this structure, Ce occupies a single 4-site with point symmetry. At ambient pressure and in zero field, CeNiGe3 shows AFM order below = 5.5 K Pikul ; Nakashima ; Kotegawa ; Tateiwa . Recent studies of polycrystalline CeNiGe3 Pikul have inferred that the AFM order can be suppressed by external magnetic field, via metamagnetic transitions (MMT). Although polycrystalline samples can show intrinsic property of materials with directional averaged value, single crystals are needed for reliable phase diagrams of magnetically anisotropic compounds. More recently, pressure-induced superconductivity was found in electrical resistivity measurements on polycrystalline samples Nakashima ; Kotegawa and in specific heat (ac calorimetry) measurements on single crystal samples Tateiwa . These studies indicate that the RKKY and/or Kondo interaction can be tuned by applied pressure and superconductivity can be induced in this Kondo system.
In order to gain insight into the anisotropic, low-temperature physical properties of CeNiGe3, we have grown single crystals and performed thermodynamic and transport measurements in applied magnetic fields up to 90 kOe. In this paper specific heat, electrical resistivity, and magnetization measurements on single crystal CeNiGe3 as function of temperature and magnetic field are presented. A strong magnetic anisotropy is observed and can be reproduced by CEF analysis, and two-step MMTs are clearly observed in the magnetization isotherms and magnetoresistance data. The constructed phase diagram of CeNiGe3, for applied magnetic field along the magnetically easy axis, H a, is qualitatively in agreement with a previous polycrystalline sample study Pikul , and is also similar to the case of CeAuSb2 Balicas and the isostructural compound YbNiSi3 Budko in which the AFM order is also suppressed by applied magnetic field via MMTs.
II Experimental
Single crystals of NiGe3 ( = Ce and Y) were grown via solution growth techniques from a Ni-Ge rich, self-flux using high purity starting elements Fisk ; Canfield1 ; Canfield2 . A Ni-Ge rich self-flux was used because of both the wide range of binary eutectic valley and the merit of introducing no new elements in the growth. The constituent elements, using a starting molar proportion of 1 : 1.6 : 9 ( : Ni : Ge), were placed in an alumina crucible and sealed in a silica tube under a partial pressure of Ar. The temperature of the furnace was raised to 1050 C and after homogenizing the mixture for 2 hours, the melt solution was slowly cooled over 100 hours down to 780 C for Ce, 850 C for Y. After decanting the excess solution, using a centrifuge, thin, plate-like crystals were obtained. Samples have shiny, and generally clean, surfaces; small, spot-like, flux droplets solidified on the crystal surface were polished off before physical property measurements.
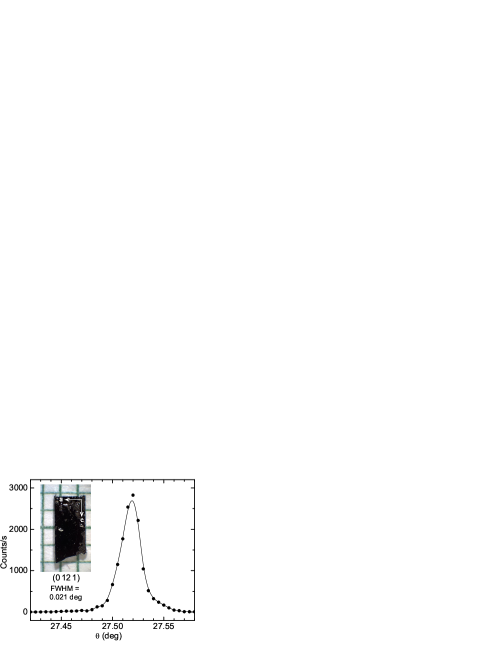
The crystallographic b-axis was found to be perpendicular to the plate surface and well formed a-c edge facets were clearly visible (Fig. 1). The orthorhombic b-axis was easily determined to be perpendicular to the plate surface by x-ray Laue pattern in reflection geometry. The orthorhombic a and c direction have been assigned by measurements of the lattice parameters using a four-circle diffractometer with Cu- radiation from a rotating anode x-ray source, selected by a germanium (1 1 1) monochromator. To confirm correct assignment, the reflection conditions according to the space group has been satisfactory checked: the (0 12 1) and (0 14 1) reflections have been found in contrast to the observation of pure background signal at what would be the (0 13 1) position, in agreement with the general reflection condition + = 2 = even for ( ) Bragg reflections. The high quality of the single crystals can be demonstrated by the excellent mosaicity of 0.021 deg. in full width half maximum for the rocking scan shown in Fig. 1.
Powder x-ray diffraction measurements were taken on a Rigaku MiniFlex at room temperature with Cu- radiation in order to confirm the crystal structure and lattice parameters. We prepared two powder samples of the NiGe3 ( = Ce and Y) compounds, the first one was for confirming the crystal structure and phase purity, the second one, which was mixed with Si-reference powder for correcting zero shift, was for determining the lattice constants. No secondary phases were detected, except small amount of pure Ge phase coming from residual flux droplets on the crystal surface. After polishing the surface of the samples before grinding, the Ge peaks in the x-ray spectra were no longer present. The refined lattice constants ( = 4.1384 Å, = 21.838 Å, and = 4.1695 Å for CeNiGe3 and = 4.0543 Å, = 21.520 Å, and = 4.0617 Å for YNiGe3) are consistent with the earlier studies Pikul ; Bodak . The structure type, space group, atomic position, and lattice constants of the single crystals of CeNiGe3 and YNiGe3 were also confirmed by single crystal x-ray measurements Hyunjin .
Magnetization was measured as a function of temperature from 1.8 to 300 K and magnetic fields up to 70 kOe in a Quantum Design (QD) Magnetic Property Measurement System (MPMS). Heat capacity was measured in a QD Physical Property Measurement System (PPMS) with 3He option by the relaxation method within the temperature range from 0.4 to 50 K. Electrical resistivity was measured using a standard 4-probe ac ( = 16 Hz) technique in a QD PPMS down to 0.4 K. The plate like samples were cut with a wire-saw (and polished) for resistivity measurements. Electrical contacts were made to the sample using Epotek H20E silver epoxy to attach Pt wires (50 m diameter). The magnetic field-dependent resistivity was measured in transverse ((I c) (H a)) configuration for applied fields up to 90 kOe.
III Results
III.1 Magnetic susceptibility
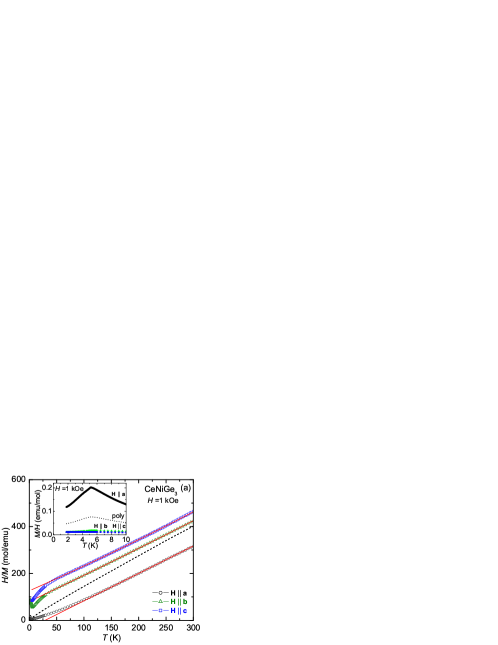
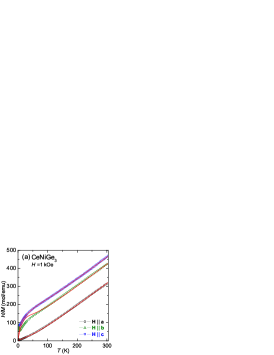
The temperature-dependent magnetic susceptibility ( = ) and inverse magnetic susceptibility, = 1 kOe, along each principal axis are plotted in Fig. 2 (a). for H a, which is the magnetic easy axis, shows a sharp peak as a signature of the AFM order. curves for H b and c are much smaller than that for H a. for each principal axis follows Curie-Weiss law () above 150 K.
The strong magnetic anisotropy is also reflected in the anisotropic Weiss temperature ( = 28 K, = -60 K, and = -123 K). Even though the crystal structure of CeNiGe3 appears to be “almost tetragonal” with and differing by less than 1%, the large difference of between magnetic easy and hard axes results from point symmetry of the Ce site. From the polycrystalline averaged susceptibility for H a, H b, and H c, (dashed line in Fig. 2 (a)), the effective moment = 2.57 /Ce3+ and the Weiss temperature = -21 K were obtained by fitting the data to the Curie-Weiss law. The inferred effective moment is close to the full Hund’s rule (=5/2) ground-state value, 2.54 . deviates from the Curie-Weiss law below 150 K in a manner which suggests that degeneracy of the = 5/2 of Ce3+ manifold is lifted by CEF (see CEF analysis below).
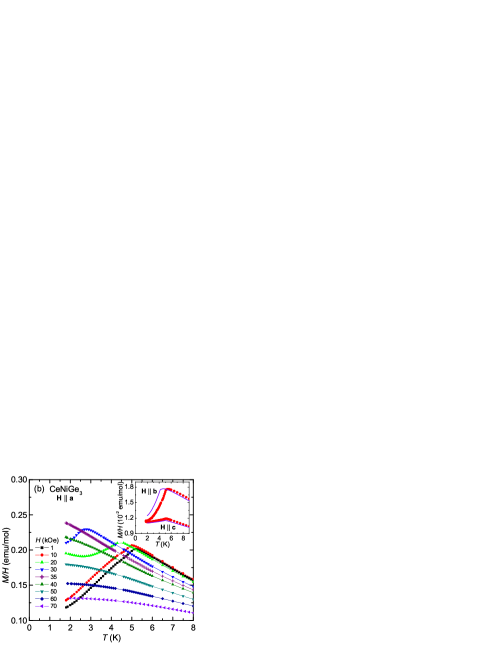
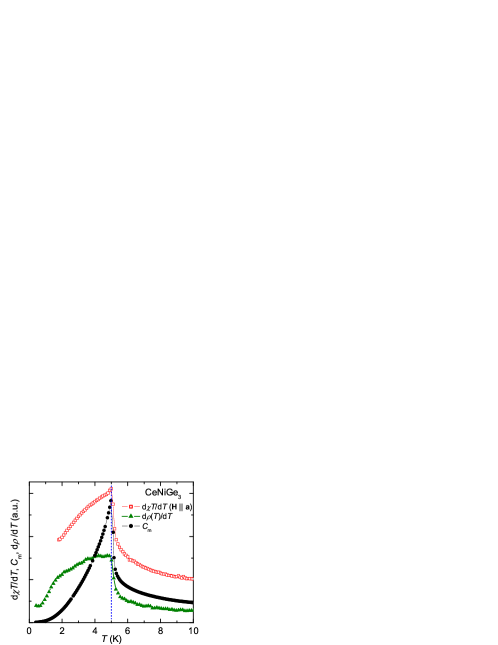
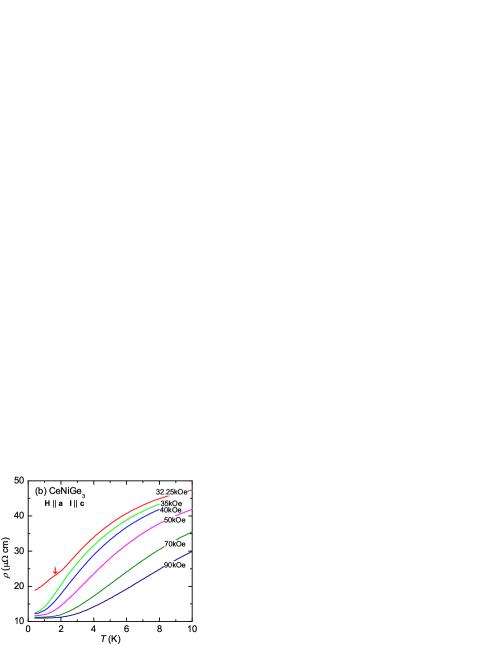
The low field, AFM ordering temperature = 5.0 K was determined from the maximum of d/d as shown in Fig. 3 Fisher ; Fisher1 , which is consistent with the peak position of specific heat data. The determined AFM ordering temperature is lower than the previously reported value = 5.5 K Pikul ; Nakashima ; Kotegawa ; Tateiwa . The low-temperature data, measured for H a, are plotted for various applied fields in Fig. 2 (b). With increasing magnetic field, shifts to lower temperatures and drops below 2 K for 35 kOe. At higher fields, does not reveal any signature of phase transitions and instead shows a tendency toward saturation at low temperatures. For H b and H c, however, is hardly affected by applied magnetic field as shown in the inset of Fig. 3; at = 70 kOe, from the maximum of d/d, the determined AFM ordering temperature shifts to = 4.1 K for H b and = 4.9 K for H c.
III.2 Specific heat
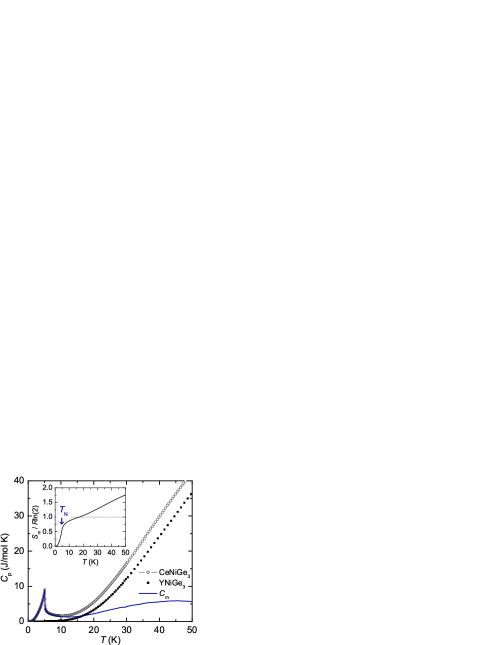
Figure 4 shows the temperature-dependent specific heat of CeNiGe3 and its nonmagnetic, isostructural analogue, YNiGe3. There is a large difference in between CeNiGe3 and YNiGe3 below 50 K measured. For YNiGe3 the electronic specific heat coefficient () and Debye temperature () were estimated using the relation = + by plotting data vs. ; = 3.6 mJ/molK2 and = 236 K. The specific heat data for CeNiGe3 manifests a clear, sharp, -anomaly with a cusp at 5.0 K (see Figs. 4 and 5). Because of the AFM order below 5 K and the high temperature, broad feature associated with CEF effect, and of CeNiGe3 can not estimated by using the same relation. of CeNiGe3 attained a value of 76 mJ/molK2 at 0.4 K, which is larger than that of YNiGe3. The data for YNiGe3 are used to estimate the non magnetic contribution to the specific heat of CeNiGe3, where we used a mass corrected data Bouvier ; Blanco for YNiGe3 to subtract from the data for CeNiGe3. The magnetic specific heat of CeNiGe3, = (CeNiGe3) - (YNiGe3), is also plotted in Fig. 4. The data show a broad maximum centered around 45 K, indicating that there is a significant magnetic contribution from Ce3+ ions above . This broad peak can be associated with an electronic Schottky contribution due to the CEF splitting of the Hund’s rule ground state multiplet.
The magnetic entropy () was inferred by integrating starting from the lowest temperature measured and plotted in the inset of Fig. 4. reaches about 60% of ln(2) at and recovers the full doublet, ln(2), entropy by 18 K. This suggests that the sharp anomaly at 5.0 K in specific heat stems from the AFM order in a doublet ground state but the ordered moment is already somewhat compensated by the Kondo interaction. At = 50 K, the recovered is less than ln(4), which suggests that the first and second excited doublets are separated by more than 50 K from the ground state doublet.
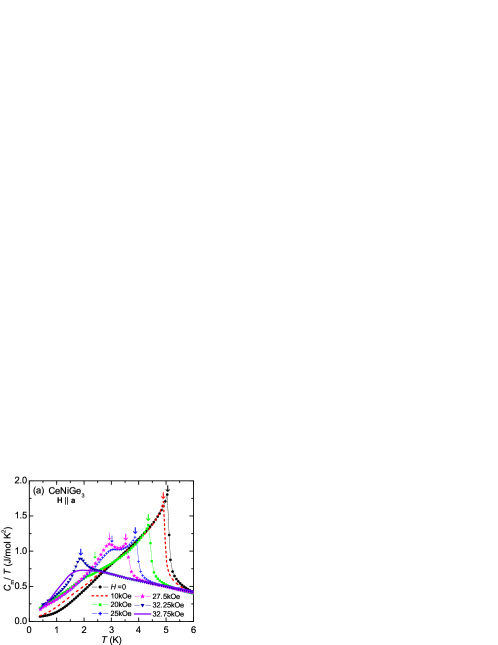
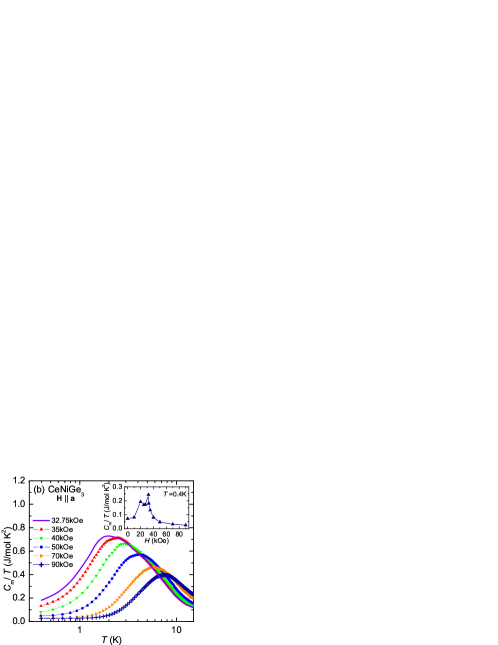
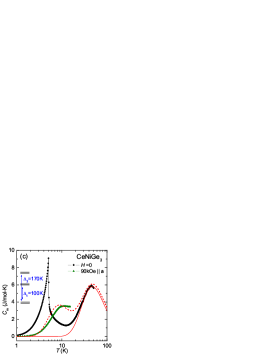
In order to examine the effect of an applied magnetic field on the AFM order, the specific heat was measured with H a up to 90 kOe and is plotted as vs. in Fig. 5. A shift of to lower temperatures is seen for 32.5 kOe and a second, lower temperature, cusp consistent with a second phase transition is observed in the data for 20 kOe 32.25 kOe. The position of the low-temperature cusp for = 20 kOe can be related to the broad minimum developed in (Fig. 2 (b)). For 32.75 kOe the magnetic phase transitions are suppressed and instead exhibits a broad maximum centered at 2 K, which marks a cross-over from the AFM to paramagnetic state associated with Brillouin-like saturation of the moments. At higher fields, this maximum broadens further and moves to higher temperatures as shown in Fig. 5 (b), indicating that the magnetic entropy is removed at higher temperature for larger applied fields. Such a behavior has been found in Kondo lattice systems under magnetic fields and can be reasonably reproduced within the Kondo resonance-level model Schotte combined with CEF effect. Note that displays no clear indication of a low temperature -log(), nFL-like behavior Stewart ; Lohneysen for any of the fields measured. For = 32.75 kOe, has such a temperature dependence over only a limited temperature range, between 2.5 and 5.5 K. The electronic specific heat coefficient , reflecting the effective mass of 4 electrons, as given by for 0, drops quickly as magnetic field increases. Although at low fields, because of the AFM order, cannot be formally defined as , at 0.4 K is displayed as a function of field in the inset of Fig. 5 (b), to provide an estimated of . In the paramagnetic state the estimated values are less than 0.2 J/moleK2. Hence, the strength of the hybridization between 4 and conduction electrons in CeNiGe3 is relatively weak ( electrons in CeNiGe3 are localized) and it can be destroyed easily by the application of magnetic field, which is evidenced by the value = 25 mJ/moleK2 for = 90 kOe.
III.3 Resistivity
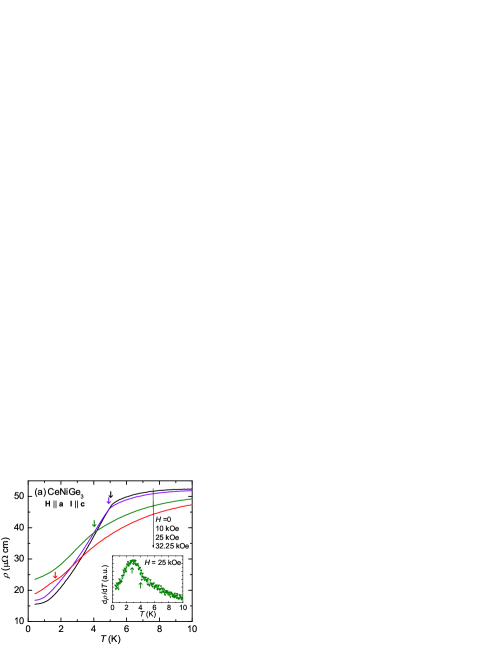
The temperature-dependent resistivity data () of CeNiGe3 are shown in Fig. 6 down to 0.4 K in zero field. There are two broad features in around at 10 K and 100 K, the lower one being primarily related to Kondo scattering and the higher one primarily being associated with thermal population of CEF levels. The inset of Fig. 6 shows the zero field below 15 K, together with 90 kOe data for magnetic field H a. The AFM transition manifests itself as a precipitous drop in for .
From the results of our thermodynamic and transport measurements, the AFM ordering temperature can be clearly determined in , , and . Figure 3 shows d/d, , and d/d curves Fisher ; Fisher1 . There is an excellent agreement among d/d = 5.0(0) K, = 4.9(7) K, and d/d = 4.9(4) K. The same analysis to determine phase transition temperatures has been applied to more complex and/or local moment system such as Ni2B2C ( = Dy and Ho) Ribeiro and shows that the reliable phase transition temperatures can be obtained from thermodynamic and transport measurements.
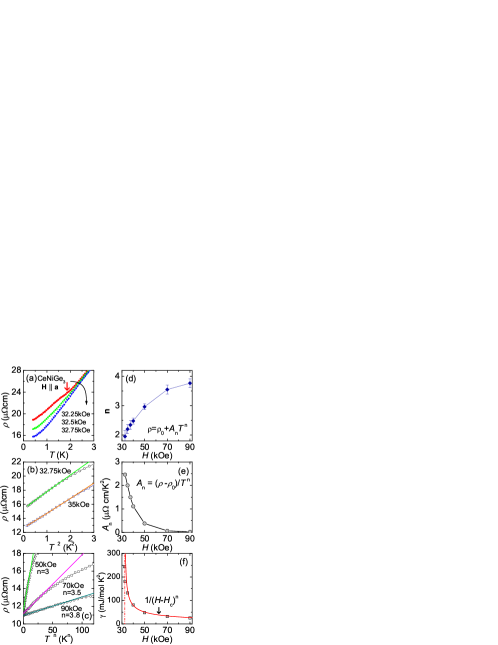
As magnetic field increases, a gradual suppression of AFM order is observed in . The determined AFM phase transition temperatures from d/d are indicated by arrows in Fig. 7 (a). The low-temperature for intermediate fields, for instance = 32.25 kOe data, reveals more scattering at the phase transition temperature than that in zero field which shows a sharp drop due to loss of spin disorder scattering. The inset of Fig. 7 (a) shows the d/d curve for = 25 kOe in which two anomalies can be seen around 2.8 K as a maximum and 3.9 K as a slope change. These temperatures are consistent with the cusp and sharp peak position developed in (Fig. 5). At higher fields, FL behavior () is found over a limited range of temperature and field. At very low temperatures and high fields, becomes flat, revealing an anomalous -dependence with .
III.4 Magnetization and Magnetoresistance
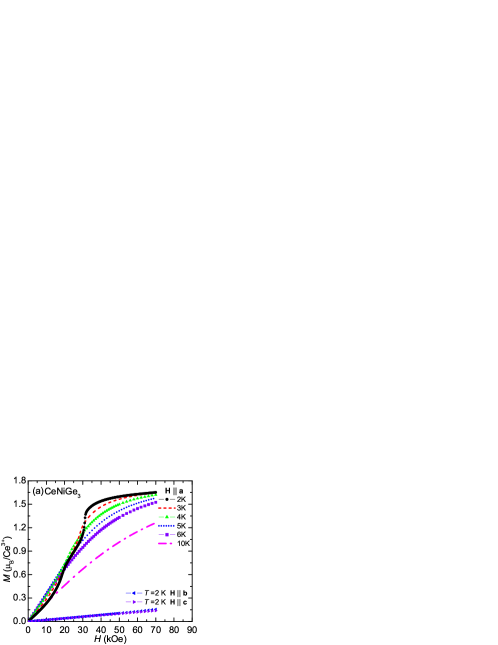
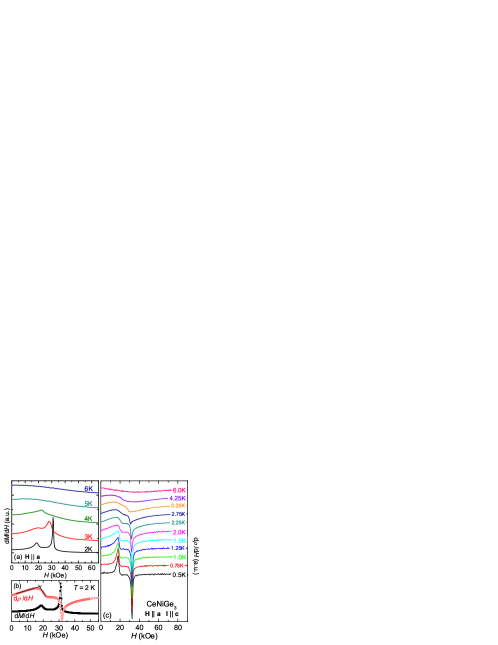
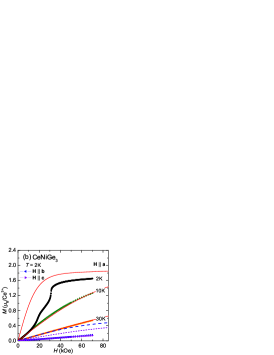
The magnetic field-dependent magnetization () and resistivity () shed further light on the low-temperature magnetic states of CeNiGe3, as shown in Fig. 8. The observed magnetization isotherms at 2 K are highly anisotropic between H a and in the bc-plane as seen in Fig. 8 (a). At 2 K, for H b and H c increases almost linearly up to about 0.15 /Ce3+ at 70 kOe. On the other hand, along H a linearly increases below 10 kOe and then, undergoes two MMTs and appears to be approaching saturation at 70 kOe with a moment of about 1.65 /Ce3+. This value is much higher, by factor of 4, than in the previous polycrystalline sample study Pikul but lower than the theoretical value of 2.14 for the saturated moment of free Ce3+ ions. This increase in takes place via two MMTs at 18.5 and 31 kOe, which are seen as steps in and also clearly indicated in the d/d analysis. Figure 9 (a) shows d/d at selected temperatures. Two peaks in d/d curves, corresponding to MMTs, are no longer seen for 5 K. For H b and H c, no MMTs are observed below 70 kOe and down to 2 K.
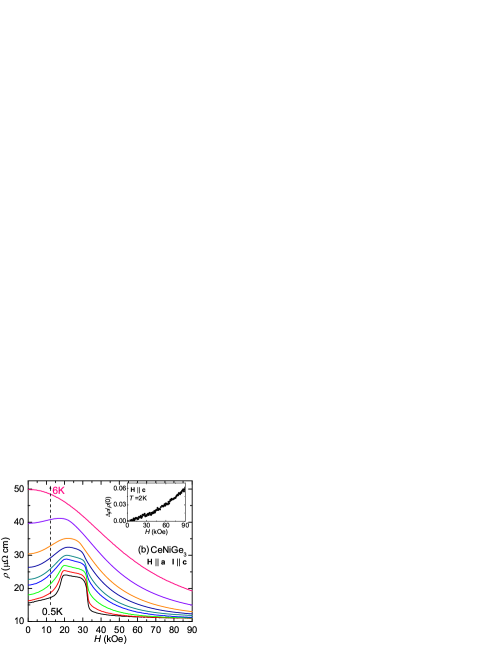
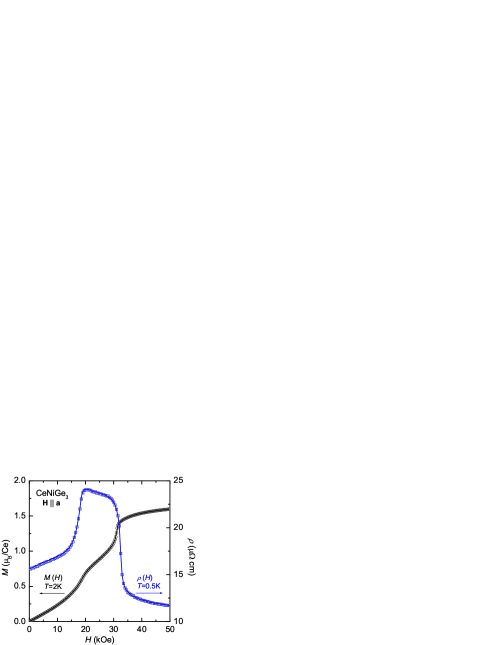
measurements provide orthogonal cuts through the phase diagram and shed light on some of the features observed in . Figure 8 (b) presents for H a below 6 K. Dramatic changes in for 4.25 K reveal the two MMTs, while a monotonically decreasing is seen in the 6 K curve up to 90 kOe. Two MMTs are clearly revealed in the d/d curve as sharp peaks. For comparison d/d and d/d curve at 2 K is plotted in Figure 9 (b). Two MMTs fields revealed at 18 and 31.5 kOe in d/d are in agreement with the features developed at 18.5 kOe and 31 kOe in d/d. Below 2 K two MMTs are almost temperature independent, while above 2 K the second MMT shifts to lower field as temperature increases. Note that the pronounced steps in were not observed in the polycrystalline sample study Pikul . Magnetization at = 2 K and magnetoresistivity vs. field loops from 0 to 50 kOe at = 0.5 K are shown in Fig. 10. Although CeNiGe3 show sharp MMTs, indicates no hysteresis down to 2 K and no hysteresis is seen in measurements at 0.5 K. In the inset of Fig. 8 (b) for H c at 2 K is plotted as (0) vs. . As magnetic field increases increases monotonically without step-like change shown for H a, which is consistent with results for H c. Below , the observed magnetoresistance (MR) in CeNiGe3 is very similar to that in a tetragonal CeAuSb2 Balicas and a isostructural YbNiSi3 Budko .
IV Discussion
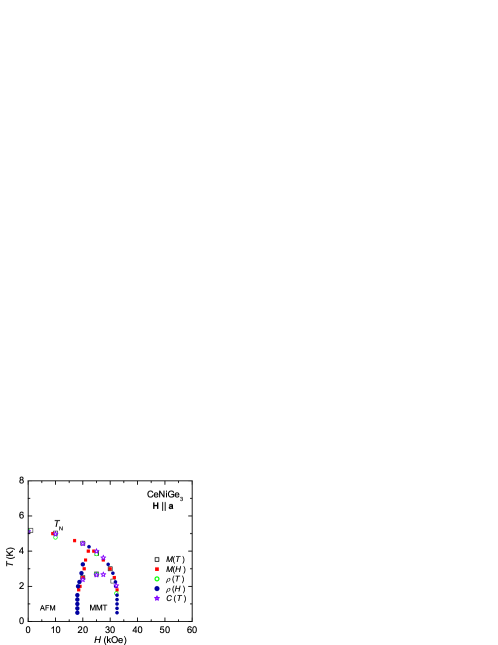
In Fig. 11 the phase transition temperatures and fields determined from magnetization, resistivity, and specific heat measurements are plotted in the plane, where symbols are extracted from d/d, d/d, d/d, d/d analysis, and maximum of . The phase transition can be traced by a line which is connected from = 5.0 K at = 0 to the critical field = 32.5 kOe at = 0.5 K. An additional phase boundary emerges below 4 K around 22 kOe. This phase boundary depends weakly on field. Between these two phase boundaries (20 kOe 30 kOe), a nearly temperature-independent phase line seems to exist, which corresponds to the low-temperature cusp observed in (Fig. 5) and the maximum in d/d. At present, it is not clear the low-temperature cusp in is a indication of phase transition or is associated with a excitation of spin wave. As shown in the phase diagram the critical temperature determined from temperature sweeps track well the critical field determined from field sweeps.
gradually shifts to lower temperature in applied fields up to 30 kOe. It then decreases quickly and seems to be zero near 32.5 kOe. In spite of the abrupt changes in the slope of , no hysteresis was observed at . Above the saturated paramagnetic state with near fully saturated moment is induced. Since a pronounced drop of the resistivity at sharpens as temperature decrease, the transition associated with the MMT may well be first order below 0.4 K. In Ref. Pikul the phase diagram based on polycrystalline samples indicates three distinct magnetic phase boundaries. The two phase boundaries between regions I, II, and III in Ref. Pikul are consistent with the phase lines for H a in this study. However, the third phase boundary between region III and paramagnetic phase in Ref. Pikul is not present in Fig. 11. From a simple point of view, since CeNiGe3 is highly magnetically anisotropic, the third phase boundary seen in the polycrystalline samples may primarily reflect that for the magnetic hard axes b or c. We have been measured for magnetic field applied along magnetic hard axes (see Fig. 2). For = 70 kOe, reveals a shift of the AFM ordering temperature from 5.0 to 4.2 K for H b and to 4.9 K for H c, which is close to the third phase boundary in Ref. Pikul . The constructed phase diagram for H a is qualitatively in agreement with the phase diagram from previous polycrystalline sample study Pikul . Hence, although polycrystalline samples can show intrinsic property of materials with directional averaged value, single crystals are needed for reliable phase diagrams of magnetically anisotropic compounds.
CeNiGe3 manifests a large magnetic anisotropy and the specific heat shows a broad peak centered around 45 K in zero field, both of which are presumably associated with the CEF splitting of the Ce Hund’s rule ground state multiplet. In order to better understand the salient energy scales for this system, these data were analyzed on the basis of the CEF (point charge) model. The CEF Hamiltonian for the Ce3+ ion (=5/2) in orthorhombic point symmetry, can be written as = + + + + . Where and are Steven’s operators and crystal field parameters, respectively Stevens ; Hutchings . In the paramagnetic state, the magnetic properties of the material are determined by CEF plus Zeeman interaction ( = ), thus the total Hamiltonian was used for the analysis of the present data.
The CEF parameters were determined by reproducing the measured specific heat, magnetic susceptiblity, and magnetization isotherms with calculated curves shown as solid line in Fig. 12. The obtained CEF parameters and the CEF level scheme are summarized in Table 1 and the zero field energy level scheme is shown in Fig. 12 (c). In the paramagnetic state, and are satisfactorily reproduced by the calculated values as shown in Figs. 12 (a) and (b). Although data at 2 K are not exactly reproduced, the anisotropy between H a and H b and c is reasonable. The two MMTs, of course, are not captured by single ion, CEF effect. Thus, in addition to the CEF effect, other interactions should be taken into consideration to reproduce the MMT behavior in CeNiGe3. In similar manner, the magnetic ordering seen as a -like anomaly in the zero field is not captured in the CEF model, but the high field splitting of the ground state doublet is. At high temperatures is well reproduced by the CEF model as shown in Fig. 12 (c). The energy level splitting = 100 K from the ground state doublet to the first excited doublet is consistent with the entropy change shown in Fig. 4. Furthermore, for = 90 kOe, the low temperature broad peak is reproduced, giving rise to a split of ground state double via Zeeman interaction.
Turning now to the low temperature resistivity, it is expected that FL behavior should be recovered for . Figure 13 shows that, for selected magnetic fields, for CeNiGe3 varies as = + , with below 2 K. The vertical arrow in Fig. 13 (a) indicates the onset of AFM order, below which a small enhancement of is observed rather than a drop due to the loss of spin disorder scattering. As magnetic field increase from 32.25 to 32.75 kOe the AFM order is fully suppressed. In the vicinity of the AFM to PM phase boundary a quadratic temperature dependence in emerges (see Fig. 13 (b)). A FL behavior, , is obtained just above , but only over a limited range of temperature and magnetic field. At low temperatures, , displays an anomalous dependence with 2, indicative of deviation from FL behavior, as shown in Fig. 13 (c). This suggests that an additional scattering mechanism in needs to be considered in the saturated paramagnetic (spin polarized) states. The exponent, , gradually increases as magnetic field increases, reaching = 3.8 at = 90 kOe (Fig. 13 (d)), where the coefficient, = ()/, corresponding to each is plotted in Fig. 13 (e). The value quickly drops with increasing magnetic fields for .
In general, when , tuned by external magnetic field, is suppressed to , pronounced nFL properties are observed in the vicinity of QCP in HF AFM systems such as YbRh2Si2 Gegenwart ; Custers , CeAuSb2 Balicas , YbAgGe Budko1 ; Niklowitz ; Tokiwa . For CeNiGe3 there is no clear indication of nFL behavior, with 2 and -log(), in the vicinity of down to 0.4 K. Therefore, although the AFM order in CeNiGe3 can be suppressed by an applied magnetic field, a classical QCP is not obtained as . This may arise due to a weak hybridization between 4 and conduction electrons and the possible first order nature of this phase transition for 0.4 K and , i.e. Ce in this system is much more local moment like and the phase diagram is closer to non-hybridizing rare-earth such as AgSb2 or AgGe system ( = rare-earth) Myers ; Morosan . For many field tuned QCP systems Gegenwart ; Balicas ; Lohneysen , when approaching the QCP from the paramagnetic state, the coefficient of the -dependence of resistivity has a 1/ scaling form, where is the critical field and is the exponent. Since of CeNiGe3 shows a -dependence only over a limited temperature and field range, this scaling property can not tested in this system. Interestingly, however, a 1/ divergence for is observed from the field dependence of at 0.4 K. The solid line in Fig. 13 (f) represents a fit of the scaling form performed for 35 kOe with = 32.5 0.5 kOe and = 0.52 0.1, implying a divergence of the quasi-particle mass approaching . By assuming Kadowaki holds in the paramagentic state, this implies that the field dependence can show a singular scattering near following 1/. In order to address this issue, it will be necessary to measure the resisitivity below 0.4 K. It is interesting to note that the 2 deviation from FL behavior is also seen in CeAuSb2 Balicas and YbNiSi3 Budko . Both compounds show very similar phase diagrams with two MMTs, emerging when is lowered by applied magnetic field. The observed MR response through the MMTs is also quite similar. The anomalous metallic behavior in the saturated paramagnetic state induced by magnetic field is reflected by dependence for CeAuSb2 and with 2 for YbNiSi3 at low temperatures.
V Summary
We have studied the thermal, magnetic, and electrical properties of the single crystals of CeNiGe3 by means of the specific heat, magnetization, and electrical resistivity. CeNiGe3 manifest a large magnetic anisotropy with the crystallographic a-axis being the magnetic easy axis. In the paramagnetic phase, the observed behavior can be well explained by the CEF effect with an 100 K splitting between the ground state doublet and the first excite state. The low-temperature physical properties manifest strong magnetic field dependencies. The constructed phase diagram indicates that the AFM order can be suppressed by magnetic field of = 32.5 kOe to = 0 through MMT. No clear indication of nFL behavior was observed in the vicinity of the . A FL behavior close to the is found over a limited range of temperature and magnetic field. At higher fields an anomalous temperature dependence of the resistivity was observed.
Acknowledgements.
We would like to thank Hyunjin Ko for single crystal x-ray measurements. Work at Ames Laboratory was supported by the Basic Energy Sciences, U.S. Department of Energy under Contract No. DE-AC02-07CH11358.References
- (1) A. C. Hewson, The Kondo Problem to Heavy Fermions (Cambridge: Cambridge University Press, 1993).
- (2) See for example: G. R. Stewart, Rev. Mod. Phys. 78, 743 (2006), Rev. Mod. Phys. 73, 797 (2001).
- (3) H. v. Löhneysen, A. Rosch, M. Vojta, and P. Wölfle, Rev. Mod. Phys. 79, 1015 (2007).
- (4) P. Gegenwart, J. Custers, C. Geibel, K. Neumaier, T. Tayama, K. Tenya, O. Trovarelli, and F. Steglich, Phys. Rev. Lett. 89, 056402 (2002).
- (5) J. Custers, P. Gegenwart, H. Wilhelm, K. Neumaier, Y. Tokiwa, O. Trovarelli, C. Geibel, F. Steglich, C. Pépin, and P. Coleman, Nature (London) 424, 524 (2003).
- (6) L. Balicas, S. Nakatsuji, H. Lee, P. Schlottmann, T. P. Murphy, and Z. Fisk, Phys. Rev. B 72, 064422 (2005).
- (7) S. L. Bud’ko, E. Morosan, and P. C. Canfield, Phys. Rev. B 69, 014415 (2004).
- (8) P. G. Niklowitz, G. Knebel, J. Flouquet, S. L. Bud’ko, and P. C. Canfield, Phys. Rev. B 73, 125101 (2006).
- (9) Y. Tokiwa, A. Pikul, P. Gegenwart, F. Steglich, S. L. Bud’ko and P. C. Canfield, Phys. Rev. B 73, 094435 (2006).
- (10) A. P. Pikul, D. Kaczorowski, T. Plackowski, A. Czopnik, H. Michor, E. Bauer, G. Hilscher, P. Rogl, and Yu. Grin, Phys. Rev. B 67, 224417(2003).
- (11) O. I. Bodak, V. K. Pecharskii, O. Ya. Mruz, V. E. Zavodnik, G. M. Vitvitskaya, and P.S. Salamakha, Dopovidi Akademii Nauk Ukrains’koi RSR, Seriya B: Geologichni, Khimichni ta Biologichni Nauki 2, 36-8 (1985).
- (12) Hyunjin Ko, Ph.D. thesis, Structural and electronic investigations of complex intermetallic compounds (Iowa State University, AAT 3316228, 2008). Available online through library at Iowa State University (www.lib.iastate.edu).
- (13) M. Nakashima, K. Tabata, A. Thamizhavel, T. C. Kobayashi, M. Hedo, Y. Uwatoko, K. Shimizu, R. Settai, Y. Ōnuki: J. Phys.: Condens. Matter. 16 L255 (2004).
- (14) H. Kotegawa, K. Takeda, T. Miyoshi, S. Fukushima, H. Hidaka, T. C. Kobayashi, T. Akazawa, Y. Ohishi, M. Nakashima, A. Thamizhave, R. Settai, and Y. Ōnuki, J. Phys. Soc. Jpn. 75, 044713 (2006).
- (15) N. Tateiwa, Y. Haga, T. D. Matsuda, S. Ikeda, M. Nakashima, A. Thamizhavel, R. Settai, and Y. Ōnuki, J. Phys. Soc. Jpn. 75, Suppl. 174 (2006).
- (16) S. L. Bud’ko, P. C. Canfield, M. A. Avila, and T. Takabatake, Phys. Rev. B 75, 094433 (2007).
- (17) Z. Fisk, J. P. Remeika, in: K. A. Gschneidner and L.R. Eyring (Eds.), Handbook of Physics and Chemistry of Rare Earths, Vol. 12, North-Holland, Amsterdam, 1989, p. 53.
- (18) P. C. Canfield and Z. Fisk, Philos. Mag. B 65, 1117 (1992).
- (19) P. C. Canfield and I. R. Fisher, J. Crystal Growth 225, 155 (2001).
- (20) M. E. Fisher, Philos. Mag. 7, 1731 (1962).
- (21) M. E. Fisher and J. S. Langer, Phys. Rev. Lett. 7, 665 (1968).
- (22) M. Bouvier, P. Lethuillier, and D. Schmitt, Rhys. Rev. B 43, 13137 (1991).
- (23) J. A. Blanco, D. Gignoux, and D. Schmitt, Rhys. Rev. B 43, 13145 (1991).
- (24) K. D. Schotte and U. Schotte, Phys. Lett. A 55, 38 (1975).
- (25) R. A. Ribeiro, S. L. Bud’ko. and P. C. Canfield, J. Magn. Magn. Mater. 267, 216 (2003).
- (26) K. W. H. Stevens, Proc. Phys. Soc., London, Sect. A 65, 209 (1952).
- (27) M. T. Hutchings, in Solid State Physics: Advances in Research and Applications, edited by F. Seitz and D. Turnbull (Academic, New York, 1964), Vol16, p.227.
- (28) K. D. Myers, S. L. Bud’ko, I. R. Fisher, Z. Islam, H. Kleinke, A. H. Lacerda, and P. C. Canfield, J. Magn. Magn. Mater. 205, 27 (1999).
- (29) E. Morosan, S. L. Bud’ko, P. C. Canfield, M. S. Torikachvili, and A.H. Lacerda, J. Magn. Magn. Mater. 277, 298 (2004).
- (30) K. Kadowaki and S. B. Woods, Solid State Commun. 58, 507 (1986).
| CEF parameters (K) | ||||||
| 5.36 | -11.15 | 0.12 | 0.58 | 1.02 | ||
| Energy levels and Wave Functions | ||||||
| (K) | ||||||
| 171.7 | 0.848 | 0 | -0.357 | 0 | 0.391 | 0 |
| 171.7 | 0 | -0.393 | 0 | 0.358 | 0 | -0.847 |
| 99.3 | -0.527 | 0 | -0.635 | 0 | 0.565 | 0 |
| 99.3 | 0 | -0.564 | 0 | 0.634 | 0 | 0.529 |
| 0 | 0 | -0.726 | 0 | -0.685 | 0 | 0.047 |
| 0 | 0.047 | 0 | 0.685 | 0 | 0.726 | 0 |