Tightly Correlated HI and FUV Emission in the Outskirts of M83
Abstract
We compare sensitive H I data from The H I Nearby Galaxy Survey (THINGS) and deep far UV (FUV) data from GALEX in the outer disk of M83. The FUV and H I maps show a stunning spatial correlation out to almost 4 optical radii (), roughly the extent of our maps. This underscores that H I traces the gas reservoir for outer disk star formation and it implies that massive (at least low level) star formation proceeds almost everywhere H I is observed. Whereas the average FUV intensity decreases steadily with increasing radius before leveling off at , the decline in H I surface density is more subtle. Low H I columns () contribute most of the mass in the outer disk, which is not the case within . The time for star formation to consume the available H I, inferred from the ratio of H I to FUV intensity, rises with increasing radius before leveling off at Gyr, i.e., many Hubble times, near . Assuming the relatively short H2 depletion times observed in the inner parts of galaxies hold in outer disks, the conversion of H I into bound, molecular clouds seems to limit star formation in outer galaxy disks. The long consumption times suggest that most of the extended H I observed in M83 will not be consumed by in situ star formation. However, even these low star formation rates are enough to expect moderate chemical enrichment in a closed outer disk.
Subject headings:
galaxies: evolution — galaxies: ISM — galaxies: individual (M83) — radio lines: galaxies — stars: formation1. Introduction
In this letter we compare wide-field images of atomic hydrogen (H I) and far ultraviolet (FUV) emission, a tracer of recent star formation (SF), in the far outer disk of the nearby spiral galaxy M83. Star formation in the outer disks of galaxies has been the subject of numerous studies, including direct optical observations of massive SF (e.g., Ferguson et al., 1998; Lelièvre & Roy, 2000; Cuillandre et al., 2001; de Blok & Walter, 2003) and studies of the star-forming interstellar medium (ISM) using CO emission (Braine et al., 2007; Gardan et al., 2007) or dust (Zaritsky, 1994; Popescu & Tuffs, 2003). With its large field-of-view and excellent sensitivity, the Galaxy Evolution Explorer (GALEX) revolutionized this field, revealing widespread, extended SF in the far outer reaches (i.e., far beyond the optical disks) of many galaxies (Thilker et al., 2005, 2007, 2009; Gil de Paz et al., 2005, 2007a; Boissier et al., 2007). At the same time it has long been known that many galaxies host extended H I distributions (e.g., Bosma, 1981; Kamphuis & Briggs, 1992; Bajaja et al., 1994; Boomsma et al., 2008; Walter et al., 2008) – including M83 (e.g., Huchtmeier & Bohnenstengel, 1981).
Mainly due to the lack of matched wide-field and sensitive UV and 21 cm observations, it is still largely unclear how these two extended components – star formation traced by FUV emission and atomic hydrogen – relate to one another. Although the integrated star formation rates (SFRs) in extended UV (XUV) disks represent only a small fraction of the total SFR, the H I-SFR connection at large radii bears on a number of aspects of galaxy structure and evolution, such as the shapes and edges of stellar disks (Pohlen & Trujillo, 2006) or chemical enrichment gradients across galaxies (Gil de Paz et al., 2007b). The consumption of outer disk H I by SF affects the availability of this gas for fueling SF in inner galaxy disks, a necessary process for galaxies to sustain SF over cosmological times (e.g., Shlosman, Frank & Begelman, 1989; Blitz, 1996; Bauermeister et al., 2009). Finally, comparing UV and H I in the extreme (low-density, often low-metallicity) environment of outer galaxy disks can illuminate the limiting conditions for cloud and star formation (“star formation threshold”).
In this letter we combine sensitive, large field-of-view H I data from THINGS (The H I Nearby Galaxy Survey, Walter et al., 2008) with extremely deep FUV data from GALEX to study the relationship between H I (the dominant component of the ISM at large radii) and FUV emission in the nearby spiral galaxy M83. Previous, shallower GALEX observations showed that M83 hosts one of the most prominent examples of a XUV disk (Thilker et al., 2005, 2007). This unique data set allows us to trace the distribution of H I and FUV emission across a field-of-view, corresponding to almost 4 optical radii r25 (defined as the 25th B-band mag arcsec-2 isophote). We use these data to measure the location (§ 3) and amount (§ 4) of FUV emission relative to the H I. In Section § 5 we investigate the distribution of H I surface densities in different radial regimes across M83.
2. Data & Methodology
We use H I data from the NRAO111The National Radio Astronomy Observatory is a facility of the National Science Foundation operated under cooperative agreement by Associated Universities, Inc. VLA obtained as part of THINGS to construct a map of H I 21 cm emission across a field-of-view (Figure 1, lower left panel). This map has been corrected for primary beam attenuation (the VLA primary beam FWHM is ). To maximize sensitivity for extended emission, we apply the “natural” weighting scheme, which yields a sensitivity (1 RMS) of mJy/beam (or ) and a resolution of . M83 is known to contain a significant amount of its total H I content in the form of diffuse, low column density H I in its outer disk (e.g., Huchtmeier & Bohnenstengel, 1981), which our interferometric observations will not pick up by design. Because we are focussing on H I emission associated with (localized) star formation, the potentially missing flux on very large () scales is not a concern in the current study. When quoting H I surface densities we include a factor of 1.36 to account for helium and heavier elements.
The GALEX FUV data are part of our GI program GI3-050. Due to two bright stars near M83, the GALEX observations were carried out in petal pattern mode allowing for the field-of-view to be centered on the galaxy. The GALEX field-of-view is slightly larger than the area covered by the H I map. We thus restrict our analysis to the field covered by both maps. M83 was observed for 9 orbits ( ks) yielding a FUV map about three times as sensitive as the GALEX Nearby Galaxy Survey M83 map (Gil de Paz et al., 2007a). We use a gaussian kernel to degrade the resolution of the FUV map to to match that of the H I map. In this map, the (median based) RMS scatter of the noise is about mJy arcsec-2.
We adopt inclination () and position angle () from Tilanus & Allen (1993), distance () from Karachentsev et al. (2004) and the optical radius () from LEDA (Paturel et al., 2003). For details of data processing, the conversion of measured intensities to physical units (e.g., FUV intensities into estimated SFR surface densities), assessment of uncertainties, etc., we refer the reader to Bigiel et al. (2010).
3. Location of FUV Relative to HI
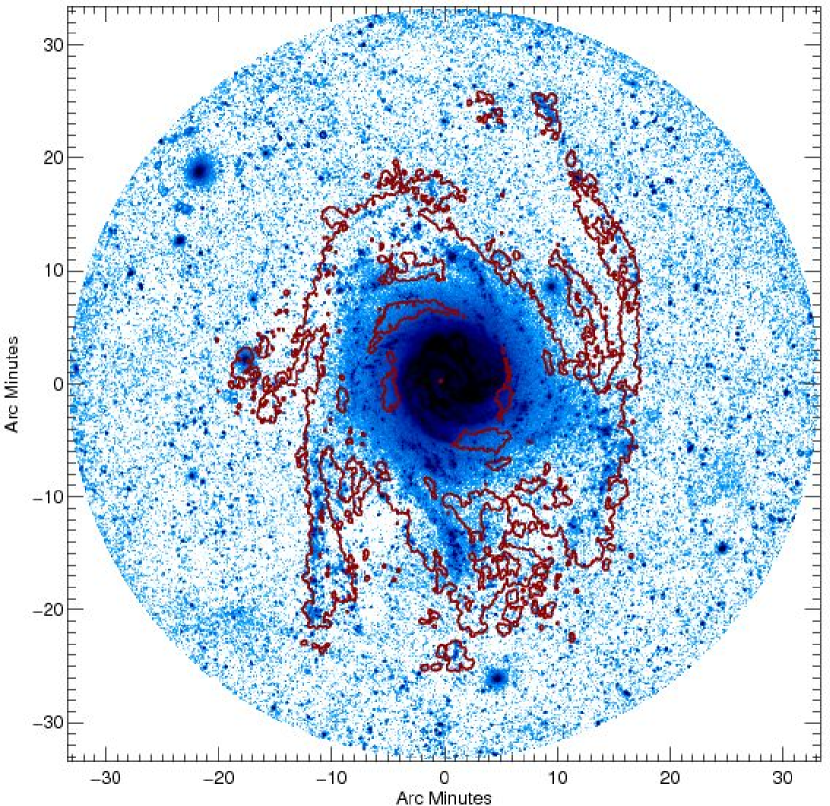
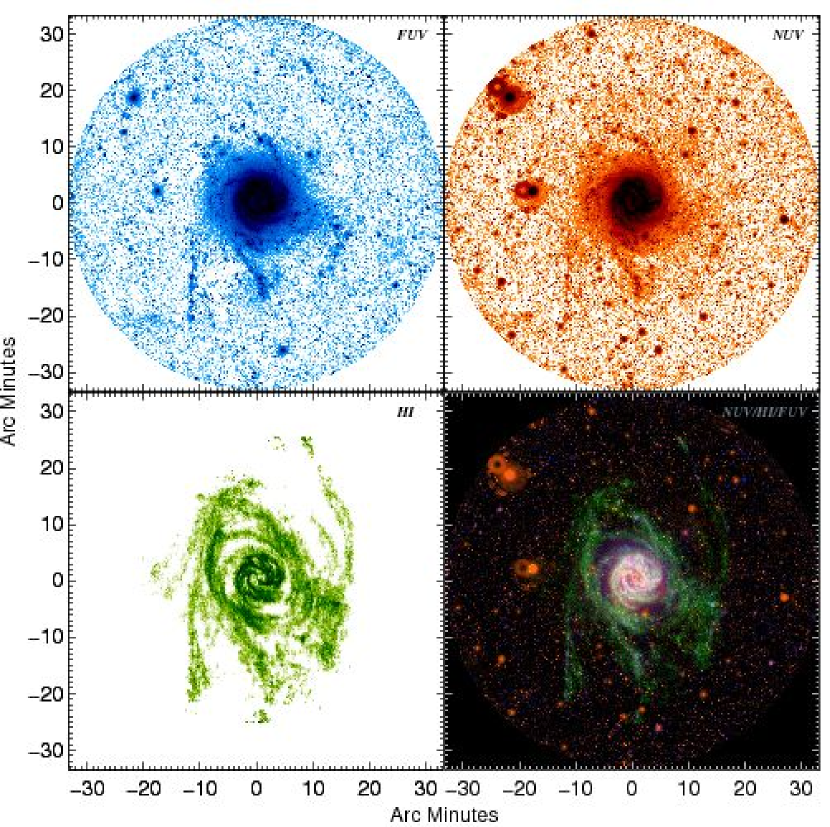
Figure 1 shows that H I (lower left panel) and UV emission (top panels) are detected far into the outer disk of M83 (the edge of the maps corresponds to ). It also shows a remarkable spatial coincidence of major features found in the maps. Figure 2 shows this even more clearly: Plotted are (smoothed) H I contours of () on top of the GALEX FUV map. Almost every H I feature has a corresponding feature in the FUV map. Even very remote structures, such as the tip of the extended, western H I arm show FUV emission and thus signs of recent star formation activity. This close correspondence implies that the extended H I disk represents the reservoir from which the young stars emitting the FUV emission are forming (presumably with an intermediate stage of bound molecular gas). It also implies, quite surprisingly, that massive star formation proceeds – if at a low level – almost everywhere H I is observed.
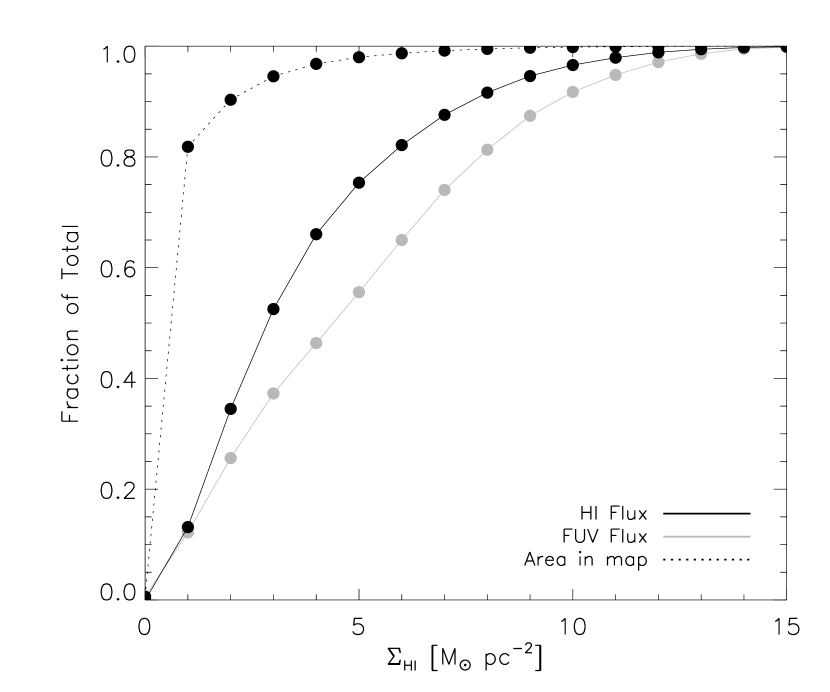
Figure 3 quantifies the coincidence of H I and FUV222For this plot (and the following) we exclude regions near foreground stars and background galaxies identified from the GALEX pipeline source catalogs and from comparing UV and optical imaging. The -axis gives the fraction of the total FUV (gray) or H I (black) flux found in regions (i.e., along lines-of-sight) with H I surface densities lower than the value on the -axis. For example, for an -axis H I surface density of 2 M⊙ pc-2, we identify all area (i.e., lines-of-sight) in the maps with M⊙ pc-2. We then add up the H I (FUV) emission from this area and divide this H I (FUV) flux by the H I (FUV) flux of the entire map to get the fraction of flux found below the H I surface density of 2 M⊙ pc-2. For comparison, we also plot (dotted line) the fraction of area as a function of H I surface density (e.g., in the above example the fraction of the entire M83 H I map with M⊙ pc-2).
The key point in Figure 3 is that the FUV curve (gray) tracks the H I curve (black) much more closely than it follows the area curve (dotted). The area curve is the expected distribution for FUV emission if it were randomly distributed across the map. The fact that the H I and FUV curves are quite similar thus shows that rather than being randomly distributed, the distribution of FUV flux seems to follow that of the H I. Also, while most of the area in our map is covered by low column (or no) H I, the FUV comes mostly from lines-of-sight with relatively high . For example, of the area has H I surface densities , while only of the FUV flux comes from this area. This behavior is expected if FUV is spatially correlated with H I emission and implies that a substantial amount of H I (high surface densities) seems to be a necessary prerequisite to star formation.
4. Radial Trends

Having seen that FUV and H I emission are remarkably coincident, we now ask how the amount of FUV emission compares to the mass of H I along a line-of-sight. The H I is concentrated into features (the arms and filaments in Figures 1 and 2) with a relatively low filling fraction, and we have just seen that FUV emission is largely coincident with these features. Our approach here is to look at the mean ratio of H I-to-FUV along these features as a function of radius, asking “Where there is H I, what is its average surface density and what is the associated average FUV intensity?”. For this, we consider only emission from areas that have H I surface densities (in a smoothed 30 resolution version of the H I map) .
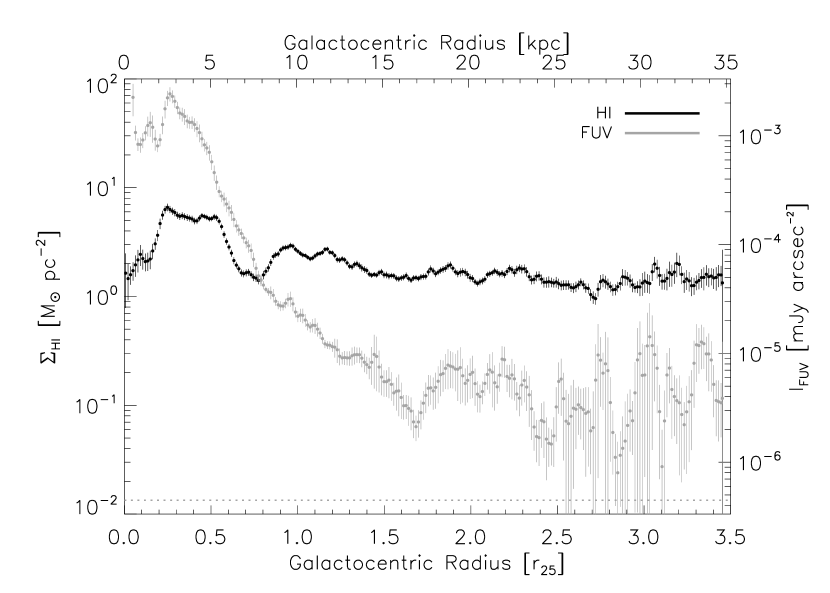
Figure 4 shows the average H I and FUV intensities along these features. Differences are immediately apparent: the FUV profile (gray) decreases over many orders-of-magnitude from the inner parts into the outer disk before it levels off at about (note that the FUV emission is not corrected for internal extinction, which is significant at small radii). The FUV emission at large radii is still detected with good sensitivity; the profile is always well above the gray dotted line, which shows the typical 5 sensitivity. This supports the qualitative conclusion from Figure 2 that the extended H I structures in M83 seem to coincide with FUV emission, indicating recent SF activity out to largest radii. In contrast to the FUV profile, the H I surface density (black) shows only a moderate change with radius. The typical (azimuthally averaged) H I surface density is .
Assuming FUV emission to arise mostly from young massive stars forming at a steady rate, we can convert the measured FUV intensities into star formation rate surface densities, (using the same procedure as Bigiel et al., 2010). Then the ratio of the two profiles (which is proportional to ) is the H I depletion time, the time it takes (present day) SF to deplete the current supply of H I. This quantity is shown as a function of radius in the right panel of Figure 4 (note that inside we do not expect to trace the gas depletion time, as both H2 and extinction become important).
The H I depletion time rises from the optical disk out to and then remains relatively constant across the far outer disk of M83 at about 100 Gyr, i.e., many Hubble times. This very long timescale has several implications. First, it is much longer than the Gyr depletion time of the molecular gas observed in the inner disks of galaxies (Bigiel et al., 2008; Leroy et al., 2008). Assuming bound, molecular clouds form stars with roughly the same efficiency in the inner and outer disk, this extremely long H I depletion time suggests that the process of building these molecular clouds is the bottleneck for forming stars at large radii. Combined with the rather low H I columns that dominate at large radii, the regulating and / or limiting factor for star formation in these environments may well be that of driving the H I to high enough densities to trigger the atomic-to-molecular phase transition and subsequent star formation.
The long H I depletion time also implies that the extended H I reservoir in the outer disk is long-lived, or at least that in situ star formation is unlikely to consume the gas. This means that this gas is in principle available as fuel for star formation in the inner disk, if it can be efficiently transported into the inner part of the galaxy (e.g., Wong et al., 2004; Vollmer & Leroy, 2010). Single dish observations sensitive to the entire H I distribution (compare § 2) suggest that M83 hosts a very large reservoir of H I beyond the optical disk – as much as 80% of the total H I mass (Huchtmeier & Bohnenstengel, 1981, and references therein). The total mass of this H I reservoir may well exceed , which would in principle be enough to sustain present-day SF in the inner disk of M83 for 2–3 times longer than is possible from the H2 alone (Lundgren et al., 2004).
The moderate SF activity at large radii should also chemically enrich the H I envelope. If the disk remained in its present configuration for Gyr, then the integrated outer-disk SFR ( beyond ) and a stellar yield of (Krumholz & Dekel, 2010) imply a mass of heavy elements equal to about of the total outer disk H I mass (as determined from our map). This is only a coarse estimate, but it shows that even the low observed outer disk SFR may enrich the outer disk gas to a moderate metallicity. This fits to observations of emission from hot dust (Dong et al., 2008) and fairly decent metallicities (Gil de Paz et al., 2007b; Bresolin et al., 2009) in the XUV disk of M83.
5. Distribution of HI Surface Densities
We have seen that low level star formation is pervasive in the H I arms and filaments in the outer disk of M83. We have also seen that the absolute level of this star formation is very low compared to that found in galaxy disks. What drives this drop in the fraction of H I that eventually ends up in stars? A number of authors have suggested that a drop in H I column or volume density leads to some critical prerequisite for cloud formation not being met (e.g., Elmegreen & Parravano, 1994; Schaye, 2004; Bush et al., 2010). We conclude by briefly examining how H I surface densities actually change between inner and outer disk.
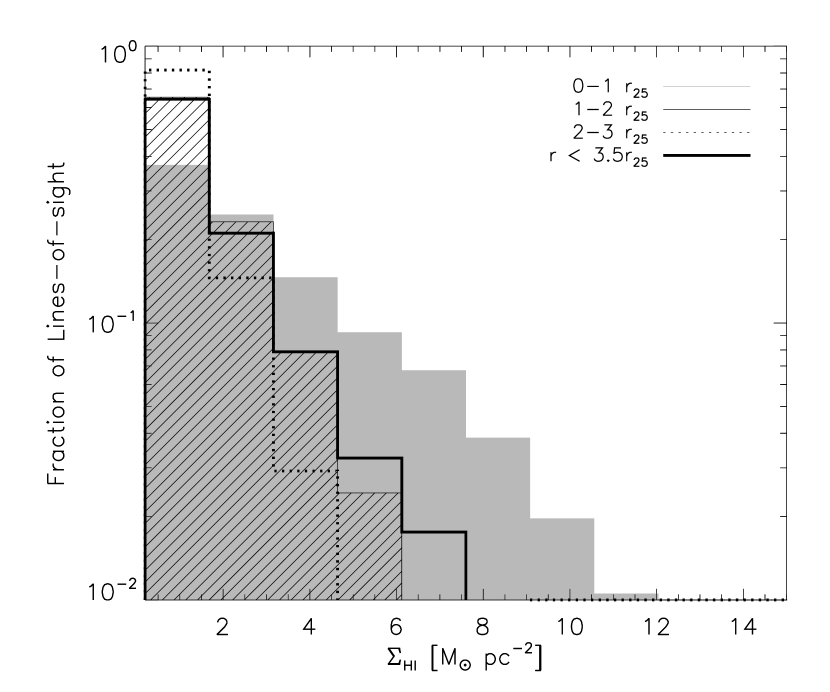
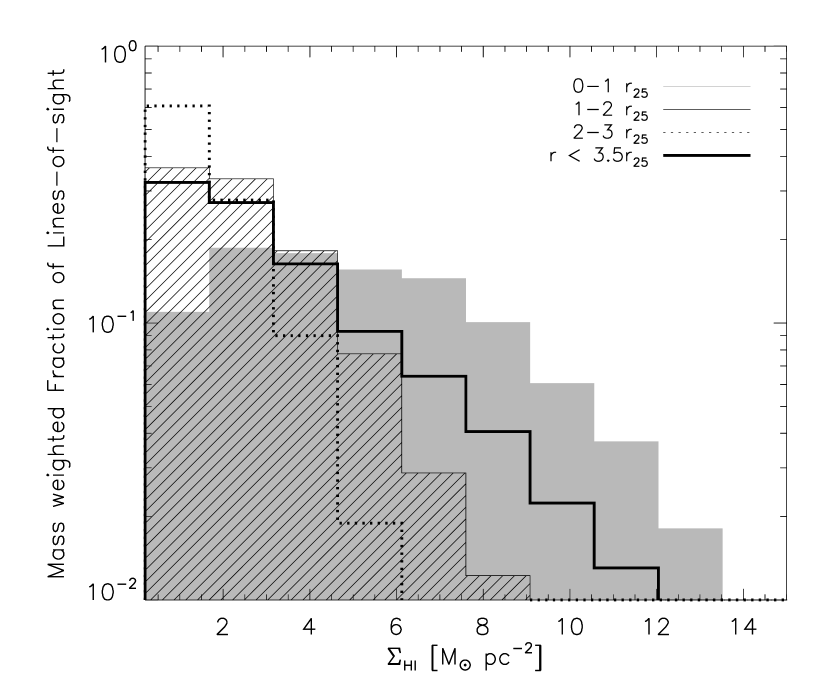
The left panel in Figure 5 shows the (normalized) distribution of for lines-of-sight in different radial regimes (see caption for details). The right panel shows the same data, but now each line-of-sight is weighted by mass, so that the left panel gives the distribution of surface densities and the right panel shows at what column most of the mass is found.
In the left panel, the histograms from different regimes are not particulary distinct though one can see some enhancement in the H I columns found inside (visible also as the “bump” in the radial profile in the left panel of Figure 4 between and ). These differences are much easier to see in the mass-weighted histograms on the right. While in the optical disk H I surface densities between contribute roughly equally to the integrated H I mass in this regime, it is clearly the lowest H I columns that contribute most to the mass in the outer disk (i.e., beyond ). In fact, there appears to be a radial trend in the sense that as one moves inwards from the far outer disk, an increasing fraction of the H I mass comes from lines-of-sight with relatively high H I surface density.
We saw that in the outer disk of M83, high H I surface densities, likely a prerequisite for molecular gas and subsequent star formation, contribute a decreasing fraction to the overall H I mass as one moves to large radii. The extended arms seen in Figure 1 thus seem to represent merely the “tip of the iceberg” of the extended H I distribution in M83. These arms, however, appear to be the regions where pervasive star formation can proceed even at extreme galactocentric radii.
References
- Bajaja et al. (1994) Bajaja, E., Huchtmeier, W. K., & Klein, U. 1994, A&A, 285, 385
- Bauermeister et al. (2009) Bauermeister, A., Blitz, L., & Ma, C.-P. 2009, ApJ, accepted, arXiv:0909.3840
- Bigiel et al. (2008) Bigiel, F., Leroy, A., Walter, F., Brinks, E., de Blok, W. J. G., Madore, B., & Thornley, M. D. 2008, AJ, 136, 2846
- Bigiel et al. (2010) Bigiel, F., Leroy, A., Walter, F., Blitz, L., Brinks, E., de Blok, W. J. G., & Madore, B. 2010, arXiv:1007.3498, AJ, accepted
- Blitz (1996) Blitz, L. in 25 Years of Millimeter Wave Spectroscopy, ed. W. B. Latter, S. J. E. Radford, P. R. Jewell, J. G. Mangum, & J. Bally (Dordrecht: Kluwer), 11
- Boomsma et al. (2008) Boomsma, R., Oosterloo, T. A., Fraternali, F., van der Hulst, J. M., & Sancisi, R. 2008, A&A, 490, 555
- Bosma (1981) Bosma, A. 1981, AJ, 86, 1791
- Boissier et al. (2007) Boissier, S., et al. 2007, ApJS, 173, 524
- Braine et al. (2007) Braine, J., Ferguson, A. M. N., Bertoldi, F., & Wilson, C. D. 2007, ApJ, 669, L73
- Bresolin et al. (2009) Bresolin, F., Ryan-Weber, E., Kennicutt, R. C., & Goddard, Q. 2009, ApJ, 695, 580
- Bush et al. (2010) Bush, S. J., Cox, T. J., Hayward, C. C., Thilker, D., Hernquist, L., & Besla, G. 2010, ApJ, 713, 780
- Cuillandre et al. (2001) Cuillandre, J.-C., Lequeux, J., Allen, R. J., Mellier, Y., & Bertin, E. 2001, ApJ, 554, 190
- de Blok & Walter (2003) de Blok, W. J. G., & Walter, F. 2003, MNRAS, 341, L39
- Dong et al. (2008) Dong, H., Calzetti, D., Regan, M., Thilker, D., Bianchi, L., Meurer, G. R., & Walter, F. 2008, AJ, 136, 479
- Elmegreen & Parravano (1994) Elmegreen, B. G., & Parravano, A. 1994, ApJ, 435, L121
- Ferguson et al. (1998) Ferguson, A. M. N., Wyse, R. F. G., Gallagher, J. S., & Hunter, D. A. 1998, ApJ, 506, L19
- Gardan et al. (2007) Gardan, E., Braine, J., Schuster, K. F., Brouillet, N., & Sievers, A. 2007, A&A, 473, 91
- Gil de Paz et al. (2005) Gil de Paz, A., et al. 2005, ApJ, 627, L29
- Gil de Paz et al. (2007a) Gil de Paz, A., et al. 2007a, ApJS, 173, 185
- Gil de Paz et al. (2007b) Gil de Paz, A., et al. 2007b, ApJ, 661, 115
- Huchtmeier & Bohnenstengel (1981) Huchtmeier, W. K., & Bohnenstengel, H.-D. 1981, A&A, 100, 72
- Kamphuis & Briggs (1992) Kamphuis, J., & Briggs, F. 1992, A&A, 253, 335
- Karachentsev et al. (2004) Karachentsev, I. D., Karachentseva, V. E., Huchtmeier, W. K., & Makarov, D. I. 2004, AJ, 127, 2031
- Krumholz & Dekel (2010) Krumholz, M., & Dekel, A. 2010, in prep.
- Lelièvre & Roy (2000) Lelièvre, M., & Roy, J.-R. 2000, AJ, 120, 1306
- Leroy et al. (2008) Leroy, A. K., Walter, F., Brinks, E., Bigiel, F., de Blok, W. J. G., Madore, B., & Thornley, M. D. 2008, AJ, 136, 2782
- Lundgren et al. (2004) Lundgren, A. A., Wiklind, T., Olofsson, H., & Rydbeck, G. 2004, A&A, 413, 505
- Martin & Kennicutt (2001) Martin, C. L., & Kennicutt, R. C., Jr. 2001, ApJ, 555, 301
- Paturel et al. (2003) Paturel, G., Theureau, G., Bottinelli, L., Gouguenheim, L., Coudreau-Durand, N., Hallet, N., & Petit, C. 2003, A&A, 412, 57
- Pohlen & Trujillo (2006) Pohlen, M., & Trujillo, I. 2006, A&A, 454, 759
- Popescu & Tuffs (2003) Popescu, C. C., & Tuffs, R. J. 2003, A&A, 410, L21
- Schaye (2004) Schaye, J. 2004, ApJ, 609, 667
- Shlosman, Frank & Begelman (1989) Shlosman, I., Frank, J. & Begelman, M. C. 1989, Nature, 338, 45
- Thilker et al. (2005) Thilker, D. A., et al. 2005, ApJ, 619, L79
- Thilker et al. (2007) Thilker, D. A., et al. 2007, ApJS, 173, 538
- Thilker et al. (2009) Thilker, D. A., et al. 2009, Nature, 457, 990
- Tilanus & Allen (1993) Tilanus, R. P. J., & Allen, R. J. 1993, A&A, 274, 707
- Vollmer & Leroy (2010) Vollmer, B., & Leroy, A. 2010, AJ, submitted
- Walter et al. (2008) Walter, F., Brinks, E., de Blok, W. J. G., Bigiel, F., Kennicutt, R. C., Thornley, M. D., & Leroy, A. 2008, AJ, 136, 2563
- Wong et al. (2004) Wong, T., Blitz, L., & Bosma, A. 2004, ApJ, 605, 183
- Zaritsky (1994) Zaritsky, D. 1994, AJ, 108, 1619