GALEX and Pan-STARRS1 Discovery of SN IIP 2010aq:
The First Few Days After Shock Breakout in a Red Supergiant Star
Abstract
We present the early UV and optical light curve of Type IIP supernova (SN) 2010aq at , and compare it to analytical models for thermal emission following SN shock breakout in a red supergiant star. SN 2010aq was discovered in joint monitoring between the Galaxy Evolution Explorer (GALEX) Time Domain Survey (TDS) in the NUV and the Pan-STARRS1 Medium Deep Survey (PS1 MDS) in the , , , and bands. The GALEX and Pan-STARRS1 observations detect the SN less than 1 day after shock breakout, measure a diluted blackbody temperature of K 1 day later, and follow the rise in the UV/optical light curve over the next 2 days caused by the expansion and cooling of the SN ejecta. The high signal-to-noise ratio of the simultaneous UV and optical photometry allows us to fit for a progenitor star radius of , the size of a red supergiant star. An excess in UV emission two weeks after shock breakout compared to SNe well fitted by model atmosphere-code synthetic spectra with solar metallicity, is best explained by suppressed line blanketing due to a lower metallicity progenitor star in SN 2010aq. Continued monitoring of PS1 MDS fields by the GALEX TDS will increase the sample of early UV detections of Type II SNe by an order of magnitude, and probe the diversity of SN progenitor star properties.
Subject headings:
supernovae: individual (SN 2010aq) — ultraviolet: general — surveys1. Introduction
Shock breakout in a core-collapse supernova (SN) marks the first escape of radiation from the blast wave that breaks through the surface of the star and launches the SN ejecta, heating it to temperatures of K (Colgate, 1974; Falk, 1978; Klein & Chevalier, 1978; Matzner & McKee, 1999). The duration of this radiative precursor in the UV/X-rays is smeared out by light-travel time effects to s , where is the pre-SN radius of the progenitor star. In the presence of a dense wind, or if the shock breakout is aspherical or very weak, the observed duration can be much longer (Campana et al., 2006; Chevalier & Fransson, 2008; Couch et al., 2009; Dessart et al., 2010).
Following shock breakout, the early SN light curve is powered by radiation from the expanding and cooling SN ejecta. In hydrogen-rich Type II-plateau SNe (SNe IIP), a receding H recombination wave prolongs the optical brightness of the SN until radioactive heating plays a dominant role. The luminosity and temperature evolution of the early thermal expansion phase can be used as a diagnostic for the radius of the progenitor star, as well as the explosion energy to ejecta mass ratio (Waxman et al., 2007). This is an important tool, since the direct detection of SN progenitors is incredibly difficult, and has only been possible for a small number of nearby SNe with pre-explosion high resolution imaging (Smartt et al., 2009).
Recent observational advances have enabled the detection of early UV emission from core-collapse SNe from hours to a couple of days after explosion. The Swift satellite serendipitously detected luminous X-ray bursts with X-Ray Telescope (XRT) from Type Ib/c SNe 2006aj and 2008D, which were modeled by shock breakout in the dense wind surrounding a Wolf-Rayet (WR) star (Campana et al., 2006; Waxman et al., 2007; Soderberg et al., 2008), although alternative scenarios were also proposed that invoked the presence of relativistic jets (Ghisellini et al., 2007; Mazzali et al., 2008). The UV/optical counterparts detected in co-aligned Swift UVOT observations were well fitted by analytical models for emission from the expanding, cooling envelope of a progenitor with the radius of a WR star (Campana et al., 2006; Soderberg et al., 2008; Rabinak & Waxman, 2010).
The wide-field UV survey capabilities of the Galaxy Evolution Explorer (GALEX) satellite serendipitously detected the onset within 7 hr of shock breakout of a UV-bright plateau lasting d before fading away from Type IIP SN SNLS-04D2dc at , two weeks before its discovery in the optical Supernova Legacy Survey (SNLS) (Gezari et al., 2008; Schawinski et al., 2008). While the data were modeled both numerically and analytically with thermal emission following shock breakout in an RSG progenitor with ranging from to and a variety of stellar envelope density structures (Gezari et al., 2008; Schawinski et al., 2008; Tominaga et al., 2009; Rabinak & Waxman, 2010), the low signal-to-noise ratio of the detections (S/N) and the lack of simultaneous optical data preclude one from fitting for the parameters of the RSG progenitor star.
In this Letter, we present SN IIP 2010aq at discovered in joint monitoring observations in the UV by GALEX Time Domain Survey (TDS) and in the optical by the Pan-STARRS1 Medium Deep Survey (PS1 MDS). The UV and optical observations discover the SN less than 20.5 hr after shock breakout in the SN rest frame, and the high S/N of the detections enable us to use model fits to the early light curve to place meaningful constraints on the radius of the RSG progenitor star for the first time.
2. Observations
From UT 2010 February 4 - March 22 (UT dates are used throughout this Letter) the GALEX TDS monitored the 7 deg2 PS1 MDS field MD04 in the NUV with 7 pointings, each 1 deg2, with a cadence of 2 days and with a limiting magnitude of . Gaps in the regular monitoring occurred when the NUV detector was shut down for engineering tests. The GALEX science images were run through the difference imaging pipeline photpipe (Rest et al., 2005), and difference image detections were filtered through a series of selection criteria to remove false detections due to image-subtraction artifacts. The remaining detections were associated between epochs, and then cross-matched with the PS1 SN alerts from the MDS with a matching radius of 5.
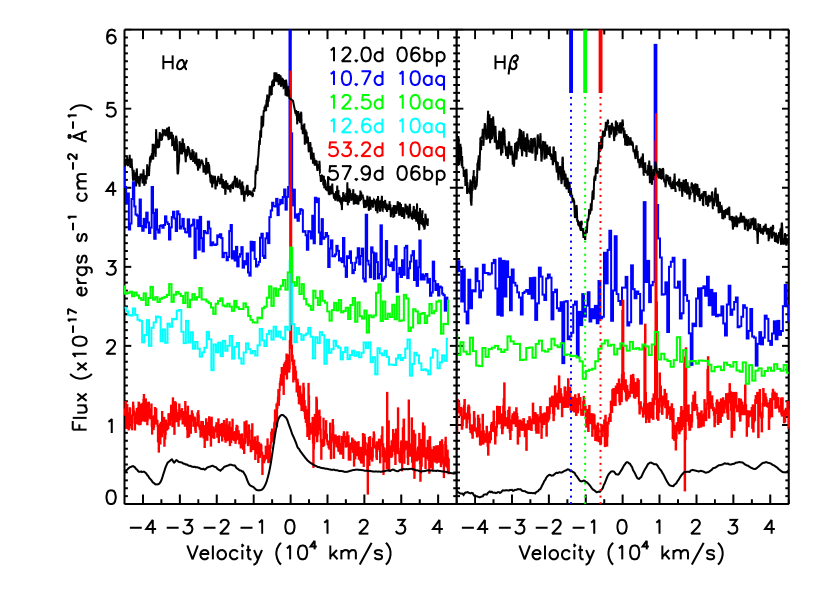
GALEX TDS detected a variable object on 2010 February 12 coincident with a PS1 SN candidate discovered at R.A., decl. (J2000) in daily imaging cycling through the , , , and filters starting on 2010 February 12. The SN was confirmed with spectroscopy with the 4.2m William Herschel Telescope (WHT) with ISIS on 2010 February 23.08 to be a Type IIP SN at from its strong Balmer P-Cygni features (SN 2010aq, Valenti et al., 2010). We obtained additional epochs of spectroscopy with the Nordic Optical Telescope (NOT) with ALFOSC on 2010 February 24.98, the 6.5 m Magellan Telescope with IMACS on 2010 February 25.17, and with the 6.5m MMT with Hectospec on 2010 April 10.20. In Figure 1 we show the H and H features in our spectra, and the velocity drift of the absorption minimum of H with time from the recession of the photosphere in mass.
In order to avoid systematic errors from residuals in the difference images, the GALEX photometry is measured on the science images with a 6 radius aperture centered on the host galaxy, and the flux of the SN is determined by subtracting the flux of the host galaxy measured from pre-SN epochs ( mag). The 1 error is measured empirically from the dispersion in magnitudes measured for sources detected in all epochs. The offset between the SN and the host galaxy centroid is (1 pixel), for which we estimate an upper limit to systematic errors due to centering of the aperture 0.1 mag. The GALEX photometry is in the AB system, has been aperture corrected (, Morrissey et al., 2007), and is corrected for Galactic extinction with mag.
The PS1 MDS images were reduced with the PS1 Image Processing Pipeline (Magnier, 2006) including detrending, calibration, warping, and stacking. Difference imaging and transient alerting were performed using the photpipe pipeline on the stacked PS1 images (Rest et al., 2005). The SN photometry is measured by photpipe using forced point-spread function (PSF) photometry on the difference images at the position of the SN, and the zeropoint is measured from comparison with field stars in the SDSS catalog. The PS1 photometry is in the AB system, and is corrected for Galactic extinction.
Table 1 lists the GALEX and PS1 SN photometry, and Figure 2 shows the UV and optical SN light curve. We define the phase of the SN () to be days in the SN rest frame since the time of shock breakout (). Our observed constraint on is the time between the last non-detection with GALEX in the NUV on MJD , and the first detection with PS1 in the -band on MJD , which is a window of 20.5 h in the SN rest frame. We further constrain using fits of shock breakout models to the early UV/optical light curve in §4 to be MJD .
3. Host Galaxy
We measure the host galaxy redshift of from nebular emission lines that are superimposed on the SN spectrum, and adopt a distance modulus, DM=38.0. The narrow Balmer lines have a Galactic-extinction corrected H/H ratio of , corresponding to an internal extinction of )=0.12 0.04 mag (Calzetti, 2001). We use the semiempirical relation between metallicity and the measured nebular emission line ratios, [N II]/H, [O III]H, and ([O II][O III])/H, to measure a low oxygen abundance of log(O/H) (McGaugh, 1991; van Zee et al., 1998; Pettini & Pagel, 2004), which is consistent with the low metallicity expected from the luminosity-metallicity relation from Tremonti et al. (2004) given the dwarf host galaxy of SN 2010aq with an internal extinction and -corrected rest-frame absolute magnitude of mag.
4. Comparison with Analytical Models
We compare the early ( d) UV/optical light curve to analytical models for shock breakout and its immediate aftermath in a RSG star, the progenitors of Type IIP SNe. The analytical model presented by Nakar & Sari (2010) (NS10), follows the photon-gas coupling to determine the location of the photosphere, and takes into account photon diffusion from inner layers below the photosphere. The analytical relations presented by Rabinak & Waxman (2010) (RW10) neglect the effects of photon diffusion, but do include opacity from electron scattering and its effect on the emitted spectrum. Although the pre-SN stellar structure and detailed physics are better treated in numerical radiation hydrodynamics models, these models are computing-time intensive, and analytical models are more practical to use for fitting for the parameters of the progenitor star. We rely on the analytical scaling relations from NS10 to constrain and , where is , , and ergs. Here is the energy of the explosion, and refers to the mass of the ejecta, and does not include the 1.44 from the neutron star core or mass lost from winds during the lifetime of the star.
In the spherical expansion phase (when ), the NUV light curve rises to a maximum when the ejecta expands and cools until the peak energy of the emission is , or when eV. Using for a RSG from NS10, this translates to d . For a blue supergiant star (BSG) with , in the NUV occurs much earlier ( d), which is incompatible with the observed light curve of SN 2010aq. If we use our observed limits on = MJD , and conservatively estimate to be within 1 day of the second GALEX detection on MJD 55241.5, then in the SN rest-frame d, and this results in .
The first detection in the NUV () on MJD 55239.30, as well as on MJD 55239.46 in the and bands, places a tight constraint on ). In the first couple of days after shock breakout, the spectrum of the emission is well approximated by a diluted blackbody (Gezari et al., 2008; Tominaga et al., 2009). Assuming that the and data points are mag fainter on MJD 55239.30, the UV/optical photometry is fitted with mag and eV, in excellent agreement with derived from the Balmer decrement. Note that the observed diluted blackbody temperature is hotter than the photospheric temperature by a factor of as a result of electron scattering (RW10).
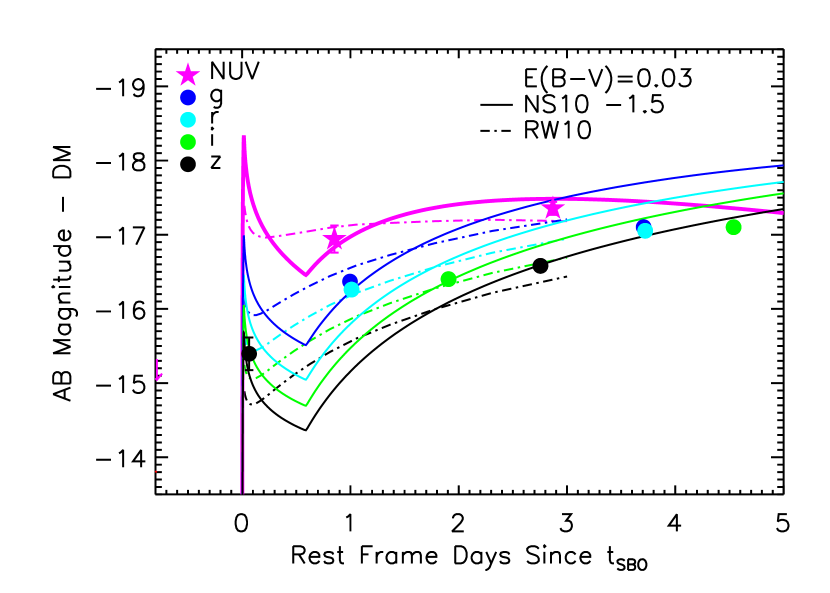
In Figure 3 we plot the NS10 model for an RSG with , fitted for mag and MJD 55238.42 , with an offset of mag and a K correction to transform the NS10 models from the rest-frame to the observed frame of SN 2010aq. The NS10 model is in good agreement with the data until d. The tight constraint on is from the fit to the earliest detection in the -band on d, and does not include the much larger uncertainties at very early phases ( d for a RSG) introduced by the simplistic approximations in the analytical models (RW10). While the NS10 model is fitted to the data with a small amount of reddening, if we require that mag, then one gets the same fit at to a model with a factor of times higher temperature, and thus with . Given the offset in luminosity required to fit the model, and for an RSG from NS10, one gets an additional constraint of .
When combining all of the constraints above, an extinction of mag is required for the allowed parameters from to converge with those from . If we assume the best fit value for the reddening from of mag, which is in agreement with this upper limit, then for different values of , one then gets the following solutions, () = (0.5, , ), (1.0, , ), and (1.5, , ), thus placing the strongest constraint on the radius of the RSG progenitor, . For this value of , stellar evolutionary models of core-collapse SN progenitor stars with solar to half-solar metallicities have (Eldridge & Tout, 2004), and hydrodynamical simulations of SNe IIP have even larger model ejecta masses () (Utrobin & Chugai, 2008), thus favoring the solutions with 1.5.
In Figure 3, we also show a -corrected analytical model with a reddening of mag from RW10 with parameters within the limits of the allowed solutions ( and ) that has a luminosity and UV/optical colors that are in good agreement with the data at , but with a slower temperature evolution that is in slightly worse agreement with the data at d. If we again assume = 0.11 mag, then the model luminosity increases by a factor of 1.8, resulting in a similar increase in for values of .
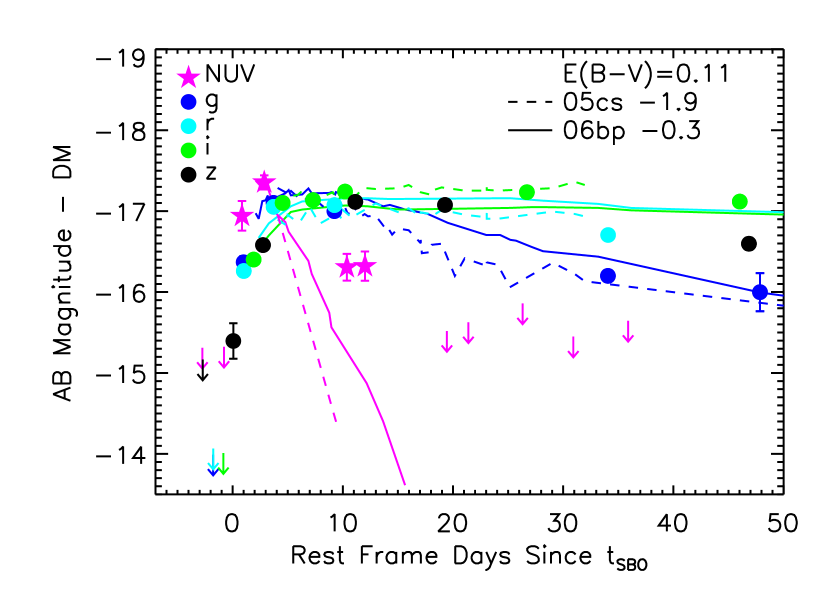
5. Comparison with Type IIP SNe 2005cs and 2006bp
We compare the late-time ( d) UV/optical light curve of SN 2010aq with two nearby Type IIP SNe well-studied in the UV and optical with the Swift satellite and ground-based photometry and spectroscopy, SN 2005cs (DM=29.7) and SN 2006bp (DM=31.2) (see summary in Dessart et al., 2008). In order to compare the light curves to SN 2010aq, we use SN IIP template spectra to measure the K correction required to transform the observations into the GALEX and PS1 filters in the observed frame of SN 2010aq, and apply a net internal reddening of mag, where we use the Cardelli et al. (1988) law, and the internal reddening estimated for SN 2005cs (2006bp) from synthetic spectral fits to optical spectra and UV photometry of () mag, with an accuracy of mag from Dessart et al. (2008). We set for SN 2005cs (2006bp) to the x-intercept of the expanding photosphere from Dessart et al. (2008) of MJD 53547.3 (MJD 53832.9), and after subtracting the distance modulus, shift the light curves by mag ( mag). The optical light curves are in good agreement between the SNe in Figure 2, and the similar evolution of the photospheric velocity with time of SNe 2010aq and 2006bp (see comparison in Figure 1), suggests they have a similar , since .
Figure 2 shows a large NUV excess of SN 2010aq compared to SNe IIP 2005cs and 2006bp at d. Given that the NUV excess is more prominent at d than at d, and that the d spectrum does not show signs of circumstellar interaction, it is most likely that the NUV excess is associated with the effects of line blanketing by metal ions shortward of 3000 Å, which increases with time when the photospheric temperature of the SN is cool enough for Fe II to be present (Dessart & Hillier, 2005). Indeed, if the metallicity of the solar-metallicity non-LTE atmosphere-code synthetic spectra fitted to SNe 2005cs and 2006bp from Dessart et al. (2008) was decreased, there would be a significant increase in the emitted NUV flux (see Figure 9, Dessart & Hillier, 2005). However, one must be cautious with this interpretation, since the UV spectral range is difficult to model. Even in the case of SN 1987A, where the metallicity, BSG progenitor, and explosion energy of the SN are well constrained, the most sophisticated time-dependent non-LTE radiative transfer models, while in excellent agreement with the optical observations (at the level of %), are in much worse agreement in the UV (only to the % level) (Dessart & Hillier, 2010). However, given the low metallicity of the dwarf host galaxy of SN 2010aq, a subsolar metallicity progenitor star is the most natural explanation for the UV excess at late times.
6. Conclusions
Although the duration of the radiative precursor from shock breakout is too short to be resolved by rolling SN surveys, the thermal expansion phase in the days following can be studied in detail. In this Letter, we have shown that with daily cadence UV and optical imaging we can use analytical models to fit for the radius of the pre-SN progenitor star, and even use the evolution of the UV light curve to directly probe its metallicity. UV observations are also critical for constraining the time of shock breakout in distant SNe ( is only 2 days in the NUV compared to 2 weeks in the band), and can improve the accuracy of using Type II-P SNe as distance indicators (Schmidt et al., 1992; Dessart et al., 2008; Kasen & Woosley, 2009).
Based on the detection efficiency of GALEX for detecting UV emission from Type II SNe measured from serendipitous observations of SNLS SN candidates, Gezari et al. (2008) predict a detection rate for GALEX TDS, which monitors one PS1 MD field per month, of month-1. Given the actual detections of two SNe IIP in effectively 2 months of operations of GALEX TDS in coordination with PS1, luminous SN 2009kf at (Botticella et al., 2010) and SN 2010aq, our detection rate appears to be right on the mark. Continued GALEX TDS and PS1 MDS monitoring will yield an exciting data set to probe the diversity of progenitors of core-collapse SNe, and approach a better understanding of the mapping from stellar evolution to stellar death.
References
- Botticella et al. (2010) Botticella, M. T., et al. 2010, ArXiv e-prints, 1001.5427
- Calzetti (2001) Calzetti, D. 2001, PASP, 113, 1449
- Campana et al. (2006) Campana, S., et al. 2006, Nature, 442, 1008
- Cardelli et al. (1988) Cardelli, J. A., Clayton, G. C., & Mathis, J. S. 1988, ApJ, 329, L33
- Chevalier & Fransson (2008) Chevalier, R. A. & Fransson, C. 2008, ApJ, 683, L135
- Colgate (1974) Colgate, S. A. 1974, ApJ, 187, 333
- Couch et al. (2009) Couch, S. M., Wheeler, J. C., & Milosavljevi´c, M. 2009, ApJ, 696, 953
- Dessart et al. (2008) Dessart, L., et al. 2008, ApJ, 675, 644
- Dessart & Hillier (2005) Dessart, L., & Hillier, D. J. 2005, A&A, 437, 667
- Dessart & Hillier (2010) Dessart, L., & Hillier, D. J. 2010, MNRAS, 405, 2141
- Dessart et al. (2010) Dessart, L., Livne, El, & Waldman, R. 2010, MNRAS, 405, 2113
- Eldridge & Tout (2004) Eldridge, J. J., & Tout, C. A. 2004, MNRAS, 353, 87
- Falk (1978) Falk, S. W. 1978, ApJ, 225, L133
- Gezari et al. (2008) Gezari, S., et al. 2008, ApJ, 683, L131
- Ghisellini et al. (2007) Ghisellini, G., Ghirlanda, G., & Tavecchio, F. 2007, MNRAS, 382, L77
- Kasen & Woosley (2009) Kasen, D., & Woosley, S. E. 2009, ApJ, 703, 2205
- Klein & Chevalier (1978) Klein, R. I., & Chevalier, R. A. 1978, ApJ, 223, L109
- Magnier (2006) Magnier, E. 2006, in The Advanced Maui Optical and Space Surveillance Technologies Conference
- Matzner & McKee (1999) Matzner, C. D., & McKee, C. F. 1999, ApJ, 510, 379
- Mazzali et al. (2008) Mazzali, P., et al. 2008, Science, 321, 1185
- McGaugh (1991) McGaugh, S. S. 1991, ApJ, 380, 140
- Morrissey et al. (2007) Morrissey, P., et al. 2007, ApJS, 173, 682
- Nakar & Sari (2010) Nakar, E., & Sari, R. 2010, ArXiv e-prints, 1004.2496
- Pettini & Pagel (2004) Pettini, M., & Pagel, B. E. J. 2004, MNRAS, 348, L59
- Quimby et al. (2007) Quimby, R. M., Wheeler, J. C., H¨oflich, P., Akerlof, C. W., Brown, P. J., & Rykoff, E. S. 2007, ApJ, 666, 1093
- Rabinak & Waxman (2010) Rabinak, I., & Waxman, E. 2010, ArXiv e-prints, 1002.3414
- Rest et al. (2005) Rest, A., et al. 2005, ApJ, 634, 1103
- Schawinski et al. (2008) Schawinski, K., et al. 2008, Science, 321, 223
- Schmidt et al. (1992) Schmidt, B. P., Kirshner, R. P., & Eastman, R. G. 1992, ApJ, 395, 366
- Smartt et al. (2009) Smartt, S. J., Eldridge, J. J., Crockett, R. M., & Maund, J. R. 2009, MNRAS, 395, 1409
- Soderberg et al. (2008) Soderberg, A. M., et al. 2008, Nature, 453, 469
- Tominaga et al. (2009) Tominaga, N., Blinnikov, S., Baklanov, P., Morokuma, T., Nomoto, K., & Suzuki, T. 2009, ApJ, 705, L10
- Tremonti et al. (2004) Tremonti, C. A., et al. 2004, ApJ, 613, 898
- Utrobin & Chugai (2008) Utrobin, V. P. & Chugai, N. N. 2008, A&A, 491, 507
- Valenti et al. (2010) Valenti, S., et al. 2010, Central Bureau Electronic Telegrams, 2214, 1
- van Zee et al. (1998) van Zee, L., Salzer, J. J., Haynes, M. P., O’Donoghue, A. A., & Balonek, T. J. 1998, AJ, 116, 2805
- Waxman et al. (2007) Waxman, E., M´esz´aros, P., & Campana, S. 2007, ApJ, 667, 351
| Filter | Date (MJD) | (d)aaDays since MJD 55238.4 in the SN rest-frame. | mag bbAB magnitudes corrected for a Galactic extinction of E(B-V)=0.024 and the host galaxy contribution removed. Upper limits are given in parentheses. | 1 |
|---|---|---|---|---|
| NUV | 55235.42 | 2.8 | (22.69) | |
| NUV | 55237.54 | 0.8 | (22.68) | |
| NUV | 55239.32 | 0.8 | 21.06 | 0.18 |
| NUV | 55241.52 | 2.8 | 20.64 | 0.09 |
| NUV | 55249.66 | 10.3 | 21.69 | 0.17 |
| NUV | 55251.44 | 12.0 | 21.68 | 0.18 |
| NUV | 55259.52 | 19.4 | (22.48) | |
| NUV | 55261.64 | 21.4 | (22.37) | |
| NUV | 55266.98 | 26.3 | (22.14) | |
| NUV | 55271.98 | 30.9 | (22.55) | |
| NUV | 55277.39 | 35.9 | (22.36) | |
| g | 55236.48 | 1.8 | (24.00) | |
| g | 55239.48 | 1.0 | 21.63 | 0.08 |
| g | 55242.43 | 3.7 | 20.90 | 0.03 |
| g | 55248.43 | 9.2 | 21.00 | 0.03 |
| g | 55275.39 | 34.0 | 21.80 | 0.07 |
| g | 55290.38 | 47.8 | 22.00 | 0.24 |
| g | 55305.27 | 61.5 | 23.03 | 0.32 |
| r | 55236.49 | 1.79 | (23.90) | |
| r | 55239.50 | 1.0 | 21.74 | 0.07 |
| r | 55242.44 | 3.7 | 20.95 | 0.02 |
| r | 55248.44 | 9.2 | 20.93 | 0.03 |
| r | 55275.41 | 34.0 | 21.29 | 0.05 |
| r | 55305.29 | 61.6 | 21.92 | 0.11 |
| i | 55237.49 | 0.9 | (23.99) | |
| i | 55240.47 | 1.9 | 21.60 | 0.05 |
| i | 55243.33 | 4.5 | 20.90 | 0.03 |
| i | 55246.32 | 7.3 | 20.86 | 0.04 |
| i | 55249.48 | 10.2 | 20.76 | 0.03 |
| i | 55267.41 | 26.7 | 20.77 | 0.05 |
| i | 55288.39 | 46.0 | 20.88 | 0.05 |
| i | 55306.25 | 62.4 | 21.64 | 0.09 |
| i | 55321.27 | 76.3 | 22.42 | 0.14 |
| z | 55235.45 | 2.7 | (22.83) | |
| z | 55238.47 | 0.0 | 22.60 | 0.22 |
| z | 55241.39 | 2.7 | 21.42 | 0.07 |
| z | 55250.49 | 11.1 | 20.89 | 0.06 |
| z | 55259.33 | 19.2 | 20.92 | 0.05 |
| z | 55289.29 | 46.8 | 21.40 | 0.07 |
| z | 55298.34 | 55.2 | 21.53 | 0.10 |
| z | 55301.37 | 57.9 | 20.98 | 0.16 |
| z | 55304.26 | 60.6 | 21.70 | 0.08 |