Pulse-Shape Discrimination of CaF2(Eu)
Abstract
We measured the decay time of the scintillation pulses produced by electron and nuclear recoils in CaF2(Eu) by a new fitting method. In the recoil energy region 5–30 keVee, we found differences of the decay time between electron and nuclear recoil events. In the recoil energy region above 20 keVee, we found that the decay time is independent of the recoil energy.
keywords:
Dark matter, WIMP, CaF2(Eu), Scintillator, PSD1 Introduction
There is convincing evidence that most of the matter in our Galaxy must be dark matter. One of the most popular candidates for dark matter is Weakly Interacting Massive Particles (WIMPs). WIMPs are thought to be non-baryonic particles, and the most plausible candidates for them are the Lightest Supersymmetric Particles (LSPs) and the Lightest Kaluza-Klein Particles (LKPs)[1].
WIMPs can be searched for directly, as they interact with atomic nuclei in detectors. Direct detection relies on one of two modes of interaction with target nuclei. The first mode is called spin-independent (SI) coupling. It describes coherent interaction with the entire nuclear mass. Therefore the SI part of the WIMP-nucleus cross section is large, if the target nuclei have the large mass number. For example, xenon and iodine are the favorable nuclei to detect WIMPs for the SI interaction. The second mode is called spin-dependent (SD) coupling. It describes interaction of WIMP with the spin-content of the nucleus. Hence the SD part of the WIMP-nucleus cross section is large, if the spin-content of the target nuclei is large. For example, 19F is one of the most favorable nuclei to detect WIMPs for the SD interaction because of its large nuclear spin.
Several direct WIMP searches using 19F-based detectors, such as bolometers[2, 3], a bubble chamber[4], scintillators[5, 6, 7, 8, 9], a superheated droplet detector[10] and so on, have already been performed. In our group, a WIMP search experiment using a CaF2(Eu) scintillator is carried out at Kamioka observatory in 2005[5]. CaF2(Eu) is one of the most suitable material among 19F-based scintillator because of its high light-output.
In other direct WIMP searches, pulse shape discrimination (PSD) technique is used in order to statistically discriminate nuclear recoil signal events from electron recoil background events. A nuclear recoil event is different from an electron recoil event in decay time of their pulse shapes. In the PSD technique, a distribution of the decay time constant is utilized for the statistical discrimination. The PSD feature in CaF2(Eu) was reported in the MeV region[9, 11]. The pulse shape of CaF2(Eu) scintillator in lower energy region relevant to the dark matter WIMP search was measured previously by Tovey et al. [12]. They reported that CaF2(Eu) has no PSD capability in the 10–30 keVee region. However, we recently measured the pulse shape of CaF2(Eu) and analysed our data by a more careful statistical method. In this paper, we report on the new measurement of CaF2(Eu) pulse shape and the analysis. We found a difference in the pulse shape of CaF2(Eu) between nuclear and electron recoil events.
2 Experimental methods
2.1 Measurement system

The scintillator sample consisted of an unencapsulated, double-ended, 20-mm-diameter, 20-mm-long crystal of CaF2(Eu) with europium doping content of 0.5%. The crystal was glued on two 2-inch photomultiplier tubes (Hamamatsu R329-02).
252Cf was used as a neutron source together with three detectors as shown in Fig. 1. Nuclear recoil candidates were selected by looking for coincidences between events in three detectors. The first one was the target CaF2(Eu). The second was a plastic scintillator, which detected prompt rays from fission decays of 252Cf. The last was a liquid scintillator (Saint-Gobain, BC-501A), which caught scattered neutrons from the target CaF2(Eu).
For the latter two detectors, Hamamatsu R329-02 photomultiplier tubes were also used. Signals from all the photomultiplier tubes were sent to fast discriminators with sufficiently low thresholds. A special care was taken to the two output signals of the CaF2(Eu) scintillator so as to suppress multiple trailing pulses due to its long decay time constant. A coincidence of these two discriminator outputs were taken to define the CaF2(Eu) scintillator hit with a coincidence width of 160 ns. Coincidence widths of the plastic scintillator and CaF2(Eu)scintillator, and the plastic scintillator and the liquid scintillator were set to 195 ns and 400 ns, respectively.
The photomultiplier outputs of the CaF2(Eu) and the liquid scintillators and the discriminator output of the plastic scintillator were recorded with a Tectronix TDS3034B digital oscilloscope with sampling frequency of 2.5 GHz and 300 MHz bandwidth by a trigger of the coincidence of three detectors. The pulse shape of the CaF2(Eu) scintillator and the timing of all the detectors are thus recorded and sent to a computer.
The estimated solid angles of the CaF2(Eu) scintillator as seen from the 252Cf source and of the liquid scintillator from the CaF2(Eu) scintillator are sr and sr, respectively. The scattering angle spanned by the three detectors was about 90 degrees. Between the plastic and liquid scintillators, polyethylene (PE) blocks (35 cm long) and Pb blocks (20 cm long) are placed in order to shield the liquid scintillator from neutrons coming directly from 252Cf.
2.2 Selection of nuclear recoils
We distinguished nuclear recoil events from electron recoil events using the time-of-flight (TOF) of the particle. The time-of-flight of the neutron from the 252Cf source to the liquid scintillator is
| (1) |
Here and are the times-of-flight of the neutron from the 252Cf source to the target scintillator and from the target scintillator to the liquid scintillator, and and are the respective lengths. In this measurement, and are 70 cm and 15 cm. and are the neutron energies before and after the collision with the nucleus in the target, and is the neutron mass. Then, the energy of the recoil nucleus is
| (2) |
when the scattering is elastic. Here is the recoil nucleus mass, and is the neutron scattering angle. In this measurement, since the recoil angle is around 90 degrees, the recoil energy is simply
| (3) |
Inelastic cross section is negligibly small in the neutron energy range[13] relevant to the present measurement and therefore ignored in the analysis.
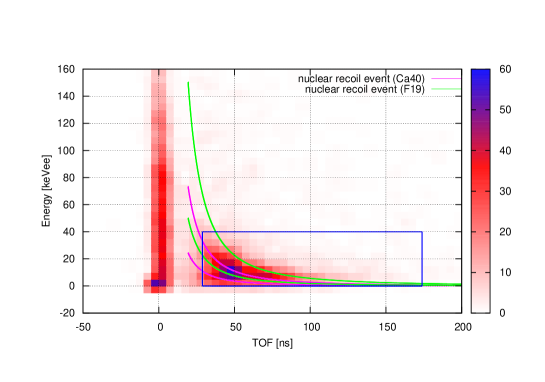
Density plots of the electron equivalent energy deposited in CaF2(Eu) versus TOF is shown in Fig. 2. Theoretical expectation curves are also show in the Fig. 2 for the 19F and 40Ca with quenching factors of 0.05 and 0.15. On the other hand, Compton scattering events in the CaF2(Eu) scintillator caused by gamma rays emitted by the 252Cf source are expected to gather in the region where TOF is 0 ns. Fig. 2 shows clear separation of the nuclear recoil events and the Compton scattering events.
To pickup the 19F and 40Ca recoil events, we put a rectangle where nuclear recoil events are expected. Consequently, we obtained enough pulse shapes for the PSD analysis.
2.3 New method of PSD
A pulse shape of scintillation is formed by a train of small single-photoelectron pulses. The arrival time relative to the pulse start time of each pulse follows an exponential distribution. Hence, the scintillation pulse shape has a characteristic time constant, which is different between electron and nuclear recoil events.
In many researches, integrated pulse is used for analysis, and an exponential rise function is fitted to the data by the least-squares method[14]. This analysis is statistically not strictly correct because integrated data points are not independent of each other. Therefore, the data themselves before integration must be used for the fitting analysis.
However, because the scintillation of CaF2(Eu) is not bright enough and has large decay constant, it is difficult to fit an exponential fall function to all the data points by the least-squares method. So we divided a train of data points of the oscilloscope into 40 ns bins, and fitted the estimate number of photoelectrons in each bin calculated by an exponential fall function to the data by the maximum-likelihood method via two parameters, the estimate value of the first bin and the decay time constant.
The number of photoelectrons in each bin follows a Poisson distribution. So the probability distribution function of the observed charge in -th bin is
| (4) |
where is the estimate value of the number of photoelectrons in the -th bin. is a Poisson distribution function of with the mean value of , and is a Gaussian distribution of with the mean value of and dispersion . , , and are the parameters for the conversion of the number of photoelectrons to the charge recorded by the oscilloscope. and are the pedestal and its width, and and are one photoelectron response and its standard deviation. These four parameters are characteristic of PMTs and they were measured by a single photoelectron spectra analysis independently[15]. Tab. 1 shows the typical values of , , and as measured in electron equivalent deposit energy. The , and values are stable within , and in measurement after over a year, respectively.
| Parameter | PMT ch.1 [keV] | PMT ch.2 [keV] |
|---|---|---|
From this, the likelihood function is
| (5) |
where is the bin width. The two parameters, (the estimate value of the photoelectron number in the first bin) and (the decay time constant), are evaluated when they maximize the likelihood function .
3 Result and discussion
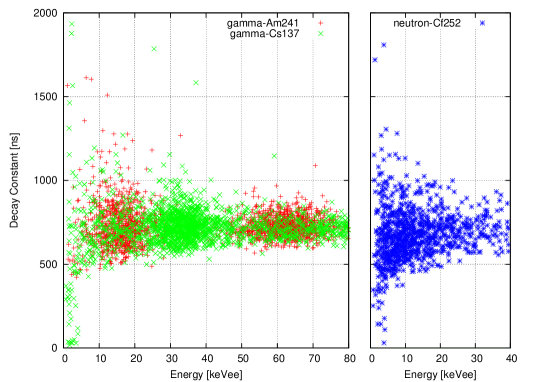
A sample of the result of the maximum likelihood fitting to the experimental data is shown in Fig. 3 for ray events with 241Am and 137Cs, and for selected neutron events with 252Cf. A difference is seen in the decay time distribution between electron and nuclear recoil events.
In order to see the difference more clearly, we divided the events into electron equivalent energy bins of 5 keV width, and evaluated the mean value of the decay constant in each bin. Exceptionally, we put regions of photoelectric absorption peaks, 13.9 keVee (241Am), 59.5 keVee (241Am) and 32.2–36.4 keVee (137Cs), into wider single bins. The distribution of the decay time constant can be approximated by a Gaussian in [16]:
| (6) |
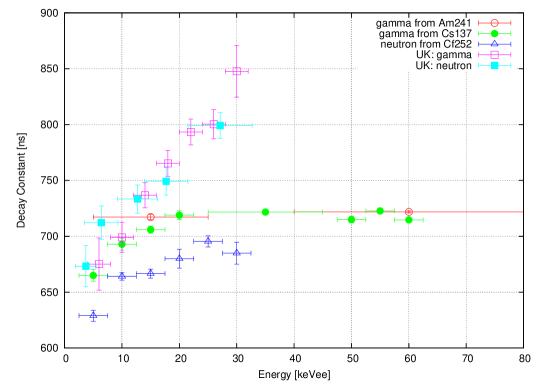
We evaluate three parameters, (the mean value of the exponent), (the number of events) and (a width parameter), in each bin by the least-squares method. Fig. 4 shows the evaluated mean decay time constants as a function of energy. There are marked differences of the decay time between electron and nuclear recoil events.
The results in Ref. [12] are also shown in Fig. 4. In their results, the differences are not seen. Moreover, the decay constants rise rapidly with energy from 660 ns to 850 ns. In the present work, a similar dependence exists in the low energy region, but it is weak.
Strictly speaking, because the pulse shape is not a single exponential curve, but the sum of a few exponential curves, the value of the decay time constant is dependent on the way of the analysis. So, the values of different measurements cannot be compared directly. However, these properties, the difference between the nuclear recoil and the electron recoil and the relation between the decay constant and the recoil energy, are independent of the way of the analysis.
4 Conclusion
We developed a new method to evaluate the decay time constant of scintillation and applied it to the CaF2(Eu) scintillator. We found the difference in the scintillation decay constants between electron and nuclear recoil events (Fig. 4). We also concluded that the decay time constant of CaF2(Eu) is constant in the recoil energy region above 20 keVee.
References
- [1] G. Bertone, D. Hooper, J. Silk, Phys. Rep. 405 (2005) 279–390.
- [2] A. Takeda, et al., Phys. Lett. B 572 (2003) 145–151.
- [3] K. Miuchi, et al., Astropart. Phys. 19 (2003) 135–144.
- [4] E. Behnke, et al., Science 319 (2008) 933–936.
- [5] Y. Shimizu, M. Minowa, W. Suganuma, Y. Inoue, Phys. Lett. B 633 (2006) 195–200.
- [6] P. Belli, et al., Nucl. Phys. B 563 (1999) 97–106.
- [7] R. Bernabei, et al., Astropart. Phys. 7 (1997) 73–76.
- [8] N. J. C. Spooner, D. R. Tovey, C. D. Peak, J. W. Roberts, Astropart. Phys. 8 (1997) 13–19.
- [9] C. Bacci, et al., Astropart. Phys. 2 (1994) 117–125.
- [10] S. Archambault, et al., arXiv.org:0907.0307 (2009).
- [11] P. Belli, et al., Nucl. Phys. A 789 (2007) 15–29.
- [12] D. R. Tovey, et al., Phys. Lett. B 433 (1998) 150–155.
- [13] CSEWG-Collaboration, http://www-nds.iaea.org/endf/, released in February 2010.
- [14] P. Smith, et al., Phys. Lett. B 379 (1996) 299–308.
- [15] S. Tokar, I. E. Chirikov-Zorin, I. Sykora, M. Pikna, Tech. Rep. ATL-TILECAL-99-005, CERN, Geneva (1999).
- [16] V. A. Kudryavtsev, et al., Phys. Lett. B 452 (1999) 167–172.