Detecting influenza outbreaks by analyzing Twitter messages
Abstract
We analyze over 500 million Twitter messages from an eight month period and find that tracking a small number of flu-related keywords allows us to forecast future influenza rates with high accuracy, obtaining a 95% correlation with national health statistics. We then analyze the robustness of this approach to spurious keyword matches, and we propose a document classification component to filter these misleading messages. We find that this document classifier can reduce error rates by over half in simulated false alarm experiments, though more research is needed to develop methods that are robust in cases of extremely high noise.
1 Introduction
There has been growing interest in monitoring disease outbreaks using the Internet. Previous approaches have applied data mining techniques to news articles (Grishman et al., 2002; Mawudeku and Blench, 2006; Brownstein et al., 2008; Reilly et al., 2008; Collier et al., 2008; Linge et al., 2009), blogs (Corley et al., 2010), search engine logs (Eysenbach, 2006; Polgreen et al., 2008; Ginsberg et al., 2009), and Web browsing patterns (Johnson et al., 2004). The recent emergence of micro-blogging services such as Twitter.com presents a promising new data source for Internet-based surveillance because of message volume, frequency, and public availability.
Initial work in this direction includes Ritterman et al. (2009), who show that Twitter messages can improve the accuracy of market forecasting models by providing early warnings of external events like the H1N1 outbreak. More recently, de Quincey and Kostkova (2009) have demonstrated the potential of Twitter in outbreak detection by collecting and characterizing over 135,000 messages pertaining to the H1N1 virus over a one week period, though no attempt is made to estimate influenza rates.
Two similar papers were recently published that estimate national influenza rates from Twitter messages (Lampos and Cristianini, 2010; Culotta, 2010). Both use linear regression to detect keywords that correlate with influenza rates, then combine these keywords to estimate national influenza rates. Lampos and Cristianini (2010) train and evaluate on a much larger data set (28 million messages) than used in Culotta (2010) (500K messages), which likely contributes to the differing quality of the estimates (97% correlation with national statistics on held-out data in Lampos and Cristianini (2010), 78% correlation in Culotta (2010)).
In this paper, we report results of our analysis of over 570 million Twitter messages collected in the 8 months from September 2009 to May 2010. This data was originally collected as part of the work of O’Connor et al. (2010), in which a strong correlation is revealed between certain Twitter messages and political opinion polls111We are extremely grateful to Brendan O’Connor for sharing this data with us..
The contributions of this paper are as follows:
-
•
We find that simple keyword matching produces a surprisingly high correlation with national statistics. For example, the proportion of Twitter messages containing the word “flu” produces a 84% held-out correlation with weekly influenza-like-illness statistics reported by the U.S. Centers for Disease Control and Prevention. Adding of a handful of other flu-related terms improves this to 95%.
-
•
Despite these strong correlations, we find that the methodology of selecting keywords based on their correlation with national statistics is flawed because of the high likelihood of detecting false correlations. For example, the phrase “flu shot” has a correlation greater than 90%, but certainly this is not a good term to monitor, as it may spike in frequency without a corresponding spike in influenza rates. Similar problems arise from events such as drug recalls and flu-related policy announcements, which receive a lot of discussion in social networks, but are not necessarily indicative of an increase in flu rates.
-
•
We propose a method to estimate robustness to false alarms by simulating false outbreaks like those described above. Using this measure, we show that by adding a document classification component to remove spurious keyword matches, we can reduce the severity of false alarms while preserving accurate forecasting estimates.
In Section 2, we first describe the national influenza statistics as well as the Twitter dataset. Then in Section 3, we describe the methodology of correlating Twitter messages with national statistics, and report correlations on a range of keyword combinations. In Section 4, we discuss the impact of spurious keywords on correlation results. In Section 5 we introduce and evaluate a document classifier to filter spurious messages. Finally, in Section 6 we provide results of false alarm simulations, finding that document filtering reduces mean-squared error by over half, while maintaining a 94% correlation with national statistics on held-out data.
2 Data
We begin with a description of the data used in all experiments.
2.1 Influenza Monitoring in the United States
The U.S. Centers for Disease Control and Prevention (CDC) publishes weekly reports from the US Outpatient Influenza-like Illness Surveillance Network (ILINet). ILINet monitors over 3,000 health providers nationwide to report the proportion of patients seen that exhibit influenza-like illnesses (ILI), defined as “fever (temperature of 100 F [37.8 C] or greater) and a cough and/or a sore throat in the absence of a known cause other than influenza.”222http://www.cdc.gov/flu/weekly/fluactivity.htm Figure 1 shows the ILI rates for the 36 week period from August 29, 2009 to May 8, 2010.
While ILINet is a valuable tool in detecting influenza outbreaks, it suffers from a high cost and slow reporting time (typically a one to two week delay). The goal of this line of research is to develop methods that can reliably track ILI rates in real-time using Web mining.
 |
 |
2.2 Twitter Data
Twitter.com is a micro-blogging service that allows users to post messages of 140 characters or less. Users can subscribe to the feeds of others to receive new messages as they are written. As of April 2010, Twitter reports having 105 million users posting nearly 65 million message per day, with roughly 300,000 new users added daily (Oreskovic, 2010).
There are several reasons to consider Twitter messages as a valuable resource for tracking influenza:
-
•
The high message posting frequency enables up-to-the-minute analysis of an outbreak.
-
•
As opposed to search engine query logs, Twitter messages are longer, more descriptive, and (in many cases) publicly available.
-
•
Twitter profiles often contain semi-structured meta-data (city, state, gender, age), enabling a detailed demographic analysis.
-
•
Despite the fact that Twitter appears targeted to a young demographic, it in fact has quite a diverse set of users. The majority of Twitter’s nearly 10 million unique visitors in February 2009 were 35 years or older, and a nearly equal percentage of users are between ages 55 and 64 as are between 18 and 24.333Twitter older than it looks. Reuters MediaFile blog, March 30th, 2009.
The Twitter messages used in this paper are a subset of those used in O’Connor et al. (2010), restricted to the 2009-2010 flu season from September 2009 to May 2010. O’Connor et al. (2010) gathered the messages through a combination of queries to Twitter’s public search API as well as messages obtained from their “Gardenhose” stream, a sample of all public Twitter messages.
Figure 1 shows the number of Twitter messages obtained per week for the same time frame as the ILI percentages. The average number of messages per week is 15.8 million. Due to difficulties in data collection, there are a few anomalies in the data, but even the smallest sample (week 1) contains 6.5 million messages.
3 Correlating keywords with ILI rates
In this section, we describe a simple methodology to correlate Twitter messages with ILI rates. Let be the true proportion of the population exhibiting ILI symptoms. In all experiments, we assume is the value reported by the CDC’s ILINet program.
Let be a set of keywords, let be a document collection, and let be the set of documents in that contain at least one keyword in . We define to be the fraction of documents in that match , which will refer to as the query fraction.
Following Ginsberg et al. (2009), we first consider a simple linear model between the log-odds of and :
| (1) |
with coefficients , error term , and logit function logit(X) .
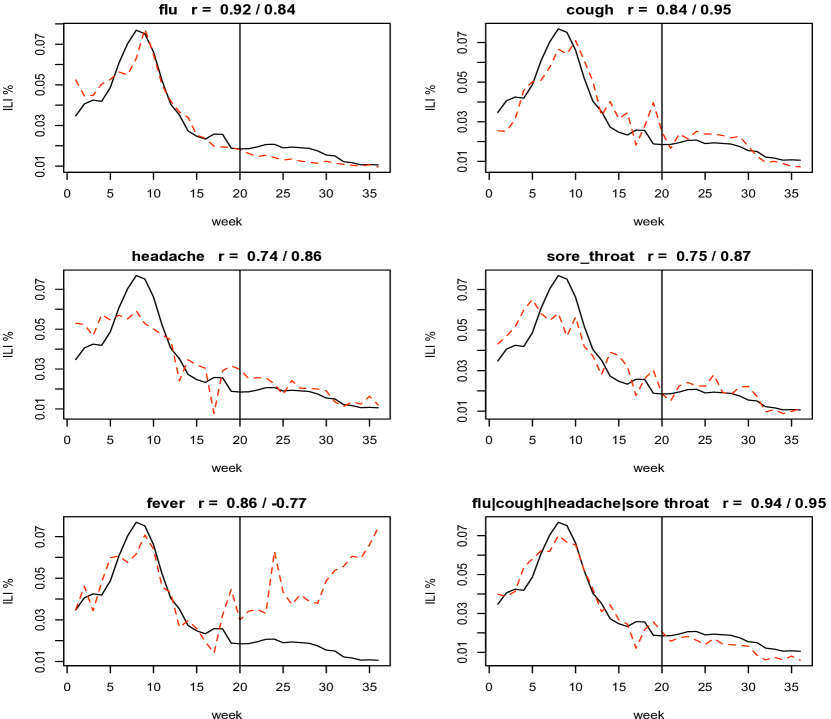
Figure 2 displays the result of this regression for a number of keywords. We fit the regression on weeks 1-20, and evaluate on weeks 21-36. In each figure, the black line is the true ILI rate, the red line is the fitted/predicted rate. The vertical line indicates the transition from training to evaluation data. The title of each plot indicates the query used as well as the training and evaluation correlation values.
These results show extremely strong correlations for all queries except for fever, which appears frequently in figurative phrases such as “I’ve got Bieber fever” (in reference to pop star Justin Bieber).
Because these results are competitive with those in Lampos and Cristianini (2010), who use a more complex methodology, the conclusion we draw from these results is that even extremely simple methods can result in quite accurate models of ILI rates from Twitter data.
4 Analysis of spurious matches
While these strong correlations are encouraging, we must be very careful about the conclusions we draw. Many of these correlations may be spurious. For example, a number of messages containing the term “flu” are actually discussing “flu shots”, “flu vaccines”, or are simply referencing news stories about the flu. While these type of messages may correlate with ILI rates, they are likely not the types of messages researchers have in mind when they report these correlations. Instead, the system would ideally track mentions of people reporting having the flu or flu-like symptoms, as opposed to simply mentioning the flu in passing.
These spurious correlations leave keyword-based methods extremely vulnerable to false alarms. For example, a recall of a flu vaccine, a governmental policy announcement regarding flu, or a release of a new flu shot will all lead to a spike in messages containing the word flu.
| query | # messages returned |
|---|---|
| flu | 387,405 |
| flu +(swine h1n1) | 198,149 |
| flu +shot | 37,010 |
| flu +vaccine | 35,102 |
| flu +season | 11,850 |
| flu +http | 166,123 |
| flu -(swine h1n1 shot vaccine season http) | 126,194 |
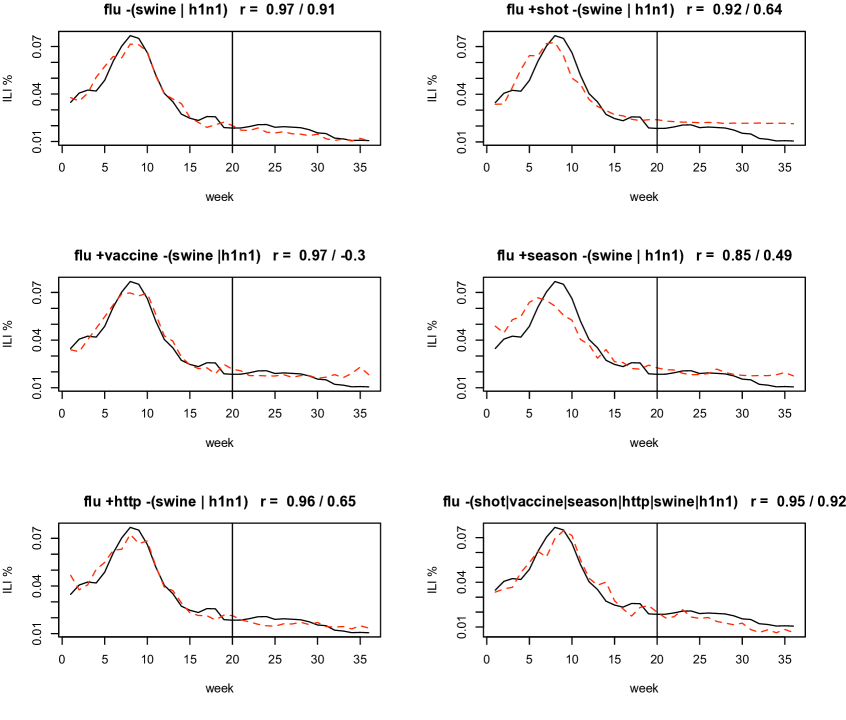
Figure 3 displays regression results for a number of potential spurious keywords, such as swine or H1N1, shot, vaccine, season, and http (to heuristically filter messages that are simply linking to stories about the flu). Because of the large amount of noise introduced by discussion of the H1N1 virus, we have filtered those terms from all results in this figure. Table 1 shows the total number of messages matching each of the queries.
We make two observations concerning Figure 3. First, notice that removing messages containing the terms “swine” and “H1N1” greatly improves correlation on both the training and evaluation data over using the query “flu” alone (training correlation improves from .93 to .97, evaluation improves from .84 to .91).
Second, notice that removing the other spurious terms does not obviously result in a better fit of the data. In fact, the training correlation declines by .02, and the evaluation correlation improves by .01. This result emphasizes the need to explicitly test for robustness in the presence of false alarms, since other measures do not penalize these spurious terms. We propose such a measure in Section 6.
5 Filtering spurious matches by supervised learning
We propose a first step to mitigate the spurious message problem by training a document classifier to label whether a message is reporting an ILI-related event or not. This is related to problems such as sentiment analysis (Pang and Lee, 2008) and textual entailment (Giampiccolo et al., 2007), which in their most general form can be quite difficult due to the ambiguities and subtleties of language. We limit this difficulty somewhat here by only considering documents that have already matched the hand-chosen ILI-related terms flu, cough, headache, sore throat. The classifier then calculates a probability that each of these messages is in fact reporting an ILI symptom.
We train a bag-of-words document classifier using logistic regression to predict whether a Twitter message is reporting an ILI symptom. Let be a binary random variable that is 1 if document is a positive example and is 0 otherwise. Let be a vector of observed random values, where is the number of times word appears in document . We estimate a logistic regression model with parameters as:
| (2) |
We learn using L-BFGS gradient descent (Liu and Nocedal, 1989) as implemented in the MALLET machine learning toolkit444http://mallet.cs.umass.edu.
5.1 Combining filtering with regression
We consider two methods to incorporate the classifier into the regression model in Equation 1. The first method, which we term soft classification, computes the expected fraction of positively classified documents as
| (3) |
This procedure can be understood as weighting each matched document in by the probability that it is a positive example according to the classifier.
The second method, which we term hard classification, simply uses the predicted label for each document, ignoring the class probability. For the binary case, this simply counts the number of documents for which the probability of the positive class is greater than 0.5:
| (4) |
For both methods, we substitute in Equation 1 with the corresponding classification quantity from Equation 3 or 4.
| Positive Examples |
|---|
| Headache, cold, sniffles, sore throat, sick in the tummy.. Oh joy !! :’ ( |
| me too… i have a headache my nose is stopped up and it hurts to swallow :/ |
| im dying , got flu like symptoms, had to phone in ill today coz i was in yest n was ill and was making mistakes :( |
| Negative Examples |
| swine flu actually has nothing to do with swine. #OMGFACT to the point where they tried to rename the virus |
| Links between food, migraines still a mystery for headache researchers http://ping.fm/UJ85w |
| are you eating fruit breezers. those other the yummy ones haha. the other ones taste like well, cough drops haha. |
| Accuracy | F1 | Precision | Recall |
| 84.29 (1.9) | 90.2 (1.5) | 92.8 (1.8) | 88.1 (2.0) |
5.2 Filtering Results
To generate labeled data for the classification model of Section 5, we searched for Twitter messages containing any of flu, cough, headache, sore throat, making sure the messages were posted outside of the date range of the previously collected messages. This resulted in 206 messages, which were manually categorized into 160 positive examples and 46 negative examples. (Examples are shown in Table 2.) Results of 10-fold cross-validation on this data are shown in Table 3.
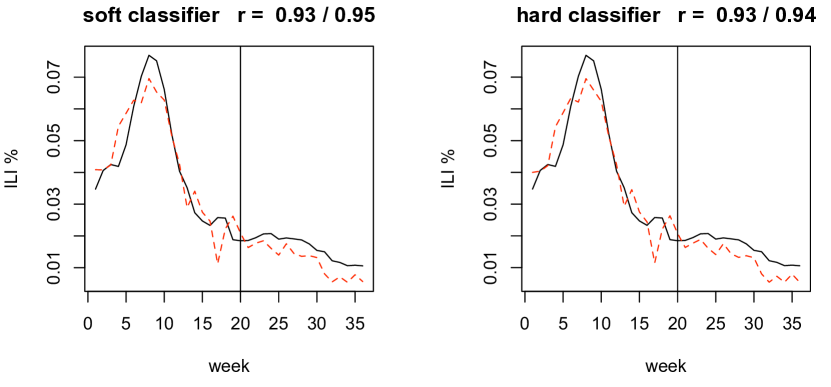
Figure 4 shows the results of both classification strategies. Note that the initial set of documents are collected by using the query of the final graph in Figure 2 (flu or cough or headache or sore throat). By comparing these two graphs with the corresponding one in Figure 2, we can see that all three methods perform similarly on this data. This suggests that filtering out spurious messages does not hurt performance, and that there likely exists a true underlying correlation between Twitter messages and ILI rates. The fact that filtering does not improve performance may suggest that there are no significant spikes in messages that would lead to a false alarm in the evaluation data.
6 Evaluating false alarms by simulation
In this section, we evaluate how well the methods proposed in the previous section filter spikes in spurious messages. Because false alarms are by definition rare events, it is difficult to use existing data to measure this. Instead, we propose simulating a false alarm as follows:
-
•
We first sample 1,000 messages deemed to be spurious.555We do this by searching for messages containing flu or cough or headache or sore throat sent by users that were news services (e.g., Reuters News). Additionally, we searched for messages containing associated press, AP, or health officials.
-
•
Next, we sample with replacement an increasing number of these spurious messages and add them to the original message set. The resulting dataset will add different numbers of spurious messages to different weeks.
-
•
Finally, we use the same trained regression models from Figure 4 to estimate the ILI rates for each of these synthetic datasets.
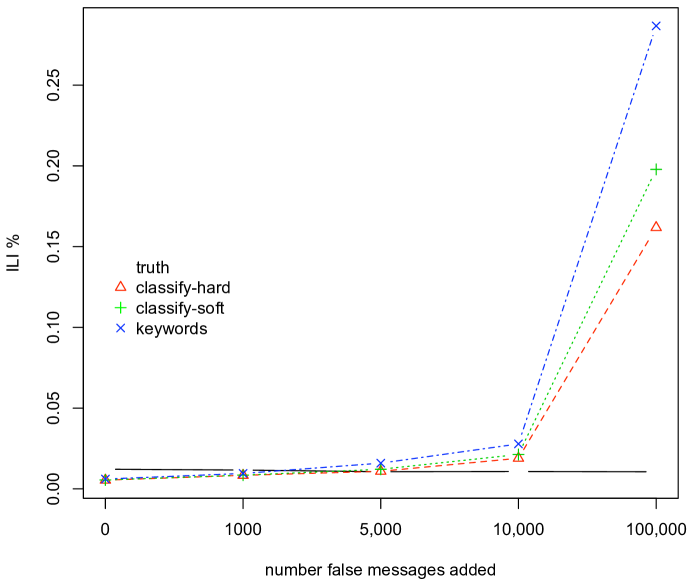
Figure 5 shows the result of this approach for both classification methods as well as the original keyword based method (which does no filtering). We simulate weeks 32-36, which have been augmented with 0, 1000, 5000, 10,000, and 100,000 spurious messages. We make two observations of these results. First, hard classification appears to do a better job than soft classification, most likely because removing any document with probability below 0.5 results in a much more aggressive filter. Second, it is clear that none of the methods are adequate under extreme conditions. An additional 100,000 spurious messages overwhelms all approaches and produces an invalid spike in ILI estimates. We leave investigation of further improvements for future work.
7 Related Work
Lampos and Cristianini (2010) perform a similar analysis of Twitter message to track influenza rates in the U.K. They learn a “flu-score” for each document by learning weights for each word by their predictive power on held-out data. Using a set of 41 hand-chosen “markers”, or keywords, they obtain a correlation of 92% with statistics reported by the U.K.’s Health Protection Agency. Additionally, they obtain a correlation of 97% by using automated methods to select additional keywords to track (73 in total), similar to the methodology of Ginsberg et al. (2009). In this paper, we have presented a simpler scheme to track flu rates and have found a comparable level of correlation as in Lampos and Cristianini (2010). A principal distinction of this paper is our attempt to address the issue of false alarms using supervised learning.
In an earlier version of our work (Culotta, 2010), we perform a similar analysis as in Lampos and Cristianini (2010), also experimenting with automated methods to select keywords to track. We also report an improved correlation by using a classifier to filter spurious messages. In this paper, we have used similar techniques on a much larger dataset (570 million vs. 500K). We have also more closely evaluated the impact of false alarms on these types of methods.
This paper, as well as Lampos and Cristianini (2010) and Culotta (2010), are similar in methodology to Ginsberg et al. (2009), who track flu rates over five years by mining search engine logs, obtaining a 97% correlation with ILI rates on evaluation data. Extending these methods to Twitter, blogs, and other publicly available resources has the benefit of measuring how different data sources affect the quality of predictions.
Corley et al. (2010) track flu rates by examining the proportion of blogs containing two keywords (influenza and flu), obtaining a correlation of 76% with true ILI rates. It is possible that the brevity of Twitter messages make them more amenable to simple keyword tracking, and that more complex methods are required for blog data.
8 Conclusions and Future Work
In this paper, we have provided evidence that relatively simple approaches can be used to track influenza rates from a large number of Twitter messages, with the best method achieving 95% correlation on held-out data. We have also proposed a supervised learning approach to reduce the burden of false alarms, and through simulation experiments we have measured the robustness of this approach. These results suggest that while document classification can greatly limit the impact of false alarms, further research is required to deal with extreme cases involving a large number of spurious messages.
In future work, we plan to consider more sophisticated language processing approaches to document filtering. Additionally, we plan to investigate temporal models to further improve forecasting accuracy.
9 Acknowledgements
We would like to thank Brendan O’Connor from Carnegie Mellon University for providing access to the Twitter data and Troy Kammerdiener of Southeastern Louisiana University for helpful discussions in early stages of this work. This work was supported in part by a grant from the Research Competitiveness Subprogram of the Louisiana Board of Regents, under contract #LEQSF(2010-13)-RD-A-11.
References
- Brownstein et al. (2008) J.S. Brownstein, C.C. Freifeld, B.Y. Reis, and K.D. Mandl. Surveillance sans frontieres: Internet-based emerging infectious disease intelligence and the HealthMap project. PLoS Medicine, 5:1019–1024, 2008.
- Collier et al. (2008) N Collier, S Doan, A Kawazeo, R Goodwin, M Conway, Y Tateno, Hung-Q Ngo, D Dien, A Kawtrakul, K Takeuchi, M Shigematsu, and K Taniguchi. BioCaster: detecting public health rumors with a web-based text mining system. Bioinformatics, 2008.
- Corley et al. (2010) C. Corley, D. Cook, A. Mikler, and K. Singh. Text and structural data mining of influenza mentions in web and social media. International Journal of Environmental REsearch and Public Health, 7(2):596–615, 2010.
- Culotta (2010) Aron Culotta. Towards detecting influenza epidemics by analyzing twitter messages. In KDD Workshop on Social Media Analytics, 2010.
- de Quincey and Kostkova (2009) Ed de Quincey and Patty Kostkova. Early warning and outbreak detection using social networking websites: the potential of twitter, electronic healthcare. In eHealth 2nd International Conference, Instanbul, Tirkey, September 2009.
- Eysenbach (2006) G. Eysenbach. Infodemiology: tracking flu-related searches on the web for syndromic surveillance. In AMIA: Annual symposium proceedings, pages 244–248, 2006.
- Giampiccolo et al. (2007) Danilo Giampiccolo, Bernardo Magnini, Ido Dagan, and Bill Dolan. The third pascal recognizing textual entailment challenge. In Proceedings of the ACL-PASCAL Workshop on Textual Entailment and Paraphrasing, pages 1–9, Prague, June 2007.
- Ginsberg et al. (2009) Jeremy Ginsberg, Matthew H. Mohebbi, Rajan S. Patel, Lynnette Brammer, Mark S. Smolinski, and Larry Brilliant. Detecting influenza epidemics using search engine query data. Nature, 457, February 2009.
- Grishman et al. (2002) R Grishman, S Huttunen, and R Yangarber. Information extraction for enhanced access to disease outbreak reports. Journal of Biomedical Informatics, 35(4):236–246, 2002.
- Johnson et al. (2004) H Johnson, MM Wagner, WR Hogan, W Chapman, RT Olszewski, J Dowling, and G Barnas. Analysis of web access logs for surveillance of influenza. MEDINFO, pages 1202–1206, 2004.
- Lampos and Cristianini (2010) Vadileios Lampos and Nello Cristianini. Tracking the flu pandemic by monitoring the social web. In 2nd IAPR Workshop on Cognitive Information Processing (CIP 2010), pages 411–416, 2010.
- Linge et al. (2009) JP Linge, R Steinberger, TP Weber, R Yangarber, E van der Goot, DH Khudhairy, and NI Stilianakis. Internet surveillance systems for early alerting of health threats. Eurosurveillance, 14(13), 2009.
- Liu and Nocedal (1989) D. C. Liu and J. Nocedal. On the limited memory BFGS method for large scale optimization. Math. Programming, 45(3, (Ser. B)):503–528, 1989.
- Mawudeku and Blench (2006) A. Mawudeku and M. Blench. Global public health intelligence network (GPHIN). In 7th Conference of the Association for Machine Translation in the Americas, 2006.
- O’Connor et al. (2010) Brendan O’Connor, Ramnath Balasubramanyan, Bryan R. Routledge, and Noah A. Smith. From Tweets to polls: Linking text sentiment to public opinion time series. In International AAAI Conference on Weblogs and Social Media, Washington, D.C., 2010.
- Oreskovic (2010) Alexei Oreskovic. Twitter snags over 100 million users, eyes money-making. Reuters, April 2010.
- Pang and Lee (2008) Bo Pang and Lillian Lee. Opinion mining and sentiment analysis. Foundations and Trends in Information Retrieval, 2(1–2):1–135, 2008.
- Polgreen et al. (2008) PM Polgreen, Y Chen, DM Pennock, and ND Forrest. Using internet searches for influenza surveillance. Clinical infectious diseases, 47:1443–1448, 2008.
- Reilly et al. (2008) AR Reilly, EA Iarocci, CM Jung, DM Hartley, and NP Nelson. Indications and warning of pandemic influenza compared to seasonal influenza. Advances in Disease Surveillance, 5(190), 2008.
- Ritterman et al. (2009) Joshua Ritterman, Miles Osborne, and Ewan Klein. Using prediction markets and Twitter to predict a swine flu pandemic. In 1st International Workshop on Mining Social Media, 2009.