A Spectroscopic Search for Leaking Lyman Continuum at
Abstract
We present the results of rest-frame, UV slitless spectroscopic observations of a sample of 32 0.7 Lyman break galaxy (LBG) analogs in the COSMOS field. The spectroscopic search was performed with the Solar Blind Channel (SBC) on Hubble Space Telescope. We report the detection of leaking Lyman continuum (LyC) radiation from an AGN-starburst composite. While we find no direct detections of LyC emission in the remainder of our sample, we achieve individual lower limits () of the observed non-ionizing UV to LyC flux density ratios, (1500Å )/(830Å ) of 20 to 204 (median of 73.5) and 378.7 for the stack. Assuming an intrinsic Lyman break of 3.4 and an intergalactic medium (IGM) transmission of LyC photons along the line of sight to the galaxy of we report an upper limit for the relative escape fraction in individual galaxies of and a stacked upper limit of . We find no indication of a relative escape fraction near unity as seen in some LBGs at . Our UV spectra achieve the deepest limits to date at any redshift for the escape fraction in individual sources. The contrast between these low escape fraction LBG analogs with LBGs suggests that either the processes conducive to high are not being selected for in the samples or the average escape fraction is decreasing from to . We discuss possible mechanisms which could affect the escape of LyC photons.
Subject headings:
cosmology: observations — galaxies: evolution — ultraviolet: galaxies1. Introduction
Reionization brought an end to the cosmic “dark ages,” during which the Universe contained a mostly neutral intergalactic medium (IGM). This transition is thought to be triggered by either the radiation from QSOs or from galaxies containing large populations of massive stars. Recent determinations of the high redshift QSO luminosity function suggest that QSO space densities are too low to reionize the universe at (Willott et al., 2010; Brusa et al., 2009; Siana et al., 2008; Jiang et al., 2008), with the exception of Glikman et al. (2010). The contribution of galaxies to the ionizing UV background (Madau et al., 1999) depends upon how many of the Lyman continuum (LyC) photons produced by massive young stars escape a galaxy, evading absorption by neutral hydrogen atoms or dust grains. Direct measurement of the escape fraction, , is impossible at the epoch of reionization, because intervening absorbers make the IGM opaque to LyC photons. Instead, must be measured at lower redshifts () in objects that are analogous to the galaxies responsible for reionization.
Detection of escaping LyC photons has eluded most surveys. Observations of Lyman break galaxies (LBGs) at (Steidel et al., 2001; Shapley et al., 2006; Iwata et al., 2009) suggest that in 10% of starbursts the escape fraction is quite large, nearing unity. In contrast, there are currently no LyC detections locally (), despite tremendous effort (Leitherer et al., 1995; Giallongo et al., 1997; Deharveng et al., 2001; Malkan et al., 2003; Siana et al., 2007; Cowie et al., 2009, see Siana et al. 2010 for a review). One explanation suggested by several authors is that the cosmic average escape fraction evolves with redshift (Inoue et al., 2006; Siana et al., 2007, 2010). One notable difference between high and low redshift studies of the escape fraction is the wavelength range used to measure the LyC flux. All previous surveys searching for intermediate redshift LyC leaking galaxies have utilized broad-band photometry which probe Å while studies measure the LyC just below the Lyman limit. Probing these shorter wavelengths increases the sensitivity to the star formation history, dust extinction and IGM absorption. This means a decrease in star formation within the last 10 Myr would significantly lower the flux at 700Å compared to 900Å , weakening the LyC limits measured from broad-band photometry. It is with this difference in mind that we have undertaken a large spectroscopic program with the Hubble Space Telescope (HST) to study the escape fraction in luminous starbursts at (GO 11236; PI:Teplitz).
Using the Solar Blind Channel (SBC) of the Advanced Camera for Surveys (ACS), we have obtained far-ultraviolet (FUV) spectra of 32 starbursts chosen to be good analogs of LBGs. The observations presented in this paper cover rest-frame 750-1100 Å , and provide the first spectroscopic search for LyC photons from galaxies at , as well as the deepest limits on the escape fraction for individual galaxies at any redshift. Spectroscopy has an advantage over broad-band imaging by being able to probe closer to the Lyman limit (up to 880Å versus 700Å ), while being on-board HSTprovides high spatial resolution making it possible to study any offset of LyC radiation compared to UV emission. The large sample size provides enough number statistics to make a meaningful comparison with the rare, high-z, LBG detections.
While no LyC flux is conclusively detected (excluding the detection in an AGN-starburst galaxy), we use these spectra to place strict limits on the UV (1025Å) to LyC (Å) ratio and infer the limit on the escape fraction of ionizing photons. In Section 2, we describe the selection of LBG-analog targets; in Section 3, we present the observations and data reduction. The method of measuring limits on the escape fraction is presented in Section 4. In Sections 5 and 6, we give the results and discuss their implications. A cosmology of , and =70 km s-1 Mpc-1 is assumed throughout.
2. Sample Selection
Our aim was to chose galaxies at moderate redshift that are analogs to the LBG population, which is conventionally taken as accessible analogs to galaxies. Probing analogs provides the opportunity for a wide range of observations, together with the opportunity to study the possible evolution of the escape fraction with redshift. Hoopes et al. (2007) demonstrated the similarity between LBGs and the compact subset of local UV luminous galaxies (UVLG; Heckman et al., 2005). These sources share many properties with LBGs including luminosity, size, specific star formation rate (SFR), mass, and metallicity Heckman et al. (2005). The compact UVLG population is quite rare locally (about 1 per square degree at ), but its numbers increase with redshift. They are identified by their UV luminosity ( ) and surface brightness ( kpc-2) Hoopes et al. (2007) .
The wavelength range of the SBC/PR130L configuration limits the redshift range in which we can measure the LyC to . Furthermore, SBC prism spectra are slitless, introducing a smearing effect, whereby the spectral resolution is degraded proportional to the spatial extent of the target. Thus, we further restricted our selection to compact galaxies, which is in line with the LBG analog selection.
To choose appropriate targets, we needed access to deep UV photometry, good redshift estimates, and a measure of compactness and surface brightness. These three datasets are available in the COSMOS field (Scoville et al., 2007). We derived the UV luminosity from Galex Evolution Explorer (GALEX) photometry (Zamojski et al., 2007), the size from HST(F814W) imaging (Koekemoer et al., 2007) and an accurate photometric redshift with the COSMOS 30+ band photometry (Mobasher et al., 2007).
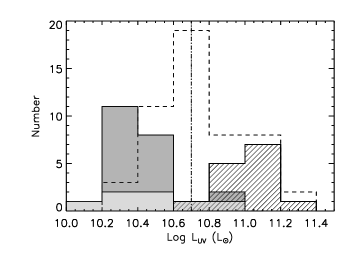
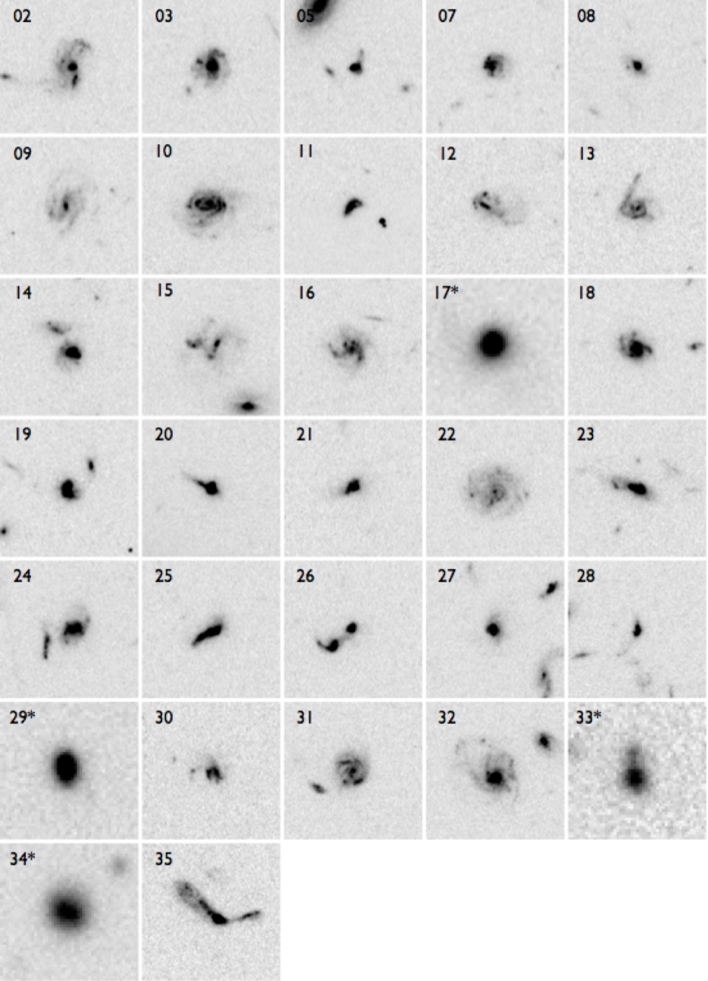
We selected non-point sources with large and analogous to LBGs (Figure 1 ). After visual inspection we discarded 15 sources for technical reasons not obvious in the catalog, such as a close proximity to the edge of the GALEX field of view which suffers from artifacts. There are 32 sources remaining which meet our criteria. These sources are the brightest UV galaxies at , but their luminosity (log ) is similar to that of typical LBGs at . An galaxy at would fall at the faint end of the same range. The UV luminosity of the targets corresponds to a SFR of 8–45 M⊙yr-1, without correcting for dust extinction.
The 32 selected galaxies (Figure 2) share many observable properties with LBGs. By inference, they are the rare, young, strongly star-forming objects at moderate redshift that have just reached an evolutionary stage which was common at .
3. Observations and Reductions
3.1. Slitless UV Spectroscopy
The SBC uses a Multi-Anode Microchannel Array (MAMA) that has no read noise and is not sensitive to cosmic rays. Targets were positioned to land on the lower right quadrant of the detector to minimize the dark current “glow”, which was noted by Teplitz et al. (2006) to increase with exposure time.
The SBC field of view is , with a plate scale of 032 pixel-1. The SBC PR130L, which covers 1250 - 2000Å with a variable dispersion from 1.65Å pixel-1 at 1250Å to 20.2Å pixel-1 at 1800Å, is used because it is not sensitive to the Ly airglow which dominates the background in the PR110L prism. The PR130L prism is still sensitive to other airglow lines so the observations were taken with the SHADOW constraint reducing the airglow by a factor of 10.
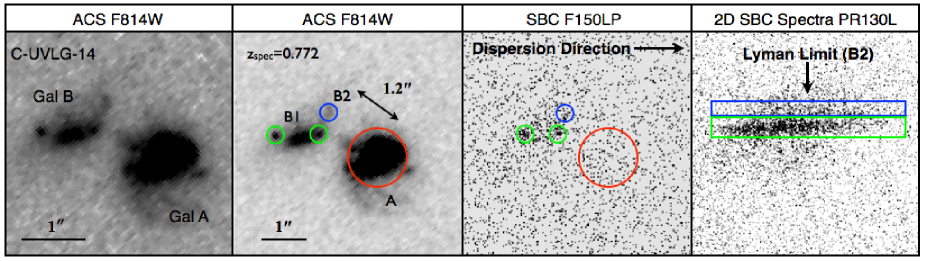
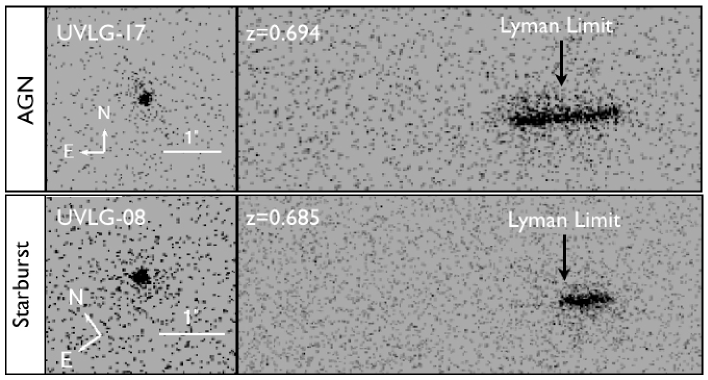
The sources have a median GALEX near-UV magnitude of 22.5 (AB), and required 1-4 HST orbits in the shadow position (1500s/orbit; see Table 1 for details). Direct imaging (two 480s exposures/orbit) of our targets at 1600Å was also acquired in the same visit with the F150LP filter to establish a zero point of the wavelength scale. These data were taken over 2007 December - 2009 January in Cycle 16. An example of the direct SBC image and corresponding two-dimensional spectra is shown in Figure 3 for a typical starburst galaxy in our sample and the target which is an AGN-starburst composite (also see Figure 4 and Section 5.1 for a discussion).
The flat-fielding and dark subtraction of the SBC data were performed by the HST pipeline. Since this work relies on the measurement of flux below the Lyman limit, and our observations are background limited sky subtraction must be done with care. The mean value for a region of sky, typically 300 pixels 150 pixels above and below the target, is measured for each prism exposure. The average sky background in each individual exposure is subtracted from each flat-fielded prism image. The spectra were extracted in PyRAF using the aXe slitless spectroscopy reduction package (ver. 1.6 Walsh et al., 2006; Kümmel et al., 2006), specifically designed for HST grism and prism data.
In the extraction, the position of the galaxy on the direct image is used in combination with the header dither parameters to locate the spectrum on the dispersed image and assign a wavelength to each pixel in the spectrum. The spectral trace and wavelength solutions are defined with respect to a reference position, which is measured by running SExtractor (Bertin & Arnouts, 1996) on a direct image for each orbit. A master catalog was generated for each set of prism images taken in a single orbit. Using the master catalogs, the aXe software generates pixel extraction tables (PETs), which contain a spectral mapping for each pixel in the spectrum. Various sizes for the extraction window were explored, with an extraction width approximately the size of the object maximizing the signal to noise of the spectra. The signal to noise was further increased (a factor of 1.4) by using aXe’s optimal weighting extraction, which weights the pixels as a function of distance from the spectral trace rather than giving each pixel the same weight when generating the one dimensional spectra. The wavelength solution over 1300-1700Å is accurate to within a few angstroms. The spectra were flux calibrated using the standard sensitivity curve for the PR130L prism (Larsen et al., 2006).
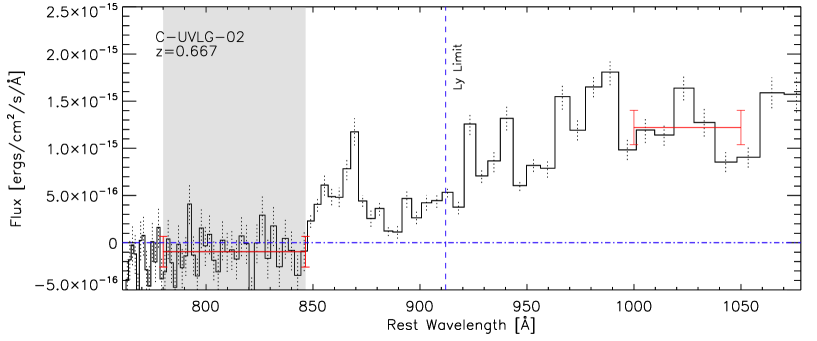
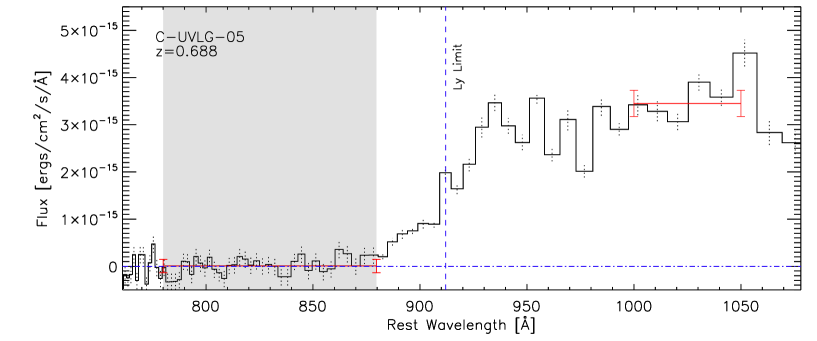
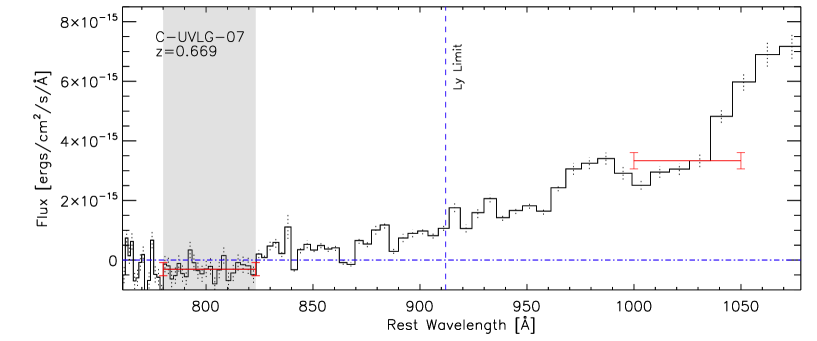
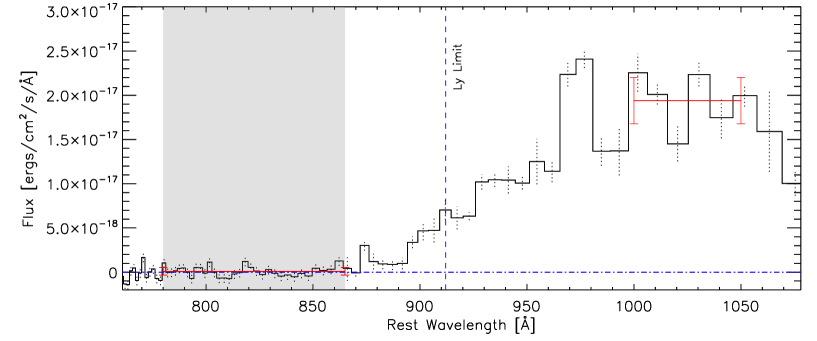
The flux and wavelength-calibrated spectra for each prism image were co-added weighting each exposure by the rms of the background in each individual exposure. This was done to account for increasing dark current with subsequent exposures. For an individual target the dark current was a factor of 4 higher in the forth orbit compared to the first. The uncertainty in the spectral flux was estimated differently for the wavelength regions redward and blueward of the Lyman limit. Blueward of 912Å, where we typically measured no signal (i.e., no detection of LyC) we are essentially probing the background. We extracted regions of blank sky and found that the standard deviation of the sky flux between the observed wavelengths typically used to measure the LyC in our sample was comparable to the standard deviation of the flux in our galaxies. We therefore use the standard deviation of the flux between 780 and 860Å rest frame (the region used to measure LyC flux limits) as a conservative estimate of the uncertainty. However, redward of the Lyman break, where flux is detected, the errors at each wavelength bin in the final one-dimensional co-added spectra are the standard deviation since there were larger. The final one-dimensional spectra are presented in Figure 5.
3.2. Optical Spectroscopy
Accurate spectroscopic redshifts are required to identify the observed wavelengths corresponding to the rest-frame Lyman limit and LyC. Redshifts cannot be measured from the FUV spectra themselves since the prism probes blueward of Ly in the rest frame and the resolution is too poor for the identification of absorption lines. The photometric redshifts, although sufficient for selection purposes, have an uncertainty corresponding to 200Å at . Optical spectroscopy for six of our targets were taken from the public zCOSMOS program111Based on zCOSMOS observations carried out using the Very Large Telescope at the ESO Paranal Observatory under program ID: LP175.A-0839 (Lilly et al., 2009). An additional 23 spectra were obtained at the Palomar Hale 5 m Telescope using the Double Spectrograph (hereafter Double Spec; Oke & Gunn, 1982) in 2008 and 2009 February with seeing conditions ranging from 1′′ to 25 for the majority of the observations and light cirrus. This instrument uses a pair of CCD cameras which simultaneously obtain long-slit spectra over a “blue” range of 3500- 5600Å and a “red” range of 6000-8500Å . The observing strategy consisted of acquiring a series of 600-900s exposures with a slit width of 15. We obtained a total integration time of 40-90 minutes for each of the 23 galaxies.
The data were reduced using standard IRAF tasks and wavelength calibrated with He, Ne, and Ar reference lamps. The spectral features used for the redshift determination were typically a combination of O[II] at 3727Å , O[III] at 5007Å and in some cases H at 4861Å . The spectroscopic redshifts confirmed that all the observed galaxies were within the range needed to measure the escape fraction with the UV observations. The mean spectroscopic redshift of the sample is . Due to poor observing conditions, three targets remain with no spectroscopic redshift confirmation. Since only one of these (C-UVLG-15) had a detectable UV spectrum and the rest of the sample had photometric redshifts within a few percent of the spectroscopic redshift we assumed the photometric redshift for this galaxy.
4. Deriving The Escape Fraction
Typically, the escape fraction of LyC photons is measured relative to the number of photons escaping at 1500Å (Steidel et al., 2001). This allows a straightforward calculation of the escape fraction with only two flux measurements (at 1500Å and in the LyC) using the following equation:
| (1) |
where and are the intrinsic and observed LyC flux density ratios. The “LyC” refers to the wavelength at which LyC is measured (780-860Å for this study), is the scaling factor discussed below and is the IGM optical depth for LyC photons along the line of sight to the galaxy. The intrinsic drop between the rest-frame FUV (1500Å ) and the LyC (700-900Å ) is highly uncertain and cannot be observed. The assumed value of (1500Å )/(LyC) has varied by study from 3 (Steidel et al., 2001; Shapley et al., 2006) to 6 or 8 (Siana et al., 2007).
Since we probe LyC radiation at slightly bluer wavelengths, at 830Å compared with (Steidel et al., 2001; Shapley et al., 2006), we used the spectral energy distributions (SEDs) of Bruzual & Charlot (2003) and estimated the break amplitude for (1500Å )/(830Å ) to be 3.4 based on (1500Å )/(900Å ). We assume a factor of 1.2 () reduction in / for the neutral hydrogen opacity in the IGM, modeled in the same manner as Madau (1995) and Siana et al. (2007). The SBC spectra measure up to rest frame Å for our targets. Therefore, to calculate the escaping UV photons at 1500Å , we use the flux within our spectrum between rest frame 1000 and 1050Å and apply a scaling factor () to estimate the flux at 1500Å (). The sources in our sample are by selection, blue objects with low to moderate levels of extinction. Using the SEDs of Bruzual & Charlot (2003), and assuming 0.4 solar metallicity, constant star formation with a 300 Myr old population, we derive the scaling factor to go from the to to be 1.5 in . The 1000-1050Å flux measurement does not consider the possible effect, if any, of the Ly 1026 absorption line as seen in a composite spectrum of LBGs Shapley et al. (2006). Although the spectral resolution is too low to estimate the strength of this line, it likely has little impact since our measure of the continuum flux is averaged over 50 ÅṪhe fluxes derived from the spectra are also consistent with aperture photometry derived using the F150LP images.
As we mentioned earlier, due to the slitless nature of the spectra there is spectral smearing along the dispersion direction proportional to the spatial size of the object. A different red wavelength cutoff was assumed for each object based on the galaxy’s size in the SBC direct image to ensure that light redward of the Lyman limit did not contaminate the LyC flux measurement. The sources have typical radii of 7-20 pixels in F150LP corresponding to a red cutoff of range of 820-880Å . Furthermore, the sensitivity drops sharply at the blue end and therefore we consider only the regions at rest wavelengths Å . The final spectral region used when estimating the LyC flux is between 780 and 880Å with the red cutoff changing as a function of galaxy size (shaded regions in Figure 5).
The continuum is relatively flat around 850Å for galaxies that are actively forming stars (Bruzual & Charlot, 2003), like those in our sample. We therefore integrate the observed spectrum over several resolution elements to increase the signal-to-noise ratio. The wavelength solutions of the SBC are accurate to a few angstroms between observed 1300Å and 1700Å over the SBC field of view, and the flux calibrations over this wavelength range are accurate to approximately (Larsen, 2006). The flux below the Lyman limit () is taken to be the average flux between 780 and 880Å (again the red cutoff depends on the galaxy size). The uncertainty in is derived using the following equation:
| (2) |
where is the standard deviation of the flux in each pixel, is the size of each pixel in angstroms (this value changes as a function of wavelength), and is the total wavelength range being averaged. The amount of escaping radiation below the Lyman limit is typically reported using a relative escape fraction (defined earlier in this section) or through a UV-to-LyC flux density ratio ((1500Å)(830Å). The former measure, however, requires an assumption for the intrinsic Lyman break which is not well constrained. In the next section, we present both the UV-to-LyC flux density ratios and the inferred relative escape fractions for completeness.
5. Results
We find one detection of escaping LyC radiation in an AGN starburst composite, but no direct detections of far-UV flux in our remaining sample of 31 LBG analogs. Nine galaxies (C-UVLG-3, 9, 10, 13, 14, 16, 22, 31, 32) were not detected in the direct F150LP image or PR130L spectra. Measuring limits on the LyC escape for these objects requires careful cross-calibration between HST and GALEX data due to the significant difference in angular resolutions (GALEX point spread function (PSF) ″in the FUV band) and will be presented in a future paper (H.I. Teplitz et al., 2010 in preparatio). The non-detections are likely due to in part to their large size which resulted in UV surface brightnesses below the sensitivity of our observations. Another likely contributing factor is that 7/9 of the undetected galaxies had the largest extinctions within our sample , based on SED fitting.
The observed flux density ratio, , in the individual sources range from 20 to 204 with a median of 73.5 ( lower limits). In order to convert these ratios into a relative escape fraction, we apply Equation (1) assuming an average IGM transmission of 0.85 and a value of 3.4 or 7 for the intrinsic Lyman break (see Table 1). Our far-UV sensitivities give close to zero, with individual upper limits ranging from . Since we have assumed an average IGM transmission, these upper limits are likely to be even lower in the majority of these objects since the IGM opacity at low redshift is dominated by very few opaque lines of sight Siana et al. (2007).
In order to increase our sensitivity further, we stacked the non-detections with UV sizes in diameter, which corresponds to a red cutoff of 860Å . This red cutoff was chosen to maximizing the number of galaxies in the stack while probing as closely to the Lyman limit as possible. The stack was composed of 18 galaxies placing a lower limit on 378.7 and a upper limit of (Figure 6) . In addition to the global stack, we separated the sample by morphology, stacking the eight galaxies which were visually classified in the HST F814W image to be undergoing a merger event and a radius of (red cutoff of 865Å ). We find lower limits for 223.2 and a ( upper limit) for galaxy mergers (see Figure 7 and Section 6.3 for further discussion).
5.1. LyC Emission: AGN and Star Formation?
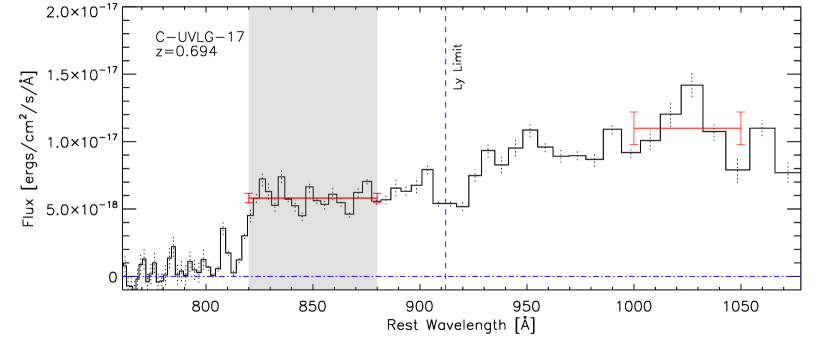
Flux below the Lyman limit was detected in C-UVLG-17 (hereafter T17), however it is unclear what process is responsible for the FUV emission (Figure 4). T17 is detected in the X-ray with a luminosity of erg s-1 (2-10KeV) (Brusa et al., 2010), and is a Type 2 AGN based on the optical spectrum (Prescott et al., 2006). Although it is highly probable that the LyC flux is coming from the AGN, it is possible that some flux has its origin in young massive stars. The COSMOS photometry, with 30-bands, was fit using a library of “hybrid” templates tuned for sources hosting an AGN even if hidden (see Salvato et al., 2009, for details). The best-fit SED is a pure starburst, although the fit is poor. The IRAC colors do not place T17 in the locus of optically bright unobscured AGN and is non-variable (over a five year period). The spectrum shows no break at the Lyman limit, with ionizing flux detected down to Å. Below this wavelength, the continuum is strongly suppressed, indicative of a foreground, high-column density absorber at .
Although this source harbors an AGN, it is worth noting that a large fraction of the LyC radiation could be from the starburst, with the AGN clearing lines of sight. It is impossible to disentangle the fractional contribution of the LyC radiation from the two sources. In the context of this paper we do not consider the LyC emission from this galaxy to be analogous to the LyC detections at high-, although this type of LyC emission is interesting and possibly more common at higher redshift.
5.2. Foreground Contamination
Higher redshift () studies have detected LyC photons in approximately of galaxies (Shapley et al., 2006; Iwata et al., 2009). Vanzella et al. (2010) estimate that at there is a probability that 1/3 of the galaxies with detected LyC emission are the result of foreground contamination by low-redshift blue galaxies within 1′′of the high-redshift galaxy. Figure 8 highlights an example of foreground contamination found in C-UVLG-14 of our sample. The NUV GALEX magnitude which is used in our sample selection has a PSF of ′′which encompasses both galaxies.
The high-resolution HST F814W image (Scoville et al., 2007) reveals two galaxies separated by 12 (10kpc), exhibiting irregular morphologies consistent with a close galaxy pair. The southern galaxy (hereafter GalA) has two compact nuclei and evidence of long tidal tails. The northern galaxy (hereafter GalB) exhibits multiple star formation knots, an asymmetric morphology and tidal tails. The two primary UV bright knots that make up GalB are referred to as GalB1 and GalB2 as noted in Figure 8.
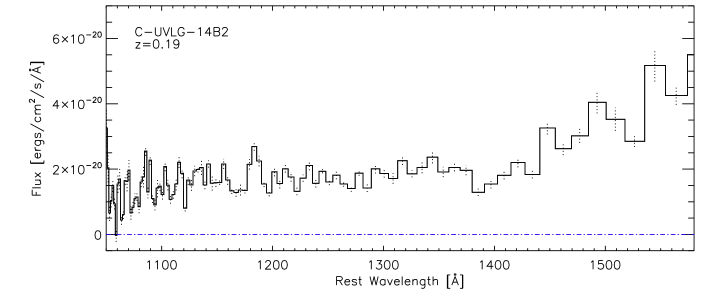
Although GalA was the intended target in our program (=0.772), the high resolution SBC direct F150LP image revealed that GalB dominated the NUV and FUV flux. The Spitzer 24m detection is centered on GalA corresponding to an IR luminosity of and a SFR of (Kennicutt, 1998). GalA was not detected in the FUV (likely due to its high dust content), however, the UV spectrum of GalB2 (Figure 9) would imply a relative escape fraction, of and a (1500Å)(830Å) 14.3, if it was at the same redshift as GalA. Follow-up spectroscopy with Keck DEIMOS revealed that GalB was a low-redshift interloper at . The close (′′) projected separation of these galaxies is a good example of foreground contamination and could explain some the detections of Iwata et al. (2009) particularly the ones with a ′′ offset between the LyC emission and assumed LBG counterpart.
6. Discussion
The deep UV spectra presented here achieve the lowest individual limits of the ionizing escape fraction at any redshift. We confirm the results of shallower studies that suggest low escape fractions in moderate redshift starbursts. We now present our findings in the context of recent studies and discuss some possible mechanisms that could be responsible for the apparent lack of starbursts with large escape fractions.
6.1. Comparison with Recent Work
Recently, Siana et al. (2010) used HSTACS/SBC 1500 Å imaging of 15 starburst galaxies in the GOODS field, obtaining a stacked limit of . With the inclusion of previous studies (Malkan et al., 2003; Siana et al., 2007) they state that no more than 8% of star-forming galaxies at 1 have relative escape fractions greater than 0.50. Cowie et al. (2009) stacked the GALEXfar-UV (1500 Å) fluxes of a much larger sample (626 galaxies) and obtain a similar upper limit of , confirming that starbursts at have low ionizing emissivities. All of these studies have used broadband UV imaging to probe the LyC at Å whereas the detections at have been obtained through spectroscopy (Steidel et al., 2001; Shapley et al., 2006) and narrowband imaging (Iwata et al., 2009) where the LyC is sampled just below the Lyman limit ( Å).
This is the first spectroscopic study to provide LyC measurements much closer to the Lyman limit and is therefore more directly comparable to these higher redshift studies. Shapley et al. (2006), with a sample of 14 LBGs probe a slightly higher UV luminosity (see Figure 10) and detect two objects with large escape fractions (with LyC-to-UV ratios significantly above our limits). One of these objects likely has a lower escape fraction than initially reported as it was not detected in deep narrowband imaging probing the LyC (Iwata et al., 2009). Therefore, only one of 14 objects has a significant detection. In a stack of the 12 undetected sources, Shapley et al. (2006) find an observed lower limit on the UV-to-LyC flux density ratio at 3 of , compared to our lower limit of . Similarly, Iwata et al. (2009), which probe comparable rest-frame UV luminosities as our sample, detect large escape fractions in of LBGs and Ly emitters at . If the LBG analogs in our sample have ionizing properties similar to LBGs at , we would expect to detect approximately three objects with large fractions of escaping LyC radiation, however, we detect none (excluding the AGN-starburst composite).
Our individual limits are significantly better than the studies at , so if there are significant numbers of galaxies with lower escape fractions (eg. , rather than unity), we would be able to detect them. We see no evidence for this scenario in our sample. Comparing our findings, which are in agreement with all other measurements, with studies (Shapley et al., 2006; Iwata et al., 2009) implies that the average escape fraction evolves with redshift, but the cause of this evolution remains unknown. It should be noted, however, that foreground contamination which is likely more severe at higher redshift, may account for some of the apparent evolution seen between and 3, by this work and others (Siana et al., 2010; Vanzella et al., 2010; Inoue et al., 2006). We proceed by focusing on possible mechanisms that could explain the lack of large escape fraction galaxies at .
6.2. Selecting Analogs of High LBGs
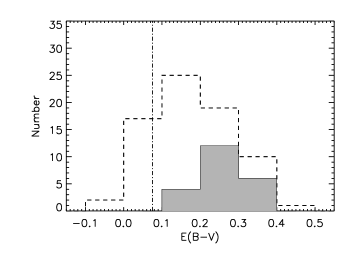
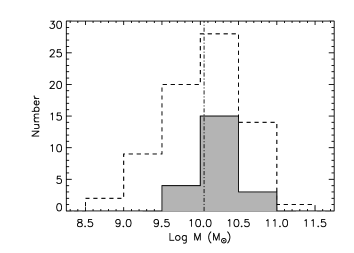
When comparing high- and low-redshift galaxy samples, there is always some degree of uncertainty regarding the true analog nature of the two populations. As discussed in Section 2 and shown in Figure 1, we selected a sample of LBG analogs sharing many of the same properties of the Shapley et al. (2006) and Iwata et al. (2009) LBGs. Figure 10 further highlights their similarities showing the distribution of reddening, stellar mass and rest-frame UV luminosity in these sources is similar to the distribution in LBGs. The similarity in mass together with the UV–optical colors of the UVLGs implies that they may still be undergoing an early, major episode of star formation rather than a small burst on top of a hidden older population (also see Barmby et al., 2004, for the same reason applied to LBGs).
Ultimately, this sample of LBG analogs shares numerous similarities to the parent LBG population, but since only of LBGs have been observed with significant LyC detections, perhaps this subclass of LBGs has other processes at work allowing or aiding in the escape of LyC photons.
6.3. Galaxy Mergers
Galaxy mergers offer an intriguing explanation for the increased escape fraction seen at . Overzier et al. (2008) noted that UVLGs typically exhibit faint tidal features suggestive of a merger or recent interaction. They therefore propose that the super starbursts in LBGs are triggered by gas-rich mergers. Similarly, Petty et al. (2009) showed that 20%-30% of LBGs have structures akin to local starburst mergers and may be driven by similar processes.
As galaxies collide, strong gravitational and tidal forces can expel long streams of stars, and ignite violent starbursts at rates of a few to hundreds of yr-1 (Schweizer, 1982; Barton et al., 2000; Bridge et al., 2010). During a merger, the tidal fields distort the galaxies radially, drawing out galactic material into long tails, plumes and bridges (e.g., Toomre & Toomre, 1972; Mihos & Hernquist, 1996). The H I reservoirs can become disturbed, and the neutral gas pulled away from the sources of ionizing radiation producing low-column density lines of sight (Hibbard et al., 2000; de Mello et al., 2008) through the galaxies, in turn allowing the escape of LyC photons. Simulations by Gnedin et al. (2008) suggest that the escape fraction in major mergers can be large () compared to non-mergers () along specific lines of sight. Within our sample of 32 galaxies, 11 had morphologies consistent with merger activity. We independently stacked eight of these spectra (removing three due to their larger spatial extent) and find ( upper limit).
If merging is a viable mechanism for clearing pathways in the ISM for LyC photons, the orientation of the system along the line of sight is also a likely factor, requiring a large sample of UV luminous mergers. Therefore, we cannot say whether mergers are an important factor as our sample size is at present too small. Currently, there is a lack of deep high-resolution rest-frame optical imaging of the LBGs with larger escape fractions, and the interpretation of UV morphologies remains problematic (Law et al., 2007). Future near-IR observations with HST of the LBG leakers will shed light on this hypothesis.
As discussed earlier in the section, galaxy mergers are capable of clearing pathways, exposing UV bright stars. If mergers do facilitate the escape of LyC radiation then an evolving merger rate, may be responsible for the observed evolution in . Numerous observational studies and simulations haven shown that the galaxy merger rate evolves with redshift, going as (Gottlöber et al., 2001; Conselice et al., 2003; Kartaltepe et al., 2007; Hopkins et al., 2007; Bridge et al., 2007; Conselice et al., 2008; Bridge et al., 2010). The factor of 3-4 increase in merger rate between 1 and 3 as seen observationally, would also increase the number of lines of sights and range of encounter parameters observed in galaxy mergers by the same factor. This would in turn increase the likelihood of detecting LyC at higher redshift.
6.4. Evolving : Size, Mass, and Star Formation
The LyC escape fraction is limited by the distribution of neutral hydrogen along a line of sight and likely depends on galactic parameters. We now consider what galaxy properties could evolve with redshift that reduce the efficiency of galactic outflows/chimneys in leaking LyC photons from luminous galaxies.
Typical galaxies (including UV bright galaxies) have been shown to be 1.5-3 times smaller at than their local counterparts (Trujillo et al., 2006; Papovich & Bell, 2002; Ferguson et al., 2004). Although our sample was selected to have similar UV surface brightnesses as LBGs (refer to Figure 1), little is known about the true optical sizes of LBGs or the gas distribution. The velocities of galactic winds or outflows have been found to be proportional to the SFR in LBGs (Ferrara & Ricotti, 2006), therefore LBG and LBG analogs, having similar SFR should in principle generate outflows with similar velocities (a few hundred km s-1). However, smaller galaxies would have higher SFRs per unit volume, which can result in more efficient galactic winds (Veilleux et al., 2005), more easily clearing pathways or “chimney-like” structures, and in turn allowing for higher (Fujita et al., 2003).
With smaller galaxies, and higher-density starbursts comes the potential for a larger fraction of stars born in very compact star clusters, including super star clusters (SSCs). SSCs can have thousands of young (50Myr) stars within a half-light radius of 10pc (Veilleux et al., 2005). These extreme concentrations of hot O and B stars can greatly impact the state of the ISM driving powerful galactic winds (like those seen in M82), opening channels for LyC photons to escape. SSCs have been detected in the tidal tails (Charlton et al., 2009) and outer regions of galaxies, which could explain the spatially offset LyC emission (to the optical emission) detected by Iwata et al. (2009) in a few LBGs. There is also some evidence that SSCs found in the local group of galaxies have top-heavy initial mass functions (IMFs; Harayama et al., 2008), which enhance the efficiency in clearing lines of sight, due to the larger outflow velocities generated by massive stars.
Another property which has been shown to possibly evolve with redshift is the stellar mass-to-dark matter ratio. Recent work by Epinat et al. (2010), have reported that local massive galaxies have more centrally concentrated dark matter than higher redshift galaxies () with comparable stellar masses. A higher stellar mass-to-dark matter mass ratio at lower redshift would result in a larger gravitational potential, and in turn the requirement for larger galactic winds to achieve the same “porosity” of the ISM (reducing the probability for ionizing photons to escape their host galaxies). Thicker disks due to dense concentrations of gas have also been shown in to impede or slow the development of galactic outflows, due to a higher gravitational potential (Cooper et al., 2008).
6.5. Intrinsic LyC-to-UV Ratio: A Top-heavy IMF?
An evolving intrinsic LyC-to-UV flux density ratio could also be responsible for the observed evolution in . The escape fraction is measured by comparing the UV (1500Å) flux of a galaxy to flux below the Lyman limit. One key assumption that is made involves the inherent LyC-to-UV ratio of starbursts. Typically, this ratio is considered constant with redshift, but if there were an order of magnitude larger production rate of the LyC relative to the 1500Å, flux at than at , the observed change in would be expected.
Iwata et al. (2009) found that three of the six LBGs with detected escaping LyC in their sample, had SEDs intrinsically bluer than those expected from population synthesis models, assuming a standard IMF with moderate dust attenuation. They show that an intrinsically bluer SED ( mag bluer in NB359-R than those of Starburst99), in the absence of QSO activity, can be produced with a top-heavy IMF. They also suggest that a deviation from the Calzetti et al. (2000) dust attenuation law, with less dust absorption at 900Å, compared to that at 1500Å, can come close to achieving the observed bluer colors of those LBGs.
It has been shown that the UV luminosity density at may be insufficient to explain the ionized universe at unless the IMF allowed for the production of more massive stars (Chary, 2008). A top-heavy IMF at higher redshift could help explain the larger number of LyC detections at as massive stars produce more LyC photons, and stronger supernova driven winds. A top-heavy IMF requires regions of potentially low metallicity gas which is consistent with the metallicity and dust evolution seen from to 1 (Ferguson et al., 2002).
7. Summary
LyC photons produced in massive starbursts likely played an important role in the reionization of the universe. However, their contribution depends upon the fraction of ionizing radiation that can escape the high column density of HI gas surrounding these star-forming galaxies. We have presented HST rest-frame UV slitless spectroscopy of 32 0.7 LBG analogs in the COSMOS field to investigate the LyC escape fraction. These UV spectra have achieved the deepest limits to date on the escape fraction in individual sources at any redshift. A summary of our results is as follows.
Aside from the detection of leaking LyC from an AGN–starburst composite, we find no detections of LyC in our sample of 31 star-forming galaxies. The individual lower limits of (1500Å )/(830Å ) ratio range from 20 to 204 (median of 73.5) and 378.7 in the stack of 18 galaxies. Assuming an intrinsic Lyman break of 3.4 and an IGM transmission of , we report a relative escape fraction in individual galaxies of 0.02-0.19 and 0.01 in the stack ( upper limit). There is no indication of the near unity escape fractions found at . The striking contrast between the nearly zero escape fractions found in the 22 LBG analogs with the near unity escape fractions discovered in 10% of the LBG population strongly argues for an evolving escape fraction. It is unclear, however, if the lack of near unity escape fraction detections at low redshift is due to an evolution in actual value of the itself, or if it is just that the number of galaxies that in fact have large amounts of leaking LyC, decrease with redshift. Both scenarios could explain absence of galaxies with larger amounts of leaking LyC. Possible causes for a change in the perceived escape fraction with redshift involve a top-heavy IMF, larger SFR densities, stellar mass-to-dark matter ratios, and/or fraction of SSCs at higher redshifts. All these mechanisms enhance the efficiency of galaxy winds, increasing the porosity of the ISM, facilitating LyC escape. However, if galaxy mergers aid in the escape of LyC radiation then an evolving galaxy merger rate could account for the high number of LyC leaking galaxies at . The lack of low-redshift galaxies with escaping LyC could then be explained by the small number of galaxy mergers that have been observed below the Lyman limit. An additional consideration is that a fraction of the detections of escaping LyC at 3 may be a consequence of foreground contamination, which would reduce the strength of the evolution in seen when comparing to low- studies.
The escape fraction of UV radiation in luminous starburst galaxies is an important quantity to understand since it provides insight into the sources (massive star formation or QSOs) responsible for reionization. Our study has presented a robust measure of the in the low-redshift universe and suggests that the escape fraction in objects that are analogous to 3 LBG population, evolves with redshift. However, future study is required to isolate the cause of this evolution.
References
- Barmby et al. (2004) Barmby, P., et al. 2004, ApJS, 154, 97
- Barton et al. (2000) Barton, E. J., Geller, M. J., & Kenyon, S. J. 2000, ApJ, 530, 660
- Bertin & Arnouts (1996) Bertin, E., & Arnouts, S. 1996, A&AS, 117, 393
- Bouwens et al. (2006) Bouwens, R. J., Illingworth, G. D., Blakeslee, J. P., & Franx, M. 2006, ApJ, 653, 53
- Bridge et al. (2007) Bridge, C. R., et al. 2007, ApJ, 659, 931
- Bridge et al. (2010) Bridge, C. R., Carlberg, R. G., & Sullivan, M. 2010, ApJ, 709, 1067
- Brusa et al. (2010) Brusa, M., et al. 2010, ApJ, 716, 348
- Brusa et al. (2009) —. 2009, ApJ, 693, 8
- Bruzual & Charlot (2003) Bruzual, G., & Charlot, S. 2003, MNRAS, 344, 1000
- Calzetti et al. (2000) Calzetti, D., Armus, L., Bohlin, R. C., Kinney, A. L., Koornneef, J., & Storchi-Bergmann, T. 2000, ApJ, 533, 682
- Charlton et al. (2009) Charlton, J. C., et al. 2009, in American Astronomical Society Meeting Abstracts, Vol. 213, American Astronomical Society Meeting Abstracts, 344.01
- Chary (2008) Chary, R.-R. 2008, ApJ, 680, 32
- Conselice et al. (2003) Conselice, C. J., Bershady, M. A., Dickinson, M., & Papovich, C. 2003, AJ, 126, 1183
- Conselice et al. (2008) Conselice, C. J., Rajgor, S., & Myers, R. 2008, MNRAS, 386, 909
- Cooper et al. (2008) Cooper, J. L., Bicknell, G. V., Sutherland, R. S., & Bland-Hawthorn, J. 2008, ApJ, 674, 157
- Cowie et al. (2009) Cowie, L. L., Barger, A. J., & Trouille, L. 2009, ApJ, 692, 1476
- de Mello et al. (2008) de Mello, D. F., Smith, L. J., Sabbi, E., Gallagher, J. S., Mountain, M., & Harbeck, D. R. 2008, AJ, 135, 548
- Deharveng et al. (2001) Deharveng, J.-M., Buat, V., Le Brun, V., Milliard, B., Kunth, D., Shull, J. M., & Gry, C. 2001, A&A, 375, 805
- Epinat et al. (2010) Epinat, B., Amram, P., Balkowski, C., & Marcelin, M. 2010, MNRAS, 401, 2113
- Ferguson et al. (2004) Ferguson, H. C., et al. 2004, ApJ, 600, L107
- Ferguson et al. (2002) Ferguson, H. C., Dickinson, M., & Papovich, C. 2002, ApJ, 569, L65
- Ferrara & Ricotti (2006) Ferrara, A., & Ricotti, M. 2006, MNRAS, 373, 571
- Fujita et al. (2003) Fujita, A., Martin, C. L., Mac Low, M.-M., & Abel, T. 2003, ApJ, 599, 50
- Giallongo et al. (1997) Giallongo, E., Fontana, A., & Madau, P. 1997, MNRAS, 289, 629
- Giavalisco (2002) Giavalisco, M. 2002, ARA&A, 40, 579
- Glikman et al. (2010) Glikman, E., Bogosavljević, M., Djorgovski, S. G., Stern, D., Dey, A., Jannuzi, B. T., & Mahabal, A. 2010, ApJ, 710, 1498
- Gnedin et al. (2008) Gnedin, N. Y., Kravtsov, A. V., & Chen, H.-W. 2008, ApJ, 672, 765
- Gottlöber et al. (2001) Gottlöber, S., Klypin, A., & Kravtsov, A. V. 2001, ApJ, 546, 223
- Harayama et al. (2008) Harayama, Y., Eisenhauer, F., & Martins, F. 2008, ApJ, 675, 1319
- Heckman et al. (2005) Heckman, T. M., et al. 2005, ApJ, 619, L35
- Hibbard et al. (2000) Hibbard, J. E., Vacca, W. D., & Yun, M. S. 2000, AJ, 119, 1130
- Hoopes et al. (2007) Hoopes, C. G., et al. 2007, ApJS, 173, 441
- Hopkins et al. (2007) Hopkins, P. F., Bundy, K., Hernquist, L., & Ellis, R. S. 2007, ApJ, 659, 976
- Inoue et al. (2006) Inoue, A. K., Iwata, I., & Deharveng, J.-M. 2006, MNRAS, 371, L1
- Iwata et al. (2008) Iwata, I., et al. 2008, ArXiv e-prints
- Iwata et al. (2009) —. 2009, ApJ, 692, 1287
- Jiang et al. (2008) Jiang, L., et al. 2008, AJ, 135, 1057
- Kartaltepe et al. (2007) Kartaltepe, J. S., et al. 2007, ApJS, 172, 320
- Kennicutt (1998) Kennicutt, Jr., R. C. 1998, ARA&A, 36, 189
- Koekemoer et al. (2007) Koekemoer, A. M., et al. 2007, ApJS, 172, 196
- Kümmel et al. (2006) Kümmel, M., Larsen, S. S., & Walsh, J. R. 2006, in The 2005 HST Calibration Workshop: Hubble After the Transition to Two-Gyro Mode, ed. A. M. Koekemoer, P. Goudfrooij, & L. L. Dressel, 85–+
- Larsen (2006) Larsen, S. S. 2006, Wavelength and Flux calibration of the ACS/SBC PR110L and PR130L prisms, Tech. rep.
- Larsen et al. (2006) Larsen, S. S., Walsh, J., & Kummel, M. 2006, Wavelength and Flux Calibration of the ACS/HRC PR200L Prism, Tech. rep.
- Law et al. (2007) Law, D. R., Steidel, C. C., Erb, D. K., Pettini, M., Reddy, N. A., Shapley, A. E., Adelberger, K. L., & Simenc, D. J. 2007, ApJ, 656, 1
- Leitherer et al. (1995) Leitherer, C., Ferguson, H. C., Heckman, T. M., & Lowenthal, J. D. 1995, ApJ, 454, L19+
- Lilly et al. (2009) Lilly, S. J., et al. 2009, ApJS, 184, 218
- Madau (1995) Madau, P. 1995, ApJ, 441, 18
- Madau et al. (1999) Madau, P., Haardt, F., & Rees, M. J. 1999, ApJ, 514, 648
- Malkan et al. (2003) Malkan, M., Webb, W., & Konopacky, Q. 2003, ApJ, 598, 878
- Mihos & Hernquist (1996) Mihos, J. C., & Hernquist, L. 1996, ApJ, 464, 641
- Mobasher et al. (2007) Mobasher, B., et al. 2007, ApJS, 172, 117
- Oke & Gunn (1982) Oke, J. B., & Gunn, J. E. 1982, PASP, 94, 586
- Overzier et al. (2008) Overzier, R. A., et al. 2008, ApJ, 677, 37
- Papovich & Bell (2002) Papovich, C., & Bell, E. F. 2002, ApJ, 579, L1
- Petty et al. (2009) Petty, S. M., de Mello, D. F., Gallagher, J. S., Gardner, J. P., Lotz, J. M., Matt Mountain, C., & Smith, L. J. 2009, AJ, 138, 362
- Prescott et al. (2006) Prescott, M. K. M., Impey, C. D., Cool, R. J., & Scoville, N. Z. 2006, ApJ, 644, 100
- Salvato et al. (2009) Salvato, M., et al. 2009, ApJ, 690, 1250
- Schweizer (1982) Schweizer, F. 1982, ApJ, 252, 455
- Scoville et al. (2007) Scoville, N., et al. 2007, ApJS, 172, 38
- Shapley et al. (2005) Shapley, A. E., Steidel, C. C., Erb, D. K., Reddy, N. A., Adelberger, K. L., Pettini, M., Barmby, P., & Huang, J. 2005, ApJ, 626, 698
- Shapley et al. (2006) Shapley, A. E., Steidel, C. C., Pettini, M., Adelberger, K. L., & Erb, D. K. 2006, ApJ, 651, 688
- Siana et al. (2008) Siana, B., et al. 2008, ApJ, 675, 49
- Siana et al. (2007) —. 2007, ApJ, 668, 62
- Siana et al. (2010) —. 2010, ArXiv e-prints
- Steidel et al. (2001) Steidel, C. C., Pettini, M., & Adelberger, K. L. 2001, ApJ, 546, 665
- Teplitz et al. (2006) Teplitz, H. I., et al. 2006, AJ, 132, 853
- Toomre & Toomre (1972) Toomre, A., & Toomre, J. 1972, ApJ, 178, 623
- Trujillo et al. (2006) Trujillo, I., et al. 2006, ApJ, 650, 18
- Vanzella et al. (2010) Vanzella, E., Siana, B., Cristiani, S., & Nonino, M. 2010, MNRAS, 404, 1672
- Veilleux et al. (2005) Veilleux, S., Cecil, G., & Bland-Hawthorn, J. 2005, ARA&A, 43, 769
- Verma et al. (2007) Verma, A., Lehnert, M. D., Förster Schreiber, N. M., Bremer, M. N., & Douglas, L. 2007, MNRAS, 377, 1024
- Walsh et al. (2006) Walsh, J. R., Kümmel, M., & Larsen, S. S. 2006, in The 2005 HST Calibration Workshop: Hubble After the Transition to Two-Gyro Mode, ed. A. M. Koekemoer, P. Goudfrooij, & L. L. Dressel, 79–+
- Willott et al. (2010) Willott, C. J., et al. 2010, AJ, 139, 906
- Yan et al. (2006) Yan, H., Dickinson, M., Giavalisco, M., Stern, D., Eisenhardt, P. R. M., & Ferguson, H. C. 2006, ApJ, 651, 24
- Zamojski et al. (2007) Zamojski, M. A., et al. 2007, ApJS, 172, 468

![[Uncaptioned image]](/html/1008.0004/assets/x8.png)
![[Uncaptioned image]](/html/1008.0004/assets/x9.png)
![[Uncaptioned image]](/html/1008.0004/assets/x10.png)
![[Uncaptioned image]](/html/1008.0004/assets/x11.png)
![[Uncaptioned image]](/html/1008.0004/assets/x12.png)
![[Uncaptioned image]](/html/1008.0004/assets/x13.png)
![[Uncaptioned image]](/html/1008.0004/assets/x14.png)
![[Uncaptioned image]](/html/1008.0004/assets/x15.png)
![[Uncaptioned image]](/html/1008.0004/assets/x16.png)
![[Uncaptioned image]](/html/1008.0004/assets/x17.png)
![[Uncaptioned image]](/html/1008.0004/assets/x18.png)
![[Uncaptioned image]](/html/1008.0004/assets/x19.png)
![[Uncaptioned image]](/html/1008.0004/assets/x20.png)
![[Uncaptioned image]](/html/1008.0004/assets/x21.png)
![[Uncaptioned image]](/html/1008.0004/assets/x22.png)
![[Uncaptioned image]](/html/1008.0004/assets/x23.png)
![[Uncaptioned image]](/html/1008.0004/assets/x24.png)
![[Uncaptioned image]](/html/1008.0004/assets/x25.png)
![[Uncaptioned image]](/html/1008.0004/assets/x26.png)

| Object ID | R.A. | Decl. | Exp. Time | NUVaaNUV magnitude from GALEX public release ver. 3 | bb3 upper limits in units of erg s-1cm-2Å-1 | cc3 lower limits | ddAssumes and intrinsic flux ratio of based in part from (Steidel et al., 2001) | eeAssumes (Siana et al., 2007) | |
|---|---|---|---|---|---|---|---|---|---|
| C-UVLG-02 | 149.94569 | 2.50422 | 108 | 0.667 | 22.40 | 2.880e-19 | 36.90 | 0.108 | 0.223 |
| C-UVLG-05 | 150.08705 | 2.30905 | 108 | 0.688 | 22.60 | 1.708e-17 | 118.94 | 0.034 | 0.069 |
| C-UVLG-07 | 150.21405 | 2.36754 | 108 | 0.669 | 22.69 | 9.144e-16 | 73.45 | 0.054 | 0.112 |
| C-UVLG-08 | 150.42432 | 2.03343 | 81 | 0.685 | 22.35 | 7.305e-20 | 144.16 | 0.028 | 0.057 |
| C-UVLG-11 | 150.15372 | 1.84970 | 108 | 0.670 | 22.39 | 6.471e-17 | 112.37 | 0.036 | 0.073 |
| C-UVLG-12 | 149.85553 | 2.55685 | 108 | 0.665 | 22.50 | 1.054e-16 | 20.69 | 0.193 | 0.397 |
| C-UVLG-15 | 150.27368 | 2.55358 | 108 | 0.715eeAssumes (Siana et al., 2007) | 22.60 | 3.243e-21 | 40.49 | 0.099 | 0.203 |
| C-UVLG-18 | 150.60126 | 2.71238 | 108 | 0.676 | 22.53 | 1.671e-16 | 34.02 | 0.118 | 0.242 |
| C-UVLG-19 | 150.48743 | 2.15107 | 108 | 0.684 | 22.41 | 4.484e-20 | 34.73 | 0.115 | 0.237 |
| C-UVLG-20 | 150.51077 | 2.75674 | 81 | 0.675 | 22.09 | 5.094e-19 | 9312 | 0.043 | 0.088 |
| C-UVLG-21 | 149.62891 | 2.19084 | 108 | 0.701 | 22.46 | 2.034e-16 | 161.10 | 0.025 | 0.051 |
| C-UVLG-23 | 149.88934 | 2.73473 | 27 | 0.709 | 21.41 | 8.128e-19 | 203.56 | 0.019 | 0.040 |
| C-UVLG-24 | 150.17247 | 2.63495 | 108 | 0.752 | 22.43 | 1.660e-16 | 36.05 | 0.111 | 0.228 |
| C-UVLG-25 | 149.62904 | 1.66577 | 81 | 0.671 | 22.02 | 1.182e-20 | 74.98 | 0.053 | 0.109 |
| C-UVLG-26 | 149.60760 | 2.16737 | 108 | 0.676 | 22.28 | 6.302e-19 | 121.33 | 0.033 | 0.068 |
| C-UVLG-27 | 149.69514 | 2.74294 | 108 | 0.652 | 22.52 | 1.015e-19 | 82.99 | 0.048 | 0.099 |
| C-UVLG-28 | 150.45580 | 1.65284 | 81 | 0.657 | 22.66 | 4.344e-19 | 33.84 | 0.118 | 0.243 |
| C-UVLG-29 | 149.46870 | 2.58616 | 81 | 0.704 | 21.94 | 1.005e-18 | 66.43 | 0.060 | 0.124 |
| C-UVLG-30 | 149.51488 | 1.89228 | 108 | 0.694 | 22.56 | 8.146e-17 | 50.50 | 0.079 | 0.163 |
| C-UVLG-33 | 150.76311 | 2.80412 | 108 | 0.693 | 22.37 | 3.299e-19 | 124.97 | 0.032 | 0.065 |
| C-UVLG-34 | 150.69376 | 2.84451 | 108 | 0.738 | 22.68 | 8.607e-17 | 62.97 | 0.063 | 0.130 |
| C-UVLG-35 | 149.69348 | 2.59921 | 27 | 0.678 | 21.35 | 1.490e-18 | 72.07 | 0.055 | 0.114 |
| Stack | (18 galaxies)ffPhotometric redshift | 0.685 | 22.14 | 6.379e-19 | 378.7 | 0.011 | 0.022 | ||
| Stack | (8 mergers)ggAll objects except 2, 7, 15, and 18 are included in the stack due to their extended sizes | 0.678 | 22.50 | 1.249e-18 | 223.2 | 0.018 | 0.037 |
Note. — The values presents are limits. Objects 3, 9, 10, 13, 14, 16, 22, 31, and 32 were not detected in the FUV direct image, target 17 was an AGN.