Asymmetries in Extragalactic Double Radio Sources: Clues from 3D Simulations of Jet – Disc Interaction
Abstract
Observational and theoretical studies of extragalactic radio sources have suggested that an inhomogeneous environment may be responsible for observed arm length asymmetries of jets and the properties of extended emission line regions in high redshift radio galaxies. We perform 3D hydrodynamic simulations of the interaction of a powerful extragalactic bipolar jet with a disc-shaped clumpy interstellar medium of log-normal density distribution and analyze the asymmetry. Furthermore, we compute the relation between jet asymmetry and the ISM properties by means of Monte Carlo simulations based on a 1D propagation model for the jet through the dense medium. We find that the properties of the ISM can be related to a probability distribution of jet arm length asymmetries: Disc density and height are found to have the largest effect on the asymmetry for realistic parameter ranges, while the Fourier energy spectrum of the ISM and turbulent Mach number only have a smaller effect. The hydrodynamic simulations show that asymmetries generally may be even larger than expected from the 1D model due to the complex interaction of the jet and its bow shock with gaseous clumps, which goes much beyond simple energy disposal. From our results, observed asymmetries of medium-sized local radio galaxies may be explained by gas masses of to in massive elliptical galaxies. Furthermore, the simulations provide a theoretical basis for the observed correlation that emission line nebulae are generally found to be brighter on the side of the shorter lobe in high redshift radio galaxies (McCarthy et al., 1991). This interaction of jets with the cold gas phase suggests that star formation in evolving high redshift galaxies may be affected considerably by jet activity.
keywords:
galaxies: jets, galaxies: ISM, methods: numerical, hydrodynamics ISM: structure1 Introduction
Asymmetries in double radio sources have been a matter of discussion since more than 40 years, when Ryle & Longair (1967) examined a conjectured relativistic propagation. This discussion has included asymmetries both in brightness and in length (e.g. of the lobes or the core–hotspot distance). The underlying assumption mostly has been that jets are intrinsically symmetric objects as they are launched near the central supermassive black holes. While relativistic effects may cause brightness asymmetries by Doppler beaming (Wardle & Aaron, 1997) and length asymmetries due to finite light travel times (examined by Scheuer, 1995), several studies (Pedelty et al., 1989; McCarthy et al., 1991; Arshakian & Longair, 2000; Jeyakumar et al., 2005) have suggested that an inhomogeneous environment has a stronger impact on the observed asymmetries. This is in agreement with Scheuer (1995) finding only a slow jet head propagation to be compatible with observations. In contrast to the local universe, where low gas mass fractions are generally found in radio galaxies, galaxies at high redshift show gas masses of the same order as the stellar mass of the hosting galaxy (Tacconi et al., 2010). Such large amounts of gas in and around galaxies may have considerable effects on the jets. The interaction of jets with the clumpy interstellar medium (ISM) and gas accreted onto the galaxy may have a major impact on the formation of stars in the galaxies and the galaxies’ energy budget. These questions go much beyond the merely morphological properties of the radio galaxies, but are clearly linked with the kinematics, dynamics and evolution of the galaxy as a whole. Observations of high-redshift radio galaxies commonly show the “alignment effect” of having extended and sometimes very massive emission-line nebulae aligned with the radio source (McCarthy, 1993; Nesvadba et al., 2008). These nebulae almost always are brighter in [OII] emission on the side of shorter jet. This suggests that there may be vivid interaction going on: assuming the brighter shock-excited gas traces the location of stronger interaction of the jet with its environs, this may be an indication of the jet being responsible for the formation of the emission line nebulae either directly or via its backflow (Gaibler, Krause & Camenzind, 2009; Gaibler & Camenzind, 2010).
Aiming towards understanding the interaction of jets with a complex multiphase environment at high redshift, we have performed 3D hydrodynamic simulations of a pair of jets with a surrounding clumpy gaseous disc. In this paper, we present first results from the simulations, concentrating on jet asymmetries caused by the clumpy ISM. We present results of Monte Carlo simulations based on analytical approximations of the jet propagation through a clumpy ISM aside with the full hydrodynamical simulations to examine the link between the gaseous disc properties with the expected jet length asymmetries. A more detailed examination of the simulations with respect to star formation and feedback energetics as well as the kinematics of the dense gas will be presented in a subsequent paper.
2 The Model
We set up a clumpy gaseous disc contained within a homogeneous hot atmosphere (Fig. 1). The atmosphere has density of and a temperature of K. The log-normal density field of the disc is constructed from a normal-distributed (mean , standard deviation ) and clumpy field , constructed in Fourier space, by
| (1) |
with the central median disc density cm-3 and the disc scales kpc and kpc (: cylindrical radius and vertical height, respectively), using a temperature of K. The disc values are only set where , and a strict cutoff is applied at kpc and kpc. The total mass of the gaseous disc is . For any small volume, the disc densities show a log-normal distribution, but on the global disc scale, the imposed radial and vertical profiles increase the contribution of lower densities. The standard deviation of the disc’s log-density corresponds to turbulence of Mach number 5 ( km s-1) (Kritsuk et al., 2007), a value similar to large evolving discs at high redshift (Förster Schreiber et al., 2009). The two-point structure of the density field is described by the Fourier energy spectrum (Fig. 2), which follows for large wave numbers , but is intentionally damped towards smaller wave numbers, avoiding large inhomogeneities on scales .

The initial configuration is evolved for 2 Myr, and after this initial relaxation phase a bipolar (back-to-back) jet is introduced in the centre of the disc. It is realized by a cylindrical orifice of jet plasma ( cm-3, c) with the same pressure as the hot atmosphere and with a radius of kpc and an initial length in both directions of , respectively. The kinetic power of the jet is erg s-1.
This setup is evolved by the RAMSES 3.0 code (Teyssier, 2002), a non-relativistic second-order Godunov-type adaptive mesh refinement (AMR) code. The total computational domain extends over a cubic box of size 128 kpc, with a coarse grid of kpc resolution and adaptive refinement down to pc (effective resolution ). We use the HLLC solver and the MonCen slope limiter, refine on the entire disc and on 10 per cent gradients in density or pressure or speeds above , and assume for all phases. This enables us to study virtually the entire jet–disc system at the finest resolution. We include the important effect of radiative cooling (as implemented in the code) for a metallicity (Erb, 2008), but exclude gravity and stabilize the disc by imposing a minimum temperature of K since we do not include stellar feedback, making the disc sufficiently stable over the simulated time scale.
3 Simulation Results
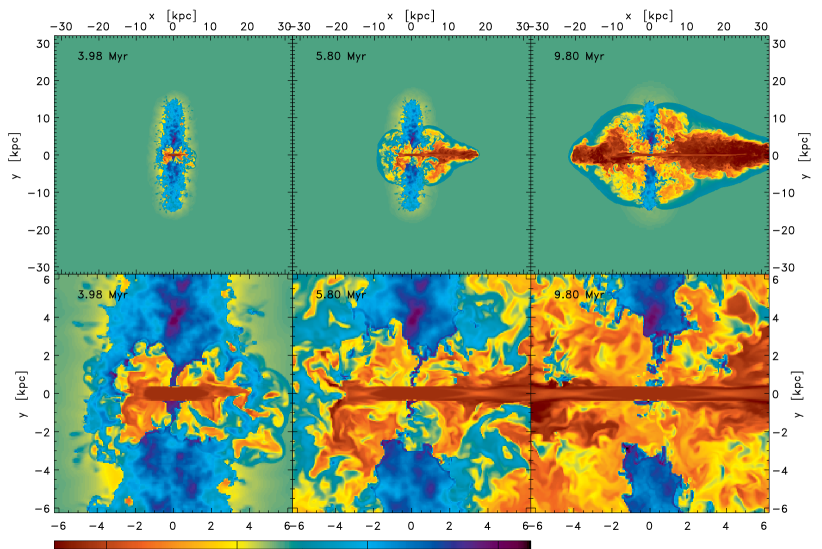
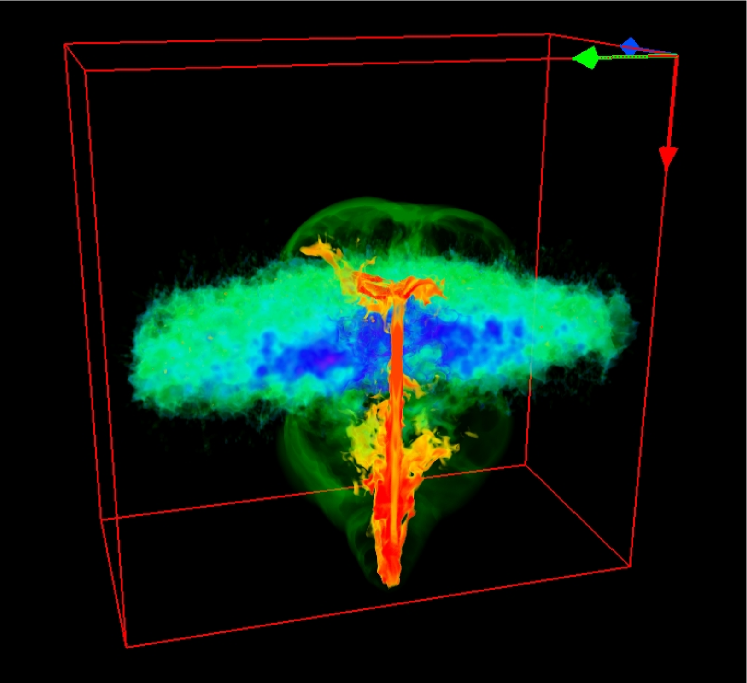
The jet inflates two strongly over-pressured cavities filled with diffuse jet plasma in the central region of the disc and forms a disc-like structure of strongly compressed gas in the midplane due to the synchronous start of the two jets (the evolution is shown in Fig. 3). The gas in the midplane of the disc at larger radii is largely unaffected by the jet due to the high densities there, while the cavities expand in vertical direction and form a pressure-driven blastwave in the outer layers of the disc and the surrounding halo gas. The jet beam, however, is still restrained by dense clumps and filaments. This early phase corresponds to the “flood and channel” and the “energy-driven bubble” phases described by Sutherland & Bicknell (2007). At this stage, a remarkable asymmetry between the two jets develops. The right-hand jet is only slightly deflected by a dense clump in its way, which it pushes sideways and considerably ablates, and then quickly pushes forward to the expanding bubble which it pierces at Myr (“jet breakout phase”). The left-hand jet, however, is still restrained by dense clumps at somewhat larger radii (middle plots in Fig. 3), causing a delay in its propagation with respect to the opposite jet. It reaches the expanding blastwave shell much later, eventually piercing it at Myr. Already in the earliest (blastwave) phase, the jet’s environment becomes asymmetric since the blastwave is able to clear more of the environment on the right side than on the left side, where a group of dense clumps makes this blastwave clearing less effective. It is also worth noting that the restraining clouds are not simply the ones located there already in the initial conditions, but they are generally moved and reshaped by advection and compression caused by the blastwave and the shocked beam plasma (“second order” restraints). In case of the left jet, one of these clouds was just in the middle of the jet’s path. During this phase, the jet plasma exhibits a complex velocity structure, forming back-flowing vortices in some regions and forward-flowing streams and plumes in others111Movies available online make this more evident. . Once the jets have pierced the expanding shell, they show the classic morphology known from jet simulations, propagating faster through the lower density environment, although the lateral expansion of the cocoons is still affected by the pierced shell.
To examine, whether this asymmetry could have been expected from the clumpy disc set up in the initial conditions, we approximate the propagation of the jet head by one-dimensional momentum balance for very underdense jets (e.g. Krause, 2003)
| (2) |
and find a propagation time out to a distance of
| (3) |

Fig. 4 shows the analytical estimate along with the measured position of the jet head based on the initial density field. The right jet is described quite well by the estimate, while the left one needs considerable additional time to break out compared to the expected behaviour ( Myr vs. Myr expected from momentum balance). We attribute this to the mentioned “second-order” restraints – changes of the surrounding ISM caused by the jet activity itself. They are small at early times, but become important later once the jet has propagated through most of the disc and hence changed its environment significantly from the initial configuration. The asymmetry of the jets is also understandable in light of the initial disc mass in the jet beam’s path, which is about M⊙ for the right jet and M⊙ for the left jet.
4 Monte Carlo Simulations of Disc-induced Asymmetries
We here investigate how the disc properties affect the distribution of asymmetries in a statistical sense, by generating a large ensemble of discs. Which disc leads to which typical asymmetries? Once the jets have broken out of the disc or any other clumpy ISM, the major effect on the jet morphology will be a propagation delay between the jets on both sides: in general, one jet will have propagated already somewhat further than the other. Correspondingly, an absolute length asymmetry is expected rather than a relative length asymmetry as in the case of asymmetries caused by light travel time (Arshakian & Longair, 2000). Due to the computational demands, a statistical treatment of this propagation delay by means of 3D hydrodynamic simulations is hardly possible. However, despite the considerable differences between the 1D estimate and the true propagation caused by individual clumps, simple momentum balance works well enough to obtain first order estimates of the effects of a clumpy interstellar medium on the jet propagation and the resulting arm length asymmetries, as well as the impact of disc parameters on it. Clearly, one has to keep in mind that the “second-order” effects may in general cause even larger ranges of asymmetries than expected from a 1D estimate. We note that while we have assumed a fully collimated, non-relativistic jet for our estimates, the Monte-Carlo approach in combination with the one-dimensional momentum balance could also be used for a conical and/or relativistic jet, which may be more realistic for modelling the innermost regions, and any other ISM density structure.


To examine the impact of disc parameters on the asymmetries caused by the disc, we performed Monte Carlo simulations of the jet propagation using the momentum balance estimate above. We varied the median value and the log-normal distribution width of the disc density, the disc scale height , the power spectrum shape and its slope at large wave numbers (Figs. 5 and 6). The asymmetries are described by a time delay – the time difference between both jets once the disc has been left behind. A typical jet head propagation speed in the ambient medium would allow to relate this to an asymmetry in length. Since a homogeneous distribution is used for the diffuse ambient gas, no further asymmetries are caused at a later time within this statistical model and the asymmetries are entirely due to the clumpy disc. Fig. 5 shows the probability density for the fiducial values of the hydrodynamic simulation. The time asymmetry of Myr seen in Fig. 4 for the 1D propagation model of our hydrodynamical setup lies well between the 50 and 75 percentiles (cumulative probability) and hence can be considered a “one- event”. In the following, we concentrate on the effects of the mentioned parameters on the 50, 75 and 90 percentiles of the delay distribution. Only one parameter is varied at a time while the others have their fiducial value.
The mean density of the disc has a large impact on the jet asymmetries. For median densities much larger than the diffuse background gas, the delays vary , which is understandable from (3); clearly, this also translates directly into changes of the total disc mass. The density variation within the disc, described by the log-normal distribution width parameter , can be related to the turbulent Mach number of the disc by
| (4) |
with (Kritsuk et al., 2007). For the effects of , it is important to consider that for a log-normal distribution, the median value relates to the mean density as , resulting in an increasing mean density and hence total disc mass for increasing and constant . To avoid effects of changing density, the top-right plot in Fig. 6 displays the changes in delay for constant mean density (i.e. constant disc mass; the median density changes along with ). It shows an increase in delay until where it then decreases again. While the former is a result of a more and more inhomogenous disc density distribution, a very wide range of densities (for a highly turbulent medium with large ) results in a small median density and only small filling factors taken by gas of densities larger than the background medium value and thus lower probabilities for clumps being in the jet’s path (for a constant mean density, the volume filling factor of dense clumps in a log-normal density distribution decreases for increasing ). For a constant median density, however, the delay times would increase even stronger for due to the enormously increasing total disc masses. Interestingly, the delays for the wide range of turbulent Mach numbers 2 to 30 (corresponding to ) are only weakly dependent on the exact value of turbulence. The disc scale height shows a near-linear behaviour of the delays with some deviations for values similar to the initial jet length, which are an artefact of not modelling the earliest phase of jet propagation. For zero initial jet length, the “convergence point” at kpc is located at the origin. In contrast to the previous dependencies, the effect of the shape and large wave number powerlaw slope of the Fourier energy spectrum is quite small since even without damping of small wave numbers these are suppressed by the imposed vertical profile scale . Furthermore the effects of small scale perturbations (stronger for flatter energy spectra, ) are increasingly averaged out over the length scale of . We conclude from the Monte Carlo simulations that the distribution of disc-induced asymmetries mostly depends on the average disc density or total mass and to a weaker extent on the density variations within and scale height of the disc for plausible values of the latter two.
5 Discussion & Conclusion
For a given propagation delay and once the jet has propagated beyond the vertical disc/ISM boundaries, the observed length asymmetry will in general be influenced by the density profile of the ambient medium, which itself governs the propagation of the hotspots and lobes. Double radio sources in this stage are expected to exhibit a length asymmetry dependent on the propagation delay due to the clumpy medium and the typical jet propagation speed outside. The absolute length asymmetries due to the ISM should be roughly independent of the source size if the density profile doesn’t lead to a large change in . We have compared this to the observed asymmetries in radio galaxies, using the 3CRR sources with with FR II morphology and from Mullin et al. (2008)222available at http://zl1.extragalactic.info for a CDM cosmology with , and . Of these, only sources with clearly identified hotspots on opposite sides are considered (88 sources) and projection effects are not accounted for here (differences should be less than 50 per cent for most radio galaxies). Although the relative asymmetries (with respect to the total source size) decrease for larger sources (Arshakian & Longair, 2000), the absolute arm length asymmetries increase much.


For the smaller sources (sum of LLS kpc, 20 sources), however, the scatter does not vary strongly with size and we argue that asymmetries caused by a clumpy ISM cannot be larger than the scatter seen on these scales (mostly between and kpc). The corresponding percentiles are kpc (50 per cent), kpc (75 per cent) and kpc (90 per cent). Based on a fiducial jet propagation speed of , the corresponding percentiles for the propagation delay are , and Myr. Comparison of these values with our Monte Carlo runs now rises on the question, how typical situations as in our hydrodynamical simulation with asymmetries larger than expected are. If this is the rather typical case, and actual asymmetries may be factors of a few larger than the 1D estimates, the observed typical asymmetries could be described by asymmetries in the Monte Carlo runs of – Myr, suggesting disc densities are a factor of smaller than in our chosen set of parameters (with other combinations of parameters possible, or course). Although a more detailed comparison with observed data is beyond the scope of this paper, the corresponding masses for a dense clumpy medium of to may be compatible with actually measured gas masses (as e.g. in Catinella et al., 2010; Emonts et al., 2010). However, if the asymmetric clearing of the central region by the initial blastwave and clumps remaining in the jet’s path are rather rare, the observed asymmetries require disc densities almost as high as in our hydrodynamical setup even for the local universe, with total masses of and more. To us, the first case seems more probable since the asymmetric blastwave simply is caused by the asymmetric initial density and hence no exceptional behaviour.
While the asymmetries of small radio sources (below 100 kpc) may be explained by a clumpy ISM, this is not true for the larger sources with larger absolute length asymmetries. Although propagation of delayed jets through a declining density profile can result in increasing absolute asymmetries, it is hardly possible that they grow by a factor of 10 or more. These large sources might actually become more asymmetric by a strongly asymmetric ambient density profile at large scales (Jeyakumar et al., 2005) or due to an unstable jet propagation on one side possibly caused by instabilies or obstructing clumps in one jet. For the largest sources with large propagation speeds caused by a very low density environment, light travel time effects may actually play a significant role even if it doesn’t for the smaller sources.
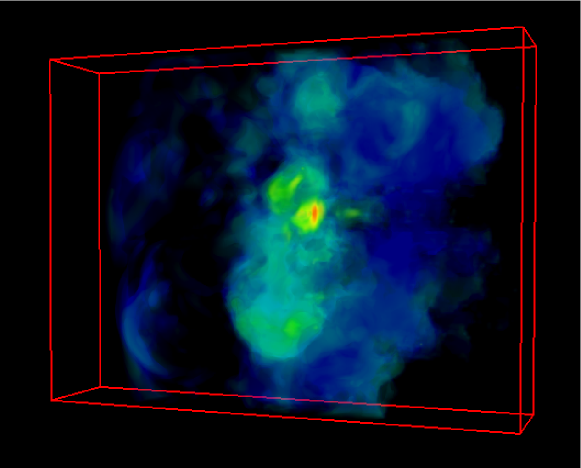
McCarthy et al. (1991) have found that in almost all cases of their sample, that the extended optical line emission in [OII] is brightest on the side of the shorter lobe, indicating that environmental effects cause the length asymmetries in powerful radio sources. Our 3D hydrodynamical simulations are now able to provide theoretical support for this scenario. Dense clouds or atomic or molecular gas in the ISM are able to restrain a propagating jet for some time due to their large inertia, causing asymmetries in the observed radio source. At the same time, the impact of the jet has considerable effects on the clouds themselves: depending on the exact location and cloud properties, they are accelerated, shock-ionized and ablated by the jet’s ram pressure and compressed by the high pressure in the jet cocoon. Cooling by line emission stabilizes them additionally (cf. Mellema et al., 2002) and results in bright emission at the location of the strongest interaction with the jet. Fig. 8 shows the density of the group of clumps responsible for the large asymmetry in the simulation and the strongly increased pressure (hence strongest expected shock ionization) at the impact location of the jet on the clumps. The long-term survival of the clouds, however, does not only depend on their direct interaction with the jet and its bow shock, but also on their long exposure to the fast and turbulent cocoon plasma (Krause & Alexander, 2007), which may destroy but also create emission line clouds.
While radio sources in the local universe can grow more easily due to small gas fractions and deposit their energy also at larger distances (e.g. stopping cooling flows), radio galaxies at high redshift can be expected to show considerably more interaction with the gas-rich and clumpy environment and the cold gas phase. In fact, the clumpy appearance of high redshift galaxies (Elmegreen et al., 2007) and clumps formed by Toomre unstable discs in cosmological simulations (Ceverino et al., 2010) support this scenario. And while strong radio source asymmetry is only the morphological consequence, the actual feedback caused by the interaction may be vigorous.
6 Summary
We have performed 3D hydrodynamic simulations of powerful extragalactic jets interacting with a disc-shaped clumpy interstellar medium of log-normal density distribution. As a first step of analysis, in this paper we have focussed on the jet asymmetry and its relation to the inhomogeneous ISM. The interaction between the jet and its environment does not only occur by direct impact of the jet beam on the clouds, but also by a early blastwave phase which considerably changes the ISM and thereby changes the environment through which the beam propagates then later-on. We find that the inner region is mostly cleared of dense clumps by the jet activity except for some highly compressed structures in the disc plane, while the gas at larger radii is only effected by the bow shock and the jet backflow impacting on the disc vertically. Asymmetries are caused by dense clouds that are in or near the jet’s path and greatly decelerate the jet head and result in a propagation delay which will generally not be the same for both jets. We have analyzed the observed asymmetry by means of Monte Carlo simulations based on a 1D propagation model for the jet through the dense medium and find that the properties of the ISM can be translated to a probability distribution of jet arm length asymmetries. Disc density and height are found to have the largest effect on the asymmetry for realistic parameter ranges. The shape and slope of the Fourier energy spectrum of the ISM density only has a small effect on the asymmetry, as has the width of the density distribution (related to the turbulent Mach number) due to the changes in the filling factor. The hydrodynamic simulations showed that asymmetries in general may have a wider distribution than expected from the 1D model due to the complex interaction of the jet and its bow shock with gaseous clumps, going much beyond simple energy disposal. According to our model, observed asymmetries of medium-sized local radio galaxies can be explained by gas masses in massive elliptical galaxies of order to . Furthermore, the hydrodynamic simulations provide a theoretical basis for the observations of McCarthy et al. (1991) that emission line nebulae in high redshift radio galaxies are generally found to be brighter on the side of the shorter lobe due to stronger dissipation and a resulting delay in jet propagation. This interaction of jets particularly with the cold gas phase shows that jet activity may have considerable impact on the evolution of high redshift galaxies, where star formation may be triggered in compressed dense clumps of gas, or quenched due to destruction or removal of the cold clumps.
Acknowledgments
VG wishes to acknowledge financial support by the Deutsche Forschungsgesellschaft (Priority Programme SPP 1177) and support by Romain Teyssier with RAMSES. SK thanks Joe Silk for helpful discussions and acknowledges support from the Royal Society Joint Projects Grant JP0869822. Computations were performed on the SFC cluster of TMoX at MPE. The authors made use of VAPOR for visualization purposes (Clyne & Rast, 2005; Clyne et al., 2007).
References
- Arshakian & Longair (2000) Arshakian T. G., Longair M. S., 2000, MNRAS, 311, 846
- Catinella et al. (2010) Catinella B. et al., 2010, MNRAS, 403, 683
- Ceverino et al. (2010) Ceverino D., Dekel A., Bournaud F., 2010, MNRAS, 404, 2151
- Clyne et al. (2007) Clyne J., Mininni P., Norton A., Rast M., 2007, New J. Phys, 9, 301
- Clyne & Rast (2005) Clyne J., Rast M., 2005, in Erbacher R. F., Roberts J. C., Gröhn M. T., Börner K., eds., Visualization and Data Analysis 2005. Proc. SPIE, 5669, 284
- Elmegreen et al. (2007) Elmegreen D. M., Elmegreen B. G., Ravindranath S., Coe D. A., 2007, ApJ, 658, 763
- Emonts et al. (2010) Emonts B. H. C. et al., 2010, MNRAS, 406, 987
- Erb (2008) Erb D. K., 2008, ApJ, 674, 151
- Förster Schreiber et al. (2009) Förster Schreiber N. M. et al., 2009, ApJ, 706, 1364
- Gaibler & Camenzind (2010) Gaibler V., Camenzind M., 2010, in Nagel W. E., Kröner D. B., Resch M. M., eds, High Performance Computing in Science and Engineering ’09. Springer, p. 3
- Gaibler et al. (2009) Gaibler V., Krause M., Camenzind M., 2009, MNRAS, 400, 1785
- Jeyakumar et al. (2005) Jeyakumar S., Wiita P. J., Saikia D. J., Hooda J. S., 2005, A&A, 432, 823
- Krause (2003) Krause M., 2003, A&A, 398, 113
- Krause & Alexander (2007) Krause M., Alexander P., 2007, MNRAS, 376, 465
- Kritsuk et al. (2007) Kritsuk A. G., Norman M. L., Padoan P., Wagner R., 2007, ApJ, 665, 416
- McCarthy (1993) McCarthy P. J., 1993, ARA&A, 31, 639
- McCarthy et al. (1991) McCarthy P. J., van Breugel W., Kapahi V. K., 1991, ApJ, 371, 478
- Mellema et al. (2002) Mellema G., Kurk J. D., Röttgering H. J. A., 2002, A&A, 395,
- Mullin et al. (2008) Mullin L. M., Riley J. M., Hardcastle M. J., 2008, MNRAS, 390, 595
- Nesvadba et al. (2008) Nesvadba N. P. H., Lehnert M. D., De Breuck C., Gilbert A. M., van Breugel W., 2008, A&A, 491, 407
- Pedelty et al. (1989) Pedelty J. A., Rudnick L., McCarthy P. J., Spinrad H., 1989, AJ, 97, 647
- Ryle & Longair (1967) Ryle M., Longair M. S., 1967, MNRAS, 136, 123
- Scheuer (1995) Scheuer P. A. G., 1995, MNRAS, 277, 331
- Sutherland & Bicknell (2007) Sutherland R. S., Bicknell G. V., 2007, ApJS, 173, 37
- Tacconi et al. (2010) Tacconi L. J. et al., 2010, Nature, 463, 781
- Teyssier (2002) Teyssier R., 2002, A&A, 385, 337
- Wardle & Aaron (1997) Wardle J. F. C., Aaron S. E., 1997, MNRAS, 286, 425