Quantifying the collisionless nature of dark matter and galaxies in A1689
Abstract
We use extensive measurements of the cluster A1689 to assess the expected similarity in the dynamics of galaxies and dark matter (DM) in their motion as collisionless ‘particles’ in the cluster gravitational potential. To do so we derive the radial profile of the specific kinetic energy of the cluster galaxies from the Jeans equation and observational data. Assuming that the specific kinetic energies of galaxies and DM are roughly equal, we obtain the mean value of the DM velocity anisotropy parameter, and the DM density profile. Since this deduced profile has a scale radius that is higher than inferred from lensing observations, we tested the validity of the assumption by repeating the analysis using results of simulations for the profile of the DM velocity anisotropy. Results of both analyses indicate a significant difference between the kinematics of galaxies and DM within . This finding is reflected also in the shape of the galaxy number density profile, which flattens markedly with respect to the steadily rising DM profile at small radii. Thus, seems to be a transition region interior to which collisional effects significantly modify the dynamical properties of the galaxy population with respect to those of DM in A1689
Subject headings:
clusters: galaxies – clusters: individual: A16891. Introduction
The properties of dark matter (DM), which is believed to be mostly cold and collisionless, have been extensively explored in dynamical simulations. A much touted result from these simulations is the “universal” density profile (Navarro, Frenk, & White 1997, hereafter NFW; Moore et al. 1998) of galaxies and galaxy clusters. As the main mass constituent of galaxy clusters, DM largely self-gravitates and dominates the hydrodynamics of intracluster (IC) gas and the dynamics of member galaxies. Cluster DM density profiles deduced from X-ray observations (Pointecouteau, Arnaud, & Pratt 2005; Vikhlinin et al. 2006; Schmidt & Allen 2007; Arnaud, Pointecouteau, & Pratt 2008), galaxy velocity distribution (Diaferio, Geller, & Rines 2005), SZ measurements (Atrio-Barandela et al. 2008), and strong and weak lensing measurements (Broadhurst et al. 2005a, hereafter B05a; Broadhurst et al. 2005b, hereafter B05b; Limousin et al. 2007; Medezinski et al. 2007; Lemze et al. 2008, hereafter L08; Broadhurst et al. 2008; Zitrin et al. 2009, 2010; Umetsu et al. 2010) are broadly claimed to be consistent with NFW profiles. However, the shape of the profile in the inner cluster region where it is predicted to have a characteristic radial slope of has been deduced to be shallower in some studies (Kravtsov et al. 1998; Ettori et al. 2002; Sanderson et al. 2004) and steeper, around , in others (Fukushige & Makino 1997, 2001, 2003; Moore et al. 1999; Ghigna et al. 2000; Klypin et al. 2001; Navarro et al. 2004; Limousin et al. 2008).
A more complete description of the clustering properties of DM necessitates characterization of its phase space distribution. Whereas the DM density profile can be determined directly from analysis of X-ray, lensing, and SZ measurements, deducing the DM velocity distribution is considerably more challenging. On the other hand, the dynamical properties of member galaxies can be studied directly in terms of their density and velocity profiles, including a study of the radial behavior of the velocity dispersion. Also, the location of the velocity ‘caustics’ can now be studied both in individual massive clusters where the data quality is high (Lemze et al. 2009, hereafter L09) and in composite surveys for which only lower quality measurements are available but statistical results can be derived (e.g., Biviano & Girardi 2003).
The dynamical evolution of the galaxy population in a cluster is presumed to be largely collisionless following an initial phase of mean-field (‘violent’) relaxation of the main sub-cluster progenitors that merged to form the cluster. This collisionless behavior is expected particularly outside the central cluster region. As such, the basic dynamical characteristics of cluster galaxies are expected to resemble those of DM, which is strictly collisionless. For example, in the cluster 1E0657-56 - the ”bullet cluster” - despite a recent collision of two massive clusters, the spatial distributions of DM and galaxies are quite similar. A conical shaped shock front is visible indicating two clusters have passed through each other with an obvious collisionally merged gas distribution, but the galaxies and the lensing mass are largely intact, implying straightforwardly that the DM and galaxies are collisionless (Markevitch et al. 2002; Clowe et al. 2004; Bradač et al.2006). In the colliding cluster A520, on the other hand, a massive dark core is claimed to coincide with the central X-ray emission peak, but the region is largely devoid of galaxies (Mahdavi et al. 2008), though this depends on the way the weak lensing analysis is formulated (Okabe & Umetsu 2008).
With increasingly extensive and precise data, such as we have acquired for A1689, it is now possible to assess the collisionless nature of galaxies and DM by measuring the degree of consistency between the measured galaxy and DM density profiles and the profile of the DM velocity anisotropy. A1689 seems well relaxed (with possibly a small deviation from a relaxed state; Andersson & Madejski 2004). It has a centrally located cD galaxy, and an X-ray emission region that is spherically symmetric (Xu & Wu 2002; L08; Riemer-Sorensen et al. 2008). The cluster has well-defined galaxy velocity caustics with no major infall of matter close to the virial radius (L09), and only a low level of substructure (Broadhurst et al. 2005a,b; Umetsu & Broadhurst 2008).
We have previously determined the DM and gas density profiles in A1689 from a combined analysis of lensing and X-ray measurements (L08), using an approach that we refer to as model-independent, since we did not assume particular functional forms for the profiles. Additionally, we extended the analysis by including photometric and spectroscopic measurements of a very large number of galaxies in the A1689 field, from which we deduced the positions and radial velocities of cluster members. These results made it possible to deduce the galaxy velocity anisotropy profile, which was found to exhibit the expected behavior, varying between predominantly radial orbits at large radii towards more tangential orbits near the center (L09).
Here we show that with the above information we can infer the DM velocity anisotropy which we compare with the galaxy velocity anisotropy profile and with results from simulations. The paper is organized as follows; in § 2 we describe our method for determining the DM velocity anisotropy. In § 3 we compare the DM and galaxy density profiles (§ 3.2), derive the DM velocity anisotropy and compare it with the galaxy velocity anisotropy profile and results from simulations (§ 3.1), and estimate the collisionless profile of cluster galaxies (§ 3.3). We conclude with a summary and discussion in § 4.
2. Methodology
In this section we present the procedure for deriving the DM velocity anisotropy using results from our previous analyses of the galaxy dynamics (L09) and the total mass density profile (L08) of A1689. In L08 we combined lensing and X-ray measurements to determine model-independent profiles of the gas and total mass density profiles (i.e., without assuming particular functional forms). In the second stage of the work (L09) the galaxy surface number density and the projected velocity dispersion were included and analyzed using the Jeans equation, from which we obtained profiles of the 3D galaxy number density and the galaxy velocity anisotropy.
The dynamics of a collisionless gas are governed by the Jeans equation (Binney & Tremaine 1987)
| (1) |
where DM, gal, and is the density of element . The velocity anisotropy profile is
| (2) |
where is the radial velocity dispersion, and is the (1D) transverse velocity dispersion. Using eq. 1 for the galaxies, the degeneracy between and can be removed with sufficient spectroscopic data (L09). This procedure is obviously irrelevant in the case of DM, for which we have to adopt an alternative approach.
The orbit of a test particle in a collisionless gravitational system is independent of the particle mass. This would presumably imply that once hydrostatic equilibrium is attained, most likely as a result mixing and mean field relaxation, DM and galaxies should have the same mean specific kinetic energy, i.e.,
| (3) |
where
| (4) |
Additionally, it is expected that the total specific kinetic energy of DM particles is proportional to that of the gas (e.g., Mahdavi 2001; Host et al. 2008), . Observational evidence for this scaling relation comes from combined X-ray and optical observations of groups and clusters for which the mean emission-weighted gas temperature scales roughly as the second power of the total galaxy velocity dispersion (Mulchaey & Zabludoff 1998; Xue & Wu 2000).
The temperature and density profiles of IC gas can be deduced from X-ray spectral and surface brightness measurements. These profiles can then be used to determine the total mass distribution from a solution of the hydrostatic equilibrium equation. We have recently developed a model-independent joint lensing/X-ray analysis procedure (L08) to examine the consistency of X-ray temperature and emission profiles with the lensing based mass profile, finding that the cluster temperature profile is systematically 30-40% lower than expected when solving the equation of hydrostatic equilibrium using the lensing-deduced mass profile. This discrepancy may reflect in part the ambiguity in deriving 3D temperatures from projected spectral X-ray data, stemming from the sampling of a range of gas temperatures along any given line of sight (Mazzotta et al. 2004; Vikhlinin 2006). This could also be partly related to the small-scale structure of the gas [possibly including relatively dense cooler clouds found in simulations (Kawahara et al. 2007)] which may result in a significant downward bias in temperature estimates from spectral X-ray observations. The inferred temperature is also sensitive to instrumental effects, as has recently been deduced in the analysis of Chandra observations of A1689 (Peng et al. 2009). Other reasons for temperature biases can be deviations from equilibrium and non-thermal pressure (Molnar et al. 2010). Even in the best-case scenario the temperature can be used as a reliable tracer for only in the inner part of the cluster, where hydrostatic equilibrium applies, and also only at radii larger than about , since at smaller radii the specific energy of the gas and DM may be different (Rasia, Tormen, & Moscardini 2004).
For our analysis we assume an NFW-like profile for the DM density
| (5) |
and take the DM velocity anisotropy to be constant, i.e., , since the data is not sufficient to meaningfully constrain more than one free parameter in this quantity. We then relate our model parameters to the DM radial velocity dispersion, , using the Jeans equation, where the (total) mass profile is taken from L08. Here we allow for the possibility of a difference between the total density profile (directly measured by lensing) and the profile of just the DM. From the DM velocity anisotropy and radial velocity dispersion we can then deduce the DM total specific kinetic energy. Best-fit values of and are determined by fitting the DM total specific kinetic energy to the galaxy total specific kinetic energy. More specifically, and are determined by minimizing , where and C is the covariance matrix of the measured . The galaxy total specific kinetic energy itself is not a direct measurement. It was derived as shown in eq. 4 from and . Since the values of at the various radial positions are derived from underlying parameterized expressions (as given below for ), their uncertainties are correlated.
The derivation of and is carried out by following the same procedure as in L09, except for allowing a higher freedom of at large radii. N-body simulations for a variety of cosmologies show that the velocity anisotropy has a nearly universal radial profile (Cole & Lacey 1996; Carlberg et al. 1997). In accord with the work of L09, is taken to have the following form:
| (6) |
where we note that was adopted by L09. Now, the total number of bins cannot exceed the total number of free parameters in the expressions for and , which is , since a larger number would cause a complete degeneracy among the various values of . Even taking bins resulted in an unphysical correlation matrix (i.e., one having a negative eigenvalue), which still indicates a near-degeneracy. Therefore we adopted 5 radial bins of , which was the maximum number for which degeneracy is not significant and error estimates are reasonable.
3. Results
3.1. Velocity anisotropy profiles
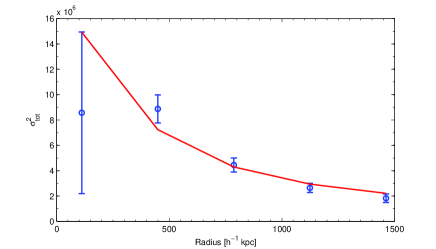
The DM velocity anisotropy, , was determined as described in § 2, with the constraint that the DM total specific kinetic energy must satisfy . The resulting acceptable fit, with , is shown in figure 1. The best-fit parameters of the analytical expressions for the DM density and velocity anisotropy profiles are given in table 1. It is important to note that while the errors on the parameters are rather large, in this fit we have constrained the DM parameters based only on the fit to equation 3, without assuming the DM density profile to be similar to the total mass density profile. Thus, the results allow a largely independent comparison between the consequences of assuming equation 3 and the results of other observational probes of the cluster.
| Parameter | Value |
|---|---|
| [h-1 kpc] | |
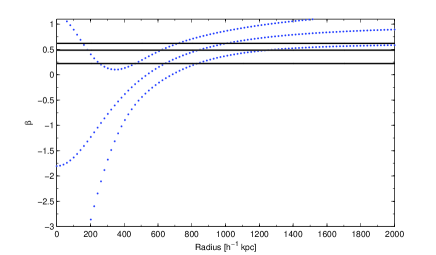
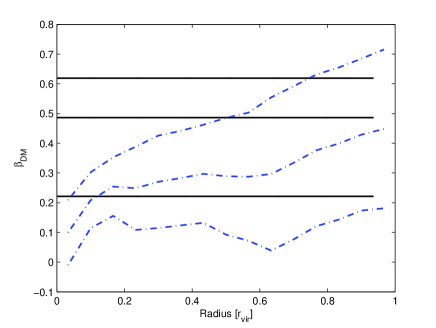
The corresponding galaxy and DM velocity anisotropy profiles are plotted in figure 2 (top panel) together with their respective 1– uncertainties. In figure 2 (lower panel) we compare the derived DM velocity anisotropy value to the profile derived from simulations. The current data only allow us to determine an overall, typical value of in the cluster, and given the rather large uncertainties, there is fair agreement between this value and the typical value of in this cluster, and also with the typical values of seen in simulated clusters. Note from the figure that while we allowed to be a free parameter for the galaxies, the best-fit value came out quite close to unity.
We briefly describe the derivation of the DM velocity anisotropy profile from results of an ENZO simulation (for a more complete description of this particular simulation, please refer to Hallman et al. 2007). Since A1689 is a moderately-distant (z=0.183), high mass cluster, h-1 M⊙ (Broadhurst et al. 2005a; Oguri et al. 2005; Limousin et al. 2007; L08; Umetsu & Broadhurst 2008; L09; Umetsu et al. 2009; Corless et al. 2009; Coe et al. 2010), we derive the DM velocity anisotropy profiles for a sample of high-mass clusters with h M⊙ at . The clusters were drawn from a cosmological adaptive mesh refinement (AMR) simulation performed with the ENZO code developed by Bryan & Norman (1997) and Norman & Bryan (1999) assuming a spatially flat CDM model (very similar to the concordance model). The AMR simulation assumed adiabatic gas dynamics (i.e., neither radiative heating, cooling, star formation or feedback were included). The box size was 512 h-1 Mpc comoving on a side with DM particles, and DM mass resolution of about h M⊙. The root grid contained grid cells, and the grid was refined by a factor of two, up to seven levels, providing a spatial resolution of kpc h-1 at . For each halo out of the total number of 51, we derive the DM velocity anisotropy profile, which is averaged over all halos, with an uncertainty that is taken to be the standard deviation as determined by Lemze et al. (2010, in preparation). The derived profile is in agreement with those found in other studies (e.g., Colin, Klypin, & Kravtsov 2000; DM04; Mamon & Lokas 2005; Valdarnini 2006).
3.2. Density profiles
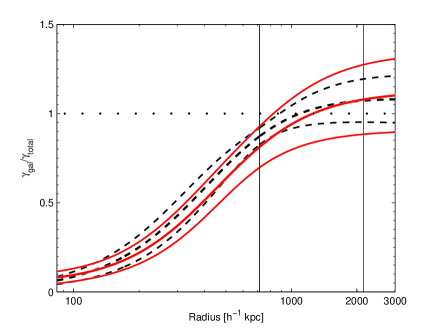
To further explore phase space occupation of DM and galaxies, we compare the deduced DM density profile to the galaxy and to the total density profile. The shape of the galaxy density profile is represented with a core, and that of the total density with either a model-independent profile, a ‘universal’ NFW form, or a cored form. In figure 3 we compare our results for these profiles, i.e., we compare the DM density from our current fitting to equation 3 (green dot-dashed curves showing the best-fit result as well as the 1– uncertainty region) to our previous results for the galaxy density (blue solid curves) and the total mass profile, whose various versions are shown by the points with error bars (model-independent fit), dashed black curve (NFW), and dotted red curve (core). In order to include all these in the same figure, and allow a comparison of the relative shapes, we arbitrarily scaled the profiles so that they match at 700 h-1 kpc (with arbitrary units in the -axis).
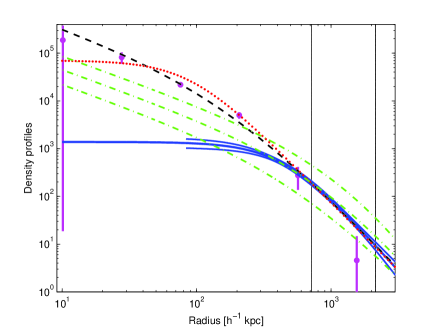
While the DM scale radius derived here from the velocity dispersion fit has a large error, its best-fit value is significantly higher than that derived previously (L08, table 4) for the total (mostly DM) density. This is reflected by the slower rise of the DM density at small radii compared to the total density (figure 3). This may indicate that our assumption of eq. 3 invalid at small radii.
Another perspective on the assumption that DM follows the same dynamics as the galaxies can be seen from the steepness of the directly measured density profiles. To assess the steepness of the fitted profiles we plot in figure 4 the distribution of their power-law indices,
| (7) |
The power-law index of the galaxy profile is shown by the blue lines, and that of the total mass profile by the black (NFW) and red (core) lines. We did not plot also the power-law slope of the model-independent fit, since it is clear from figure 3 that it would look very similar to the results for the NFW and core profiles. Since the DM profile should be rather similar to the total mass profile, the conclusion from these figures here again is that the galaxies and the DM have consistent density profiles for , but the profiles are significantly different at smaller radii.

3.3. The collisionless profile of cluster galaxies
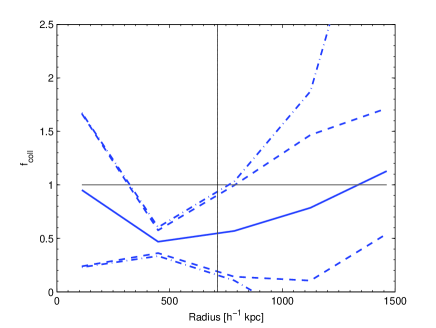
In § 3.1 we derived the DM velocity anisotropy profile assuming that both galaxies and DM are collisionless, finding that the best-fit value of DM density scale radius is higher than inferred from direct lensing observations for the total mass (L08). As was mentioned above, this may indicate that eq. 3 is not valid at all radii. To quantify differences between and we use the ratio
| (8) |
which we expect to be very close to unity if both components are fully collisionless (or if both deviate comparably from the purely collisionless limit).
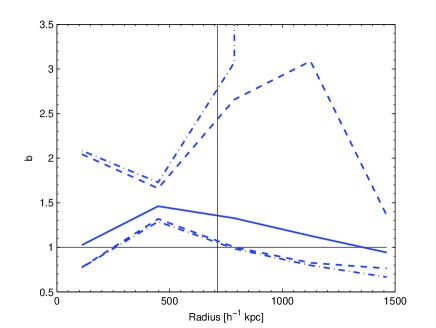
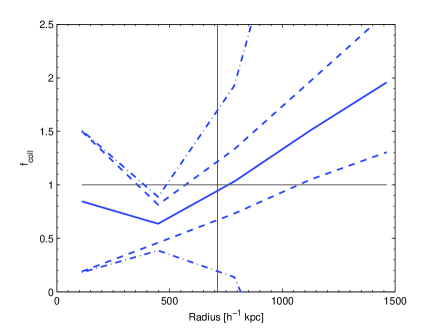
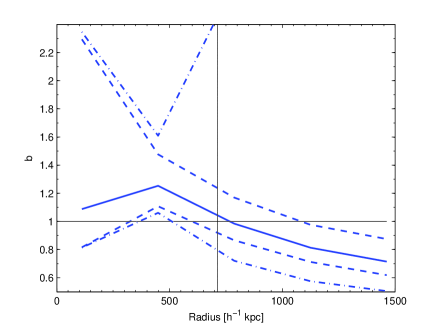
We have thus far assumed that must equal unity and tried to obtain acceptable fits under this assumption, deriving other results in the process. Here we try a different approach, where we start by assuming that the DM velocity anisotropy profile in A1689 matches the profile derived from simulations (see § 3.1). We used our previously-determined DM mass density, , derived by assuming profiles for the total and gas density profiles. Two kinds of profiles were assumed, a model-independent and a model-dependent one, where in the model-dependent case we assumed an NFW and double beta model for the total and gas density profiles, respectively. After assuming a profile for the total and gas density profile, we can then solve the Jeans equation to determine . In figures 5 and 6 we show the resulting ratio , or equivalently the corresponding velocity bias of the galaxies relative to the DM
| (9) |
for the model-independent and model dependent profiles, respectively. Our results are consistent with both the galaxies and the DM being purely collisionless at , but there is some evidence for a significant deviation from this limit at smaller radii (except for the very smallest radii, where the observational constraints are weak).
4. Discussion
The work reported here is a continuation of our comprehensive study of the dynamical properties of DM and galaxies, and the hydrodynamical properties of IC gas in the well-observed cluster A1689 (L08, L09). In L09 we derived the galaxy density and velocity distributions, from which we deduced the specific kinetic energy of the galaxies. In the work reported here we assumed that if DM and galaxies are fully collisionless they should have the same average specific kinetic energy (as manifested in eq. 3). Using the mass profile which was previously derived in L08, together with the Jeans equation, we fitted the DM to the galaxy specific kinetic energy and determined the DM density and the DM velocity anisotropy.
For the DM density we obtained a best-fit value for the power law index at large radii, , which is higher (i.e., steeper) than the NFW value of 3 by about . The best-fit value of the scale radius is higher than the scale radius of the total density This was the first of several indications that the dynamical state of the galaxies and the DM may differ at small radii, below . In particular, our assumption of eq. 3 resulted in a derived DM density profile at small radii that was inconsistent with (specifically, shallower than) that we have previously measured for the total matter density.
In order to quantify the possible difference between and , we used another approach to determine their ratio . Specifically, we adopted the profile of deduced from simulations and our derived DM mass density (from L08), together with the Jeans equation. The deduced profile of can be interpreted as a measure of how collisionless are the galaxies with respect to the DM (which is equivalently expressed also by , the velocity bias of eq. 9). Note that in some simulation work the velocity bias is defined in terms of the velocity dispersions of DM subhalos (rather than galaxies) compared to the DM background. We find that (at ) at some radii below , but that it is consistent with unity at larger radii. This implies that at we can indeed assume the validity of eq. 3, but at h-1 kpc we deduce and , for the model-independent and model dependent profiles, respectively, an indication that increases from large radii towards the center. This is in accord with results from simulations which found to vary from slightly higher than one (by ) at large radii (Ghigna et al. 2000; Colin, Klypin, & Kravtsov 2000; Diemand, Moore, & Stadel, 2004, hereafter DMS04; Gill et al. 2004) to in the central region () (Ghigna et al. 2000; DMS04).
We note that there is some uncertainty regarding the dependence of this bias on the features of the subhalos or galaxies considered; e.g., whereas DMS04 found the bias to be independent of the subhalo mass, Ghigna et al. (2000) claim that there is no significant bias when only high-mass subhalos are considered. In an earlier work Diaferio et al. (1999) found a bias for blue galaxies of about , but no bias for red galaxies. Their interpretation was that the bias is due to the fact that blue galaxies are not in equilibrium. The velocity bias can be explained by the fact that slow subhalos are much less common, due to tidal disruption early in the merging process, before the cluster was virialized. Halos with low relative velocities can merge shortly after entering the cluster, thus decreasing the number of small subhalos with low velocities; after virialization, mergers are suppressed (Gnedin 2003). Large subhalos, Mcluster, are more likely to merge with the central halo, rather than in subhalo-subhalo mergers (Angulo et al. 2008). Thus, in the central part of the cluster there is also a decrease in the number of massive subhalos with low velocities. This may explain why the value of increases, going from the outer region towards the cluster center. The baryon content of halos may also affect the velocity bias: Due to ram-pressure stripping of galactic gas, which is more effective in the central cluster region (e.g., Arieli, Rephaeli, & Norman 2008), the subhalo mass is more easily reduced by tidal disruption. The deduced subhalo mass function is reduced relative to that deduced from a corresponding DM-only simulation (Dolag et al. 2008).
The current data only allow determining an overall typical value of ; its best-fit value is in general agreement with the deduced from the data, and the value of found in simulations. As we noted, our assumption of eq. 3 is likely valid at large radii, which implies that the procedure specified in § 2 is more reliable there. Host et al. (2009) used the X-ray temperature as a surrogate measurement for deriving the DM velocity anisotropy profile at intermediate radii by assuming a connection between and . They applied their analysis to 11 low redshift and 5 intermidiate redshift clusters, including A1689. Their deduced values for are in very good agreement with our best-fit value. Together the two methods enable estimating the DM velocity anisotropy at all radii. Our approach here is less prone to the substantial uncertainty inherent in an attempt to determine the DM velocity anisotropy from a similar treatment which is based on IC gas properties. A possible difficulty with the latter approach may be due to a nonthermal pressure component that could appreciably affect results inferred from a solution to the hydrostatic equilibrium equation (e.g., Molnar et al. 2010).
It can be seen from figure 3 and 4 that at h-1 kpc there is a change in the relation between the dynamical properties of the DM and galaxies. Carlberg (1994) showed analytically that if one assumes a power-law mass density profile and isotropic velocity dispersion, this yields a power-law profile for the velocity dispersion. He also found that in general a cooler tracer has a steeper density profile and is more centrally concentrated. We find that at small radii, , , implying that DM is cooler than galaxies. Indeed, at these radii the DM profile is steeper (see figure 4) and more concentrated (see figure 3) than that of galaxies. The subhalo distribution would naively be expected to be closely related to the distribution of galaxies. In fact, galaxies and subhalos represent different populations and are not directly comparable since subhalo masses are more strongly affected by tidal stripping than galactic baryonic matter. It was shown in simulations that subhalos within typically lose more than 70% of their mass during the merging phase, while subhalos at typically lose only of their mass (Nagai & Kravtsov 2005, hereafter NK05).
It was previously inferred from simulations that there is a spatially anti-biased subhalo distribution, in the sense that the DM subhalo profile has a larger core radius than the background DM profile (DMS04; Gao et al. 2004a). DMS04 interpreted their result as due to missing half of the halo population caused by the known numerical overmerging problem. However, NK05 used a high-resolution cosmological cluster simulation to show that the subhalo radial distribution is significantly less concentrated than that of DM due to tidal stripping, rather than this being a numerical artifact. They demonstrated that the radial bias disappears almost entirely if subhalos are selected using their mass or circular velocity during the merger phase. A similar result was obtained by Gao et al. (2004b) who found that defining the subhalo population by requiring a minimum circular velocity gives a subhalo distribution which is more concentrated than when selection is based on a minimum mass. This results from the fact that the subhalo distribution is easier to track by using the maximum circular velocity values, since mass loss is also accompanied by a decrease in the maximum circular velocity, but the decrease is slower than in the mass (NK05).
In many previous studies the observed galaxy distribution was taken to be cuspy and similar to that of DM (e.g., DMS04; Gao et al. 2004a; NK05), using the galaxy distribution from Carlberg, Yee, & Ellingson (1997, hereafter CYE97), who co-added observations of 14 clusters at various redshifts. The superposed sample contained 1150 galaxies, including background galaxies. In the L09 analysis of A1689, 500 cluster members were identified from spectroscopic data, and about 1900 cluster members from photometric data. L09 showed that the galaxy density profile is best fitted with a core profile; although a cuspy profile was found to be acceptable, the deduced values of the scale radius and the power-law index were questionable. Indeed, the cuspy profile in CYE97 gave a better fit with a higher power-law index (preferring Hernquist (1990) rather than an NFW profile), yielding a quite high value of the scale radius, . Moreover, Adami et al. (1998) examined a sample of 62 clusters and found that most galaxy density profiles are better fitted with a cored rather than a cuspy profile, though for individual clusters the preference for a cored profile is rarely significant at the 90% confidence level. When Adami et al. (1998) composed a superposed sample they obtained a clear preference for a core (King) profile (at more than 95 % confidence). Adami et al. (1998) showed that CYE97, as well as Beers & Tonry (1986), obtained a cuspy profile due to selection bias caused by not taking into account the effect of elongation. In some recent simulations (e.g., Saro et al. 2006) that included gas cooling and star formation, a detailed treatment of stellar evolution and chemical enrichment, as well as SN energy feedback in the form of galactic winds, the galaxy density profile has a shallower core, quite different from the cuspy DM profile at small radii, .
Finally, we note that our approach of inferring using the Jeans equation, which is derived from the collisionless Boltzmann equation, is not fully self-consistent since at small radii, , we find possible deviation from a fully collisionless behavior. In addition, for simplicity we assumed that the cluster is spherically symmetric, though there are claims that this cluster has a significantly triaxial shape (Oguri et al. 2005; Morandi et al. 2010). However, biases due to the triaxial nature of the cluster should affect the DM and galaxies fairly similarly since they have a similar distribution. More importantly, it should be kept in mind that the results reported here are based on a comprehensive analysis of only one cluster. Obviously, the results should be viewed as preliminary until reproduced by a similar analysis of a sufficiently large sample of clusters. We plan to do so with a larger sample of relaxed X-ray selected clusters in the CLASH program111PI: Marc Postman; http://www.stsci.edu/postman/CLASH/.
ACKNOWLEDGMENTS
We thank Alexey Vikhlinin, Greg Bryan, and Steen Hansen for many helpful discussions. We acknowledge discussions also with Shay Zucker, Ole Host, and Sharon Sadeh. DL acknowledges generous support by Dan David Foundation. The work of YR and MN was supported in part by US-Israel Binational Science Foundation grant 452/2008 at Tel Aviv University. RB acknowledges Israel Science Foundation grant 823/09. TJB and YR are supported by Israel Science Foundation grant 1218/06
References
- Adami et al. (1998) Adami, C., Mazure, A., Katgert, P., & Biviano, A. 1998, A&A , 336, 63
- Andersson & Madejski (2004) Andersson, K. E., & Madejski, G. M. 2004, ApJ , 607, 190
- Angulo et al. (2008) Angulo, R. E., Lacey, C. G., Baugh, C. M., & Frenk, C. S 2008, arXiv:0810.2177
- Arieli et al. (2008) Arieli, Y., Rephaeli, Y., & Norman, M. L. 2008, ApJ , 683, L111
- Arnaud et al. (2005) Arnaud, M., Pointecouteau, E., & Pratt, G. W. 2005, A&A , 441, 893
- Atrio-Barandela et al. (2008) Atrio-Barandela, F., Kashlinsky, A., Kocevski, D., & Ebeling, H. 2008, ApJ , 675, L57
- Beers & Tonry (1986) Beers, T. C., & Tonry, J. L. 1986, ApJ , 300, 557
- Benatov et al. (2006) Benatov, L., Rines, K., Natarajan, P., Kravtsov, A., & Nagai, D. 2006, MNRAS , 370, 427
- Binney & Tremaine (1987) Binney, J., & Tremaine, S. 1987, Princeton, NJ, Princeton University Press, 1987, 747 p.,
- Biviano & Girardi (2003) Biviano, A., & Girardi, M. 2003, ApJ , 585, 205
- Biviano & Salucci (2006) Biviano, A., & Salucci, P. 2006, A&A , 452, 75
- Bradač et al. (2006) Bradač, M., et al. 2006, ApJ , 652, 937
- Broadhurst et al. (2005a) Broadhurst, T., et al. 2005, ApJ , 621, 53 (B05a)
- Broadhurst et al. (2005b) Broadhurst, T., Takada, M., Umetsu, K., Kong, X., Arimoto, N., Chiba, M., & Futamase, T. 2005, ApJ , 619, L143 (B05b)
- Broadhurst et al. (2008) Broadhurst, T., Umetsu, K., Medezinski, E., Oguri, M., & Rephaeli, Y. 2008, ApJ , 685, L9
- Bryan & Norman (1997) Bryan, G. L., & Norman, M. L. 1997, Computational Astrophysics; 12th Kingston Meeting on Theoretical Astrophysics, 123, 363
- Carlberg (1994) Carlberg, R. G. 1994, ApJ , 433, 468
- Carlberg et al. (1997) Carlberg, R. G., et al. 1997, ApJ , 485, L13
- Carlberg et al. (1997) Carlberg, R. G., Yee, H. K. C., & Ellingson, E. 1997, ApJ , 478, 462 (CYE97)
- Coe et al. (2010) Coe, D., Benitez, N., Broadhurst, T., Moustakas, L., & Ford, H. 2010, arXiv:1005.0398
- Corless et al. (2009) Corless, V. L., King, L. J., & Clowe, D. 2009, MNRAS , 393, 1235
- Clowe et al. (2004) Clowe, D., Gonzalez, A., & Markevitch, M. 2004, ApJ , 604, 596
- Cole & Lacey (1996) Cole, S., & Lacey, C. 1996, MNRAS , 281, 716
- Colín et al. (2000) Colín, P., Klypin, A. A., & Kravtsov, A. V. 2000, ApJ , 539, 561
- Diaferio et al. (1999) Diaferio, A., Kauffmann, G., Colberg, J. M., & White, S. D. M. 1999, MNRAS , 307, 537
- Diaferio et al. (2005) Diaferio, A., Geller, M. J., & Rines, K. J. 2005, ApJ , 628, L97
- Diemand et al. (2004) Diemand, J., Moore, B., & Stadel, J. 2004, MNRAS , 352, 535 (DMS04)
- Dolag et al. (2008) Dolag, K., Borgani, S., Murante, G., & Springel, V. 2008, arXiv:0808.3401
- Ettori et al. (2002) Ettori, S., Fabian, A. C., Allen, S. W., & Johnstone, R. M. 2002, MNRAS , 331, 635
- Fukushige & Makino (1997) Fukushige, T., & Makino, J. 1997, ApJ , 477, L9
- Fukushige & Makino (2001) Fukushige, T., & Makino, J. 2001, ApJ , 557, 533
- Fukushige & Makino (2003) Fukushige, T., & Makino, J. 2003, ApJ , 588, 674
- Gao et al. (2004a) Gao, L., De Lucia, G., White, S. D. M., & Jenkins, A. 2004, MNRAS , 352, L1
- Gao et al. (2004b) Gao, L., White, S. D. M., Jenkins, A., Stoehr, F., & Springel, V. 2004, MNRAS , 355, 819
- Ghigna et al. (2000) Ghigna, S., Moore, B., Governato, F., Lake, G., Quinn, T., & Stadel, J. 2000, ApJ , 544, 616
- Gill et al. (2004) Gill, S. P. D., Knebe, A., Gibson, B. K., & Dopita, M. A. 2004, MNRAS , 351, 410
- Giodini et al. (2009) Giodini, S., et al. 2009, arXiv:0904.0448
- Gnedin (2003) Gnedin, O. Y. 2003, ApJ , 582, 141
- Halkola et al. (2006) Halkola, A., Seitz, S., & Pannella, M. 2006, MNRAS , 372, 1425
- Hallman et al. (2007) Hallman, E. J., O’Shea, B. W., Burns, J. O., Norman, M. L., Harkness, R., & Wagner, R. 2007, ApJ , 671, 27
- Hansen & Piffaretti (2007) Hansen, S. H., & Piffaretti, R. 2007, A&A , 476, L37
- Hernquist (1990) Hernquist, L. 1990, ApJ , 356, 359
- Host et al. (2009) Host, O., Hansen, S. H., Piffaretti, R., Morandi, A., Ettori, S., Kay, S. T., & Valdarnini, R. 2009, ApJ , 690, 358
- Jing & Suto (2000) Jing, Y. P., & Suto, Y. 2000, ApJ , 529, L69
- Kawahara et al. (2007) Kawahara, H., Suto, Y., Kitayama, T., Sasaki, S., Shimizu, M., Rasia, E., & Dolag, K. 2007, ApJ , 659, 257
- Kay et al. (2007) Kay, S. T., da Silva, A. C., Aghanim, N., Blanchard, A., Liddle, A. R., Puget, J.-L., Sadat, R., & Thomas, P. A. 2007, MNRAS , 377, 317
- Klypin et al. (2001) Klypin, A., Kravtsov, A. V., Bullock, J. S., & Primack, J. R. 2001, ApJ , 554, 903
- Kravtsov et al. (1998) Kravtsov, A. V., Klypin, A. A., Bullock, J. S., & Primack, J. R. 1998, ApJ , 502, 48
- Lemze et al. (2008) Lemze, D., Barkana, R., Broadhurst, T. J., & Rephaeli, Y. 2008, MNRAS , 386, 1092
- Lemze et al. (2009) Lemze, D., Broadhurst, T., Rephaeli, Y., Barkana, R., & Umetsu, K. 2009, ApJ , 701, 1336
- Limousin et al. (2007) Limousin, M., et al. 2007, ApJ , 668, 643
- Limousin et al. (2008) Limousin, M., et al. 2008, A&A , 489, 23
- Lu et al. (2006) Lu, Y., Mo, H. J., Katz, N., & Weinberg, M. D. 2006, MNRAS , 368, 1931
- Mahdavi (2001) Mahdavi, A. 2001, ApJ , 546, 812
- Mahdavi et al. (2007) Mahdavi, A., Hoekstra, H., Babul, A., Balam, D. D., & Capak, P. L. 2007, ApJ , 668, 806
- Mamon & Łokas (2005) Mamon, G. A., & Łokas, E. L. 2005, MNRAS , 363, 705
- Markevitch et al. (2002) Markevitch, M., Gonzalez, A. H., David, L., Vikhlinin, A., Murray, S., Forman, W., Jones, C., & Tucker, W. 2002, ApJ , 567, L27
- Mazzotta et al. (2004) Mazzotta, P., Rasia, E., Moscardini, L., & Tormen, G. 2004, MNRAS , 354, 10
- Medezinski et al. (2007) Medezinski, E., et al. 2007, ApJ , 663, 717
- Molnar et al. (2010) Molnar, S. M., Chiu, I. -., Umetsu, K., Chen, P., Hearn, N., Broadhurst, T., Bryan, G., & Shang, C. 2010, arXiv:1002.4691
- Moore et al. (1999) Moore, B., Quinn, T., Governato, F., Stadel, J., & Lake, G. 1999, MNRAS , 310, 1147
- Morandi et al. (2010) Morandi, A., Pedersen, K., & Limousin, M. 2010, arXiv:1001.1656
- Mulchaey & Zabludoff (1998) Mulchaey, J. S., & Zabludoff, A. I. 1998, ApJ , 496, 73
- Nagai & Kravtsov (2005) Nagai, D., & Kravtsov, A. V. 2005, ApJ , 618, 557 (NK05)
- Navarro et al. (1997) Navarro, J. F., Frenk, C. S., & White, S. D. M. 1997, ApJ , 490, 493 (NFW)
- Navarro et al. (2004) Navarro, J. F., et al. 2004, MNRAS , 349, 1039
- Norman & Bryan (1999) Norman, M. L., & Bryan, G. L. 1999, Numerical Astrophysics, 240, 19
- Oguri et al. (2005) Oguri, M., Takada, M., Umetsu, K., & Broadhurst, T. 2005, ApJ , 632, 841
- Okabe & Umetsu (2008) Okabe, N., & Umetsu, K. 2008, PASJ , 60, 345
- Peng et al. (2009) Peng, E.-H., Andersson, K., Bautz, M. W., & Garmire, G. P. 2009, ApJ , 701, 1283
- Pointecouteau et al. (2005) Pointecouteau, E., Arnaud, M., & Pratt, G. W. 2005, A&A , 435, 1
- Rasia et al. (2004) Rasia, E., Tormen, G., & Moscardini, L. 2004, MNRAS , 351, 237
- Ricotti (2003) Ricotti, M. 2003, MNRAS , 344, 1237
- Riemer-Sørensen et al. (2009) Riemer-Sørensen, S., Paraficz, D., Ferreira, D. D. M., Pedersen, K., Limousin, M., & Dahle, H. 2009, ApJ , 693, 1570
- Sanderson et al. (2005) Sanderson, A. J. R., Finoguenov, A., & Mohr, J. J. 2005, ApJ , 630, 191
- Saro et al. (2006) Saro, A., Borgani, S., Tornatore, L., Dolag, K., Murante, G., Biviano, A., Calura, F., & Charlot, S. 2006, MNRAS , 373, 397
- Schmidt & Allen (2007) Schmidt, R. W., & Allen, S. W. 2007, MNRAS , 379, 209
- Umetsu & Broadhurst (2008) Umetsu, K., & Broadhurst, T. 2008, ApJ , 684, 177
- Umetsu et al. (2009) Umetsu, K., et al. 2009, ApJ , 694, 1643
- Umetsu et al. (2010) Umetsu, K., Medezinski, E., Broadhurst, T., Zitrin, A., Okabe, N., Hsieh, B.-C., & Molnar, S. M. 2010, ApJ , 714, 1470
- Valdarnini (2006) Valdarnini, R. 2006, New Astronomy, 12, 71
- Vikhlinin et al. (2006) Vikhlinin, A., Kravtsov, A., Forman, W., Jones, C., Markevitch, M., Murray, S. S., & Van Speybroeck, L. 2006, ApJ , 640, 691
- Voit et al. (2005) Voit, G. M., Kay, S. T., & Bryan, G. L. 2005, MNRAS , 364, 909
- Wojtak et al. (2005) Wojtak, R., Łokas, E. L., Gottlöber, S., & Mamon, G. A. 2005, MNRAS , 361, L1
- Wojtak et al. (2008) Wojtak, R., Łokas, E. L., Mamon, G. A., Gottlöber, S., Klypin, A., & Hoffman, Y. 2008, MNRAS , 388, 815
- Xue & Wu (2000) Xue, Y.-J., & Wu, X.-P. 2000, ApJ , 538, 65
- Xue & Wu (2002) Xue, S.-J., & Wu, X.-P. 2002, ApJ , 576, 152
- Zitrin et al. (2009) Zitrin, A., et al. 2009, MNRAS , 396, 1985
- Zitrin et al. (2010) Zitrin, A., et al. 2010, arXiv:1004.4660