An Improved Objective Evaluation Measure for Border Detection in Dermoscopy Images
Abstract
Background: Dermoscopy is one of the major imaging modalities used in the diagnosis of melanoma and other pigmented skin lesions. Due to the difficulty and subjectivity of human interpretation, dermoscopy image analysis has become an important research area. One of the most important steps in dermoscopy image analysis is the automated detection of lesion borders. Although numerous methods have been developed for the detection of lesion borders, very few studies were comprehensive in the evaluation of their results. Methods: In this paper, we evaluate five recent border detection methods on a set of 90 dermoscopy images using three sets of dermatologist-drawn borders as the ground-truth. In contrast to previous work, we utilize an objective measure, the Normalized Probabilistic Rand Index, which takes into account the variations in the ground-truth images. Conclusion: The results demonstrate that the differences between four of the evaluated border detection methods are in fact smaller than those predicted by the commonly used XOR measure.
1 Introduction
Invasive and in-situ malignant melanoma together comprise one of the most rapidly increasing cancers in the world. Invasive melanoma alone has an estimated incidence of 62,480 and an estimated total of 8,420 deaths in the United States in 2008 [1]. Early diagnosis is particularly important since melanoma can be cured with a simple excision if detected early.
Dermoscopy, also known as epiluminescence microscopy, is a non-invasive skin imaging technique that uses optical magnification and either liquid immersion and low angle-of-incidence lighting or cross-polarized lighting, making subsurface structures more easily visible when compared to conventional clinical images [2]. Dermoscopy allows the identification of dozens of morphological features such as pigment network, dots/globules, streaks, blue-white areas, and blotches [3]. This reduces screening errors, and provides greater differentiation between difficult lesions such as pigmented Spitz nevi and small, clinically equivocal lesions [4]. However, it has been demonstrated that dermoscopy may actually lower the diagnostic accuracy in the hands of inexperienced dermatologists [5]. Therefore, in order to minimize the diagnostic errors that result from the difficulty and subjectivity of visual interpretation, the development of computerized image analysis techniques is of paramount importance [6].
Automated border detection is often the first step in the automated or semi-automated analysis of dermoscopy images [7]. It is crucial for the image analysis for two main reasons. First, the border structure provides important information for accurate diagnosis as many clinical features such as asymmetry, border irregularity, and abrupt border cutoff are calculated directly from the border. Second, the extraction of other important clinical features such as atypical pigment network [6], globules [8], and blue-white areas [9] critically depends on the accuracy of border detection. Automated border detection is a challenging task due to several reasons: (i) low contrast between the lesion and the surrounding skin, (ii) irregular and fuzzy lesion borders, (iii) artifacts and intrinsic cutaneous features such as black frames, skin lines, blood vessels, hairs, and air bubbles, (iv) variegated coloring inside the lesion, and (v) fragmentation due to various reasons such as scar-like depigmentation.
Numerous methods have been developed for border detection in dermoscopy images [10]. Recent approaches include fuzzy c-means clustering [11, 12, 13], gradient vector flow snakes [14], thresholding followed by region growing [15, 16], meanshift clustering [17], color quantization followed by spatial segmentation [18], statistical region merging [19], two-stage k-means++ clustering followed by region merging [20], and contrast enhancement followed by k-means clustering [21]. Some of these studies used subjective visual examination to evaluate their results. Others used objective measures including Hance et al.’s XOR measure [22], sensitivity & specificity, precision & recall, error probability, and pixel misclassification probability [23]. These measures require borders drawn by dermatologists, which serve as the ground truth. In this paper, we refer to the computer-detected borders as automatic borders and those determined by dermatologists as manual borders.
In a recent study, Guillod et al. [23] demonstrated that a single dermatologist, even one who is experienced in dermoscopy, cannot be used as an absolute reference for evaluating border detection accuracy. In addition, they emphasized that manual borders are not precise, with inter-dermatologist borders and even intra-dermatologist borders showing significant disagreement, so that a probabilistic model of the border is preferred to an absolute gold-standard model.
Only a few of the above-mentioned studies used borders determined by multiple dermatologists. Guillod et al. [23] used fifteen sets of borders determined by five dermatologists over a minimum period of one month. They constructed a probability image for each lesion by associating a misclassification probability with each pixel based on the number of times it was selected as part of the lesion. The automatic borders were then compared against these probability images. Iyatomi et al. [15, 16] modified Guillod et al.’s method by combining the manual borders that correspond to each image into one using the majority vote rule. The automatic borders were then compared against these combined ground-truth images. Celebi et al. [19] compared each automatic border against multiple manual borders independently.
In this paper, we evaluate the performance of five recent automated border detection methods on a set of 90 dermoscopy images using three sets of manual borders as the ground-truth. In contrast to prior studies, we employ an objective criterion that takes into account the variations in the ground-truth images.
The rest of the paper is organized as follows. Section 2 reviews the objective measures used previously in the border detection literature. Section 3 describes a recent measure that takes into account the variations in the ground-truth images. Section 4 presents the experimental setup and discusses the results obtained, while Section 5 concludes the paper.
2 Review of Objective Measures for Border Detection Evaluation
All of the objective measures mentioned in Section 1, except for Guillod et al.’s probabilistic measure, are based on the concepts of true/false positive/negative defined in Table 1. For example, if a lesion pixel is detected as part of the background skin, this pixel is considered to be a False Negative. On the other hand, if a background pixel is detected as part of the lesion, it is considered as a False Positive. Note that in the remainder of this paper, True Positive (TP), False Negative (FN), False Positive (FP), and True Negative (TN) will refer to the number of pixels that satisfy these criteria.
| Detected Pixel | ||
|---|---|---|
| Actual Pixel | Lesion | Background |
| Lesion | True Positive (TP) | False Negative (FN) |
| Background | False Positive (FP) | True Negative (TN) |
2.1 XOR Measure
The XOR measure, first used by Hance et al. [22] quantifies the percentage border detection error as
| (1) |
where AB and MB are the binary images obtained by filling the automatic and manual borders, respectively, is the exclusive-OR (XOR) operation that gives the pixels for which AB and MB disagree, and Area() denotes the number of pixels in the binary image . The drawback of this composite measure is that it tends to favor larger lesions due to the size term in the denominator.
2.2 Sensitivity & Specificity
Sensitivity (true positive rate) and specificity (true negative rate) are commonly used evaluation measures in medical studies. In our application domain, the former corresponds to the percentage of correctly detected lesion pixels, whereas the latter corresponds to the percentage of correctly detected background pixels. Mathematically, these measures are given by
| (2) |
Note that an automatic border that encloses the corresponding manual border will have a perfect () sensitivity. On the other hand, an automatic border border that is completely enclosed by the corresponding manual border will have a perfect specificity. Therefore, it is crucial not to interpret these measures in isolation from each other.
2.3 Precision & Recall
Precision (positive predictive value) and recall are commonly used evaluation measures in information retrieval studies. Precision refers to the percentage of correctly detected lesion pixels over all the pixels detected as part of the lesion and is defined as
| (3) |
Recall is equivalent to sensitivity as defined in (2). Note that as in the case of sensitivity and specificity, precision and recall measures should be interpreted together.
2.4 Error Probability
Error probability refers to the percentage of pixels incorrectly detected as part of the lesion or background over all the pixels. It is calculated as
| (4) |
The drawback of this composite measure is that it disregards the distributions of the classes. For example, consider a small lesion of size pixels in a large image of size pixels. An automatic border of size pixels that encloses the manual border for this lesion will have an error probability of about despite the fact that the automatic border is twice as large as the manual border.
2.5 Pixel Misclassification Probability
In [23] the probability of misclassification for a pixel is defined as
| (5) |
where is the number of observations (manual + automatic borders), and is the number of times pixel was selected as part of the lesion. For each automatic border, the detection error is given by the mean probability of misclassification over the pixels inside the border
| (6) |
2.6 Error Measures Used in Previous Studies
Table 2 compares recent border detection methods based on their evaluation methodology: the number of human experts who determined the manual borders, the number of images used in the evaluations (and the diagnostic distribution of these images if available), and the measure used to quantify the border detection error. It can be seen that:
-
•
Recent studies used objective measures to validate their results, whereas earlier studies relied on visual assessment.
-
•
Only 5 out of 19 studies involve more than one expert in the evaluation of their results.
-
•
XOR measure is the most commonly used objective error function despite the fact that it is not trivial to extend this measure to capture the variations in multiple manual borders.
| Ref. | Year | # Experts | # Images (Distribution) | Error Measure (Value) |
|---|---|---|---|---|
| [13] | 2009 | 1 | 100 (70 b / 30 m) | Sens. (78%) & Spec. (99%) |
| [19] | 2008 | 3 | 90 (65 b / 25 m) | XOR (10.63%) |
| [20] | 2008 | 1 | 67 | XOR (14.63%) |
| [21] | 2008 | 1 | 100 (70 b / 30 m) | XOR (2.73%) |
| [24] | 2007 | 1 | 50 | Error probability (16%) |
| [24] | 2007 | 1 | 50 | Error probability (21%) |
| [18] | 2007 | 2 | 100 (70 b / 30 m) | XOR (12.02%) |
| [15] | 2006 | 5 | 319 (244 b / 75 m) | Prec. (94.1%) & Rec. (95.2%) |
| [17] | 2006 | nr | 117 | Sens. (95%) & Spec. (96%) |
| [14] | 2005 | 2 | 100 (70 b / 30 m) | XOR (15.59%) |
| [25] | 2003 | 0 | nr | nr |
| [12] | 2002 | 0 | 600 | Visual |
| [26] | 2001 | 0 | nr | nr |
| [27] | 2000 | 5 | 30 | Visual |
| [28] | 2000 | 1 | 30 | Visual |
| [11] | 1999 | 1 | 400 | Visual |
| [29] | 1999 | 1 | 300 | Visual |
| [30] | 1998 | 1 | 57 | XOR (36.50%) |
| [30] | 1998 | 1 | 57 | XOR (24.71%) |
3 Proposed Measure for Border Detection Evaluation
The objective measures reviewed in the previous section share a common deficiency. They do not take into account the variations in the manual borders. Given an automatic border, the XOR measure, sensitivity & specificity, precision & recall, and error probability can only be defined with respect to a single manual border. Therefore, it is not possible to use these measures with multiple manual borders. Although the methods described in [23], [15, 16], and [19] allow the use of multiple manual borders; these methods do not accurately capture the variations in the manual borders. For example, using Guillod et al.’s measure an automated border that is entirely enclosed by the manual borders would get a very low error. Iyatomi et al.’s method discounts the variation in the manual borders by simple majority voting, while Celebi et al.’s approach does not produce a scalar error value, which makes comparisons more difficult.
In this paper we propose to use a recent, more elaborate probabilistic measure, namely the Normalized Probabilistic Rand Index (NPRI) [31] to evaluate border detection accuracy. We first describe the Probabilistic Rand Index (PRI) [32]. Consider a set of manual segmentations of an image consisting of pixels. Let be the segmentation that is to be compared with the manually labeled set. We denote the label of point by in segmentation and by in the manually segmented image .
The motivation behind the PRI is that a segmentation is judged as ‘good’ if it correctly identifies the pairwise relationships between the pixels as defined in the ground truth segmentations. In addition, a proper segmentation quality measure should penalize inconsistencies between the test and ground-truth label pair relationships proportionally to the level of consistency between the ground-truth label pair relationships. Based on this, the PRI is defined as
| (7) |
where is a boolean function defined as
denotes the event of a pair of pixels and having the same label in the test image
| (8) |
Note that the denominator in (7) denotes the number of possible distinct pixel pairs. Given the manually labeled images, we can compute the empirical probability of the label relationship of a pixel pair and by
| (9) |
The PRI is always within the interval , and an index of 0 or 1 can only be achieved when all of the ground-truth segmentations agree or disagree on every pixel pair relationship. A score of 0 indicates that every pixel pair in the test image has the opposite relationship as every pair in the ground-truth segmentations, while a score of 1 indicates that every pixel pair in the test image has the same relationship as every pair in the ground-truth segmentations.
The PRI has one disadvantage. Although the index values are in , there is no expected value for a given segmentation. That is, it is impossible to know if any given score is good or bad. In addition, the score of a segmentation of one image cannot be compared with the score of a segmentation of another image. The Normalized Probabilistic Rand Index (NPRI) addresses this drawback by normalizing the PRI as follows
| (10) |
The maximum index is taken as 1 while the expected value of the index is calculated as
| (11) |
Let be the number of images in the entire data set, and be the number of ground-truth segmentations of image . Then can be expressed as
| (12) |
Since in the computation of the expected values no assumptions are made with regards to the number or size of regions in the segmentation, and all of the ground-truth data is used, the NPR indices are comparable across images and segmentations.
4 Experimental Results and Discussion
The proposed evaluation method was tested on a set of 90 dermoscopy images (23 invasive malignant melanoma and 67 benign) obtained from the EDRA Interactive Atlas of Dermoscopy [2], and three private dermatology practices [19]. The benign lesions included nevocellular nevi and dysplastic nevi.
Manual borders were obtained by selecting a number of points on the lesion border, connecting these points by a second-order B-spline and finally filling the resulting closed curve. Three sets of manual borders were determined by dermatologists Dr. William Stoecker (WS), Dr. Joseph Malters (JM), and Dr. James Grichnik (JG) using this method.
Five recent automated border detection methods were included in the experiments. These were orientation-sensitive fuzzy c-means method (OSFCM) [11], dermatologist-like tumor extraction algorithm (DTEA) [15, 16], meanshift clustering method (MS) [17], modified JSEG method (JSEG) [18], and the statistical region merging method (SRM) [19]. Table 3 gives the mean and standard deviation errors as evaluated by the commonly used XOR measure (1). The best results, i.e. the lowest mean errors, in each row are shown in bold.
| Dermatologist | Diagnosis | OSFCM | DTEA | MS | JSEG | SRM |
|---|---|---|---|---|---|---|
| WS | Benign | 22.995 | 10.513 | 11.527 | 10.832 | 11.384 |
| (12.614) | (4.728) | (9.737) | (6.359) | (6.232) | ||
| Melanoma | 28.311 | 11.853 | 13.292 | 13.745 | 10.294 | |
| (15.245) | (5.998) | (7.418) | (7.590) | (5.838) | ||
| All | 24.354 | 10.855 | 11.978 | 11.577 | 11.106 | |
| (13.449) | (5.081) | (9.193) | (6.772) | (6.120) | ||
| JM | Benign | 25.535 | 10.367 | 10.802 | 10.816 | 10.186 |
| (11.734) | (3.771) | (6.332) | (5.227) | (5.683) | ||
| Melanoma | 26.743 | 10.874 | 12.592 | 12.981 | 10.500 | |
| (14.508) | (5.016) | (7.202) | (6.316) | (8.137) | ||
| All | 25.843 | 10.496 | 11.259 | 11.370 | 10.266 | |
| (12.426) | (4.101) | (6.571) | (5.570) | (6.351) | ||
| JG | Benign | 27.506 | 12.091 | 12.224 | 12.257 | 10.561 |
| (12.789) | (5.220) | (7.393) | (6.588) | (5.152) | ||
| Melanoma | 27.574 | 12.675 | 12.168 | 13.414 | 10.411 | |
| (15.836) | (6.865) | (7.479) | (7.379) | (5.860) | ||
| All | 27.523 | 12.240 | 12.210 | 12.553 | 10.523 | |
| (13.538) | (5.650) | (7.373) | (6.775) | (5.308) |
It can be seen that the results vary significantly across the border sets, highlighting the subjectivity of human experts in the border determination procedure. Overall, the SRM method achieves the lowest mean errors followed by the DTEA and JSEG methods. It should be noted that, with the exception of SRM, the error rates increase in the melanoma group which is possibly due to the presence of higher border irregularity and color variation in these lesions. With respect to consistency, the best methods are DTEA followed by the SRM and JSEG methods.
Table 4 shows the border detection quality statistics as evaluated by the proposed NPRI measure. Note that, in this table, higher mean values indicate lower border detection errors, whereas higher standard deviation values indicate lower consistency, respectively.
| Diagnosis | OSFCM | DTEA | MS | JSEG | SRM |
|---|---|---|---|---|---|
| Benign | 0.520 | 0.785 | 0.774 | 0.775 | 0.785 |
| (0.247) | (0.079) | (0.137) | (0.114) | (0.109) | |
| Melanoma | 0.520 | 0.783 | 0.762 | 0.748 | 0.811 |
| (0.258) | (0.108) | (0.161) | (0.141) | (0.092) | |
| All | 0.520 | 0.784 | 0.771 | 0.768 | 0.791 |
| (0.248) | (0.087) | (0.142) | (0.122) | (0.105) |
It can be seen that the ranking remains the same: SRM and DTEA are still the most accurate and consistent methods. However, using the NPRI measure, the differences between the methods have become smaller. In addition, this measure considers the variations in the manual borders simultaneously and produces a scalar value, which makes comparisons among methods much easier.
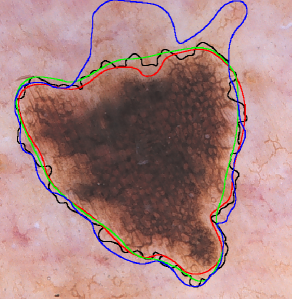
Figure 1 illustrates one advantage of using the NPRI measure. Here the manual borders are shown in red, green, and blue, whereas the border determined by the DTEA method is shown in black. The border detection errors with respect to the red, green, and blue borders calculated using the XOR measure are 10.872%, 9.342%, and 20.958%, respectively. It can be concluded that, with respect to the first two dermatologists, the DTEA method has an average accuracy (see Table 3). On the other hand, with respect to the third dermatologist, the automatic method is quite inaccurate. The NPRI value in this case is 0.814, which is above the average over the entire data set (see Table 4). This was expected, since this measure does not penalize the automatic border in those regions where dermatologist agreement is low.
5 Conclusions and Future
In this paper, we evaluated five recent automated border detection methods on a set of 90 dermoscopy images using three sets of manual borders as ground-truth. We proposed the use of an objective measure, the Normalized Probabilistic Rand Index, which takes into account variations in the ground-truth. The results demonstrated that the differences between four of the evaluated border detection methods were in fact smaller than those predicted by the commonly used XOR measure. Future work will be directed towards the expansion of the image set and the inclusion of more dermatologists in the evaluations.
Acknowledgments
This publication was made possible by grants from The Louisiana Board of Regents (LEQSF2008-11-RD-A-12) and The National Institutes of Health (SBIR #2R44 CA-101639-02A2). The assistance of Joseph M. Malters, M.D., and James M. Grichnik, M.D. in obtaining the manual borders is gratefully acknowledged.
References
- [1] Jemal A, Siegel R, Ward E et al. Cancer Statistics, 2008. CA: A Cancer Journal for Clinicians 2008; 58(2): 71-96, 2008.
- [2] Argenziano G, Soyer HP, De Giorgi V et al. Dermoscopy: A Tutorial. Milan, Italy: EDRA Medical Publishing & New Media, 2002.
- [3] Menzies SW, Crotty KA, Ingwar C, McCarthy WH. An Atlas of Surface Microscopy of Pigmented Skin Lesions: Dermoscopy. Sydney, Australia: McGraw-Hill, 2003.
- [4] Steiner K, Binder M, Schemper M et al. Statistical Evaluation of Epiluminescence Dermoscopy Criteria for Melanocytic Pigmented Lesions. Journal of American Academy of Dermatology 1993; 29(4): 581-588.
- [5] Binder M, Schwarz M, Winkler A et al. Epiluminescence Microscopy. A Useful Tool for the Diagnosis of Pigmented Skin Lesions for Formally Trained Dermatologists. Archives of Dermatology 1995; 131(3): 286-291.
- [6] Fleming MG, Steger C, Zhang J et al. Techniques for a Structural Analysis of Dermatoscopic Imagery. Computerized Medical Imaging and Graphics 1998; 22(5): 375-389.
- [7] Celebi ME, Kingravi HA, Uddin B et al. A Methodological Approach to the Classification of Dermoscopy Images. Computerized Medical Imaging and Graphics 2007; 31(6): 362-373.
- [8] Stoecker WV, Gupta K, Stanley RJ et al. Detection of Asymmetric Blotches in Dermoscopy Images of Malignant Melanoma Using Relative Color. Skin Research Technology 2005; 11(3): 179-184.
- [9] Celebi ME, Iyatomi H, Stoecker WV et al. Automatic Detection of Blue-White Veil and Related Structures in Dermoscopy Images. Computerized Medical Imaging and Graphics 2008; 32(8): 670-677.
- [10] Celebi ME, Iyatomi H, Schaefer G, Stoecker WV. Lesion Border Detection in Dermoscopy Images. Computerized Medical Imaging and Graphics 2009; 33(2): 148-153.
- [11] Schmid P. Segmentation of Digitized Dermatoscopic Images by Two-Dimensional Color Clustering. IEEE Trans. on Medical Imaging 1999; 18(2): 164-171.
- [12] Cucchiara R, Grana C, Seidenari S, Pellacani G. Exploiting Color and Topological Features for Region Segmentation with Recursive Fuzzy c-means. Machine Graphics and Vision 2002; 11(2/3): 169-182.
- [13] Zhou H, Schaefer G, Sadka A, Celebi ME. Anisotropic Mean Shift Based Fuzzy C-Means Segmentation of Dermoscopy Images. IEEE Journal of Selected Topics in Signal Processing 2009; 3(1): 26-34.
- [14] Erkol B, Moss RH, Stanley RJ et al. Automatic Lesion Boundary Detection in Dermoscopy Images Using Gradient Vector Flow Snakes. Skin Research and Technology 2005; 11(1): 17-26.
- [15] Iyatomi H, Oka H, Saito M et al. Quantitative Assessment of Tumor Extraction from Dermoscopy Images and Evaluation of Computer-based Extraction Methods for Automatic Melanoma Diagnostic System. Melanoma Research 2006; 16(2): 183-190.
- [16] Iyatomi H, Oka H, Celebi ME et al. An Improved Internet-based Melanoma Screening System with Dermatologist-like Tumor Area Extraction Algorithm. Computerized Medical Imaging and Graphics 2008; 32(7): 566-579.
- [17] Melli R, Grana C, Cucchiara R. Comparison of Color Clustering Algorithms for Segmentation of Dermatological Images. Proc. of the SPIE Medical Imaging 2006 Conf., 6144: 1211-1219.
- [18] Celebi ME, Aslandogan YA, Stoecker WV et al. Unsupervised Border Detection in Dermoscopy Images. Skin Research and Technology 2007; 13(4): 454-462.
- [19] Celebi ME, Kingravi HA, Iyatomi H et al. Border Detection in Dermoscopy Images Using Statistical Region Merging. Skin Research and Technology 2008; 14(3): 347-353.
- [20] Zhou H, Chen M, Zou L et al. Spatially Constrained Segmentation of Dermoscopy Images. Proc. of the 2008 IEEE Int. Symposium on Biomedical Imaging, pp. 800-803.
- [21] Delgado D, Butakoff C, Ersboll BK, Stoecker WV. Independent Histogram Pursuit for Segmentation of Skin Lesions. IEEE Trans. on Biomedical Engineering 2008; 55(1): 157-161.
- [22] Hance GA, Umbaugh SE, Moss RH, Stoecker WV. Unsupervised Color Image Segmentation with Application to Skin Tumor Borders. IEEE Engineering in Medicine and Biology 1996; 15(1): 104-111.
- [23] Guillod J, Schmid-Saugeon P, Guggisberg D et al. Validation of Segmentation Techniques for Digital Dermoscopy. Skin Research and Technology 2002; 8(4): 240-249.
- [24] Mendonca T, Marcal ARS, Vieira A et al. Comparison of Segmentation Methods for Automatic Diagnosis of Dermoscopy Images. Proc. of the 2007 IEEE EMBS Annual Int. Conf., 1: 6572-6575.
- [25] Galda H, Murao H, Tamaki H, Kitamura S. Skin Image Segmentation Using a Self-Organizing Map and Genetic Algorithms. IEEJ Trans. on Electronics, Information and Systems 2003; 123(11): 2056-2062.
- [26] Hintz-Madsen M, Hansen LK, Larsen J, Drzewiecki K. A Probabilistic Neural Network Framework for the Detection of Malignant Melanoma. Artificial Neural Networks in Cancer Diagnosis, Prognosis and Patient Management, R.G. Naguib and G. Sherbet (Eds.), pp. 141-183, 2001.
- [27] Haeghen YV, Naeyaert JM, Lemahieu I. Development of a Dermatological Workstation: Preliminary Results on Lesion Segmentation in CIE Color Space. Proc. of the 2000 Int. Conf. on Color in Graphics and Image Processing
- [28] Donadey T, Serruys C, Giron A et al. Boundary Detection of Black Skin Tumors Using an Adaptive Radial-based Approach. Proc. of the SPIE Medical Imaging 2000 Conf., 3379: 810-816.
- [29] Schmid P. Lesion Detection in Dermatoscopic Images Using Anisotropic Diffusion and Morphological Flooding. Proc. of the Proc. of the 1999 IEEE Int. Conf. on Image Processing Conf., 3: 449-453.
- [30] Gao J, Zhang J, Fleming MG et al. Segmentation of Dermatoscopic Images by Stabilized Inverse Diffusion Equations. Proc. of the 1998 IEEE Int. Conf. on Image Processing Conf., 3: 823-827.
- [31] Unnikrishnan R, Pantofaru C, Hebert M. Toward Objective Evaluation of Image Segmentation Algorithms. IEEE Trans. on Pattern Analysis and Machine Intelligence 2007; 29(6): 929-944.
- [32] Unnikrishnan R, Hebert M. Measures of Similarity. Proc. of the 2005 IEEE Workshop on Applications of Computer Vision, pp. 394-400.