Permanent address: ]FaMAF-CLCM at University of Cordoba, Medina Allende S/N, 5000 Cordoba, Argentina.
Present address: ]Institut Catala de Nanotecnologia (ICN), Universitat Autonoma de Barcelona, E-08193 Bellaterra, Spain
Uncompensated magnetization and exchange-bias field in La0.7Sr0.3MnO3/YMnO3 bilayers: The influence of the ferromagnetic layer
Abstract
We studied the magnetic behavior of bilayers of multiferroic and nominally antiferromagnetic o-YMnO3 (375 nm thick) and ferromagnetic La0.7Sr0.3MnO3 and La0.67Ca0.33MnO3 (nm), in particular the vertical magnetization shift and exchange bias field for different thickness and magnetic dilution of the ferromagnetic layer at different temperatures and cooling fields. We have found very large shifts equivalent to up to 100% of the saturation value of the o-YMO layer alone. The overall behavior indicates that the properties of the ferromagnetic layer contribute substantially to the shift and that this does not correlate straightforwardly with the measured exchange bias field .
pacs:
75.60.-d,75.70.CnI Introduction
In bilayers composed of antiferromagnetic (AFM) and a ferromagnetic (FM) phases a “horizontal” shift in the field axis of the hysteresis loops is generally observed after cooling them in a field applied at temperatures between the Néel and Curie temperatures Meiklejohn and Bean (1957); Nogués and Schuller (1999). This “exchange-bias field” has been studied in different systems due to its fundamental importance as well as its technological relevance in spin-valve sensors, actuators and in high-density recording media Skumryev et al. (2003) and some details of the origin of are still a matter of discussion.Nogués and Schuller (1999)
Less studied is the shift in the magnetization axis, i.e. the “vertical” shift in the hysteresis loop, probably because of its rather small relative values Miltényi et al. (2000); Hong et al. (2006) and its dependence on the cooling field .Nogués et al. (2000); Keller et al. (2002) Recently, a maximum shift of 16% of the saturation magnetization was found in FexNi1-xF2/Co bilayers, which appeared to have an exchange bias field of its own.Cheon et al. (2007) It was proposed that is related to uncompensated moments (UCM) at the AFM/FM interface and should have a direct correlation to .Cheon et al. (2007); Nowak et al. (2002a) Element specific x-ray magnetic studies of FeF2/Co Ohldag et al. (2003, 2006) and CoO/Fe Gruyters and Schmitz (2008) layered structures confirmed the existence of this shift and revealed its relation to specific UCM in the AFM material.
Due to the limited number of studies on the effect it is of general interest to find systems with larger magnetization shifts, not only because of its fundamental interest but also because this shift provides a new degree of freedom in the hysteresis loop that may be well have some applicability in future devices. In this work we studied the exchange-bias shifts and of the hysteresis loops as a function of temperature and for three AFM/FM bilayers having the same AFM layer but different thickness and dilution of the FM layer. We observed an unusually large uncompensated magnetization shift that is not simply correlated with and does not originate only from the AFM layer but from the FM one.
II Sample preparation details and x-ray characterization
We prepared bilayers composed of a FM La0.7Sr0.3MnO3 (LSMO) layer (selected for its weak anisotropy and small coercivity) covering an AFM orthorhombic o-YMnO3 (YMO) layer grown on (100) SrTiO3 substrates of area mm2 for samples A and B and mm2 for sample C. For the depositions a KrF excimer laser (wavelength 248 nm, pulse duration 25 ns) was used and the optimal parameters found for o-YMO were 1.7 J/cm2 with 5 Hz repetition rate, 800∘C and 0.10 mbar for the substrate temperature and oxygen pressure during preparation. We have measured three bilayers, all of them with the same 375 nm thick o-YMO layer on STO substrates prepared always under the above mentioned conditions. To check the reproducibility of the found effects we have prepared a fourth bilayer with identical thickness as in sample A but instead of the LSMO FM layer we used La0.67Ca0.33MnO3 (LCMO) deposited YMO and this last one on a (100)LSAT substrate.
For the FM LSMO layer, deposited immediately after the o-YMO one, the parameters were 10 Hz repetition rate and 0.35 (0.38) mbar oxygen pressure, 8 (30) nm thickness and at the same laser fluency and substrate temperature, for sample A (B). In order to corroborate the contribution of the FM layer in the -shift we have decreased further the oxygen concentration to deposit the LSMO film in sample C (oxygen pressure 0.10 mbar) with a larger thickness of 225 nm decreasing in this way its coercivity. For the fourth LCMO/YMO bilayer the YMO layer was grown under similar conditions as before but the LCMO layer under an oxygen pressure of 0.55 mbar; all other conditions as for the LSMO layers.
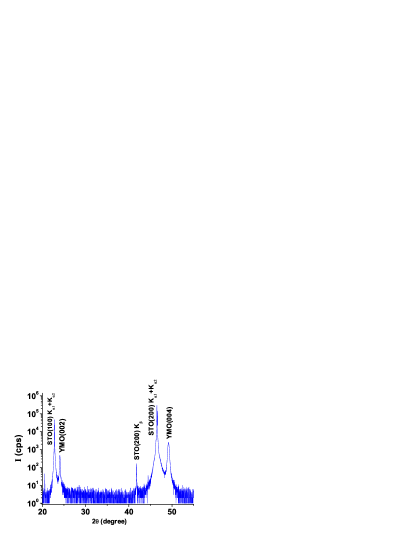
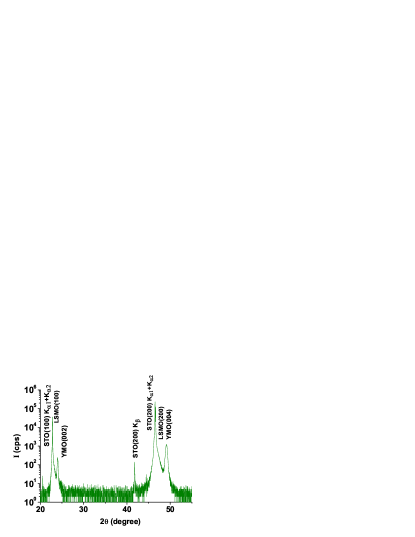
The epitaxial growth in the direction for the o-YMO and for LSMO phases was confirmed by x-ray diffraction using Cu-Kα line. As an example we show in Fig. 1 the the x-ray spectrum of the single o-YMO layer on STO. The preferential growth of the planes of the orthorhombic phase YMO is clearly seen. Within the experimental resolution no maxima due to the hexagonal phase are observed. Figure 2 shows the x-ray spectrum obtained for sample B. The main diffraction peaks from the LSMO layer are observed as a weak shoulder near the STO main maxima. Magnetization measurements were performed with a superconducting quantum interference device (SQUID) from Quantum Design in the temperature range between 5 K and 350 K.
In addition, we performed soft x-ray absorption and circular dichroism measurements using the bending magnet beamline 6.3.1 at the Advanced Light Source in Berkeley, CA (USA) and the elliptical undulator beamline 13.1 at the Stanford Synchrotron Radiation Lightsource, Stanford, CA (USA). For these measurements the sample was mounted between the poles of an electromagnet so that the x-rays are incident on the sample under a grazing angle of 30∘ parallel to the direction of the applied magnetic field. The x-ray absorption intensity was monitored using the electron yield method. Hysteresis loops were acquired by sweeping the external field while monitoring the electron yield at the Mn L3 and L2 absorption resonance ( 640 eV). This approach is surface sensitive and in general it yields information only on the first nm of the sample. Assuming an exponential escape depth of 2.5 nm, then 95% of the signal comes from the top 6 nm of the sample. This is essentially our probing depth. For a more detailed description of the technique see Refs. Ohldag et al., 2003, 2006.
III Results
III.1 Single YMnO3 layers
According to literatureHsieh et al. (2008); Kim et al. (2006) the o-YMO phase is AFM with Néel temperature K and with a ferroelectric transition at K. In spite of its low this material has several advantages for exchange bias studies. It belongs to the family of the perovskite manganite RMnO3 and the magnetic and electrical properties can be changed by cation substitution keeping similar lattice constants and therefore without drastic changes in its structural properties. On the other hand, o-YMO is a phase that was not thoroughly studied yet and the influence of its ferroelectric behavior, in spite of the low temperature, might be used as a paradigm for potential applications in magnetoelectric devices.Laukhin et al. (2006)
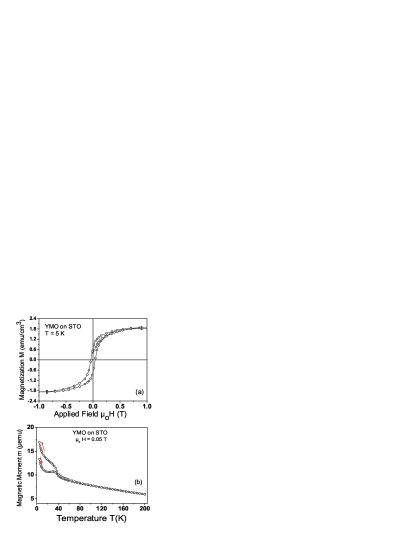
Figure 3(a) shows the magnetization loop of single o-YMO layer. The hysteresis loop indicates a magnetization at saturation of 1.8 emu/cm3 at 5 K and at applied fields T in agreement with reported values.Li et al. (2009) Figure 3(b) shows the magnetic moment of a single o-YMO layer ( mm3) on STO measured as a function of temperature in ZFC and FC states at an applied field of 0.05 T. A clear increase in decreasing temperature is observed at K. An hysteresis between ZFC and FC is observed already below K. As was shown in earlier studies on YMO we may expect to have persistent spin waves at temperatures above .Demmel and Chatterji (2007)
From the hysteresis loop shown in Fig. 3(a) one may speculate that the YMO film behaves as a ferro- or ferrimagnet and not as an antiferromagnet. In fact, a recent study suggests a change of the usual bulk antiferromagnetic state to a strain-dependent non-collinear magnetic one in thinner (nm) o-YMO films.Marti et al. (2009) Taking into account that our YMO layers are much thicker and show a different behavior (at ZFC and low applied fields the measured of our YMO films alone resembles practically the usual dependence found for antiferromagnets) as those reported in Ref. Marti et al., 2009 we remark that the magnetic behavior of the o-YMO layers may correspond to the one observed in diluted antiferromagnets in external magnetic field (DAFF). It is well known that DAFF develop a domain state when cooled below (sometimes with a spin-glass-like behavior) and this leads to a net magnetization, which couples to the external field, see e.g. Refs. Miltényi et al., 2000; Keller et al., 2002; Nowak et al., 2002b; Radu et al., 2003; Radu and Zabel, 2008.
From the measured temperature dependence of the magnetic moment and the observed scaling of the exchange bias field with the inverse of the thickness of the LSMO layer for samples A and B, see section III.2, and the quantitative agreement of the obtained and shifts for the fourth sample (similar to sample A but with LCMO instead of LSMO) we may conclude that YMO behaves as an AFM or DAFF layer for the exchange bias effects. Whatever the real magnetic equilibrium state of our o-YMO films is, we may expect to see exchange bias effects when these films are coupled to a ferromagnet. Further examples for exchange bias effects in heterostructures with different ferro- or ferrimagnets can be seen in Refs. Fitzsimmons et al., 2009; Ke et al., 2004 and effects, positive as well as negative, has been also observed in ferrimagnetic based bilayers.Canet et al. (2001)
III.2 La0.7Sr0.3MnO3/YMnO3 bilayers
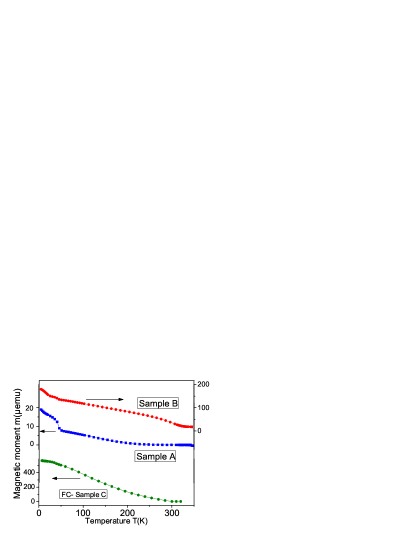
Figure 4 shows the remanent moment for samples A and B measured increasing temperature at zero field, after cooling them to 5 K in a field of 0.1 T applied in-plane, i.e. or direction. Changes in slope of the remanence moment are observed near the Néel temperature onset K of the o-YMO layer. This increase of K in might be related to the an exchange-biasvan Lierop et al. (2007); van der Zaag et al. (2000) or strainShi et al. (2004) effect. An anomaly is also observed at K, as shown in Fig. 3(b), and already reported in the literature.Hsieh et al. (2008); Fina et al. (2010) The temperature dependence of the remanence measured in sample B shows a clear change of slope near the Curie temperature of the LSMO layer. In contrast, due to the smaller LSMO thickness the remanent moment of sample A does not show a clear anomaly at ; similarly for sample C (not shown). For sample C we show in Fig. 4 the field cooled (FC) curve at 0.1 T; the absence of a marked anomaly at and the smooth decrease of the magnetic moment with demonstrates the expected strong magnetic dilution of the LSMO film. The existence of the FM state in this layer was confirmed through hysteresis loop measurements up to its ferromagnetic onset at K. The FC results presented below were obtained always after cooling the samples from at zero field and after applying an in-plane field at 100 K .
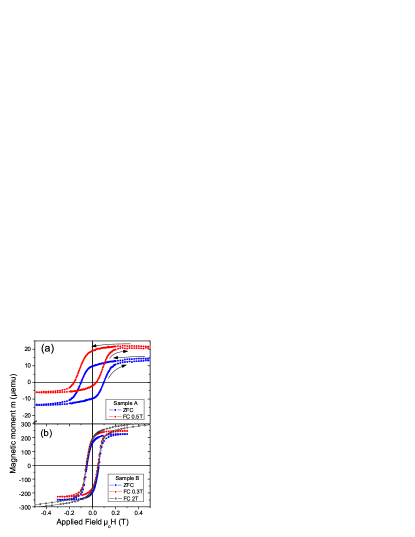
Figures 5(a) and (b) show the hysteresis loops for ZFC and FC measurements at 5 K for samples A and B. A remarkable shift of the same order of the saturation magnetic moment is observed for sample A after FC from 100 K at T. For sample B the shift is also clearer measured but it is smaller relative to . The sign of the -shift changes when the direction of changes, i.e. it has the same sign as that of . This indicates that the effective UCM layer is pinned in the direction of the cooling field, which means a ferromagnetic coupling.
In the determination of the and shifts we took special care to rule out effects due to minor hysteresis loopsPi et al. (2006). Studying the behavior of the loops at different we conclude that no minor loops and a clear saturation behavior of the magnetic moment are obtained for T at K for samples A and B, see Fig. 5. For sample C, which has a more diluted and inhomogeneous FM layer, the hysteresis loops reveal no complete saturation at T. However minor loop effects can be neglected also for this sample at T, as the behavior of the coercive field vs. indicates (see Fig. 7 below).
We note that the value of obtained from the hysteresis loops depends on the applied . As example we show this effect for sample B where the hysteresis loop was measured after cooling the sample at T, see Fig. 5(b). This effect is due to the LSMO layer and indicates that the number of aligned domains can be changed with . In this case we expect that the effect will be strongly influenced by the FM layer since, as in the case of a diluted AFM layerNowak et al. (2002a); Keller et al. (2002), the formation and number of its domains that take part in the exchange bias coupling with the AFM layer can be enhanced leading to an increase of . Note however that the effect is expected to decrease with , i.e. for .
Note the opening of emu of the hysteresis at the end of the loop at 0.5 T for sample A, see Fig. 5(a). A similar opening is measured for all samples in agreement with the numerical results obtained with the domain state model for exchange bias proposed by Nowak et al.Nowak et al. (2002a, b). The fact that the loops do not close indicates that uncompensated spins - pinned earlier during the field cooling - rotate and remain pinned in the opposite direction during the field sweep loop, reducing the final saturation moment. We note that in all three bilayers this opening remains of the order of emu, i.e. several times smaller than the shift, as we show below.
To characterize quantitatively the exchange bias effect and for a direct comparison with the saturation magnetic moments of each of the layers we define it as , where and are the saturation moments at positive and negative fields. The shift in the field axis is defined as , where and are the coercive fields in upward and descending loop branches, respectively. We note that the values were obtained only after centering the hysteresis loop, subtracting the upward shift.
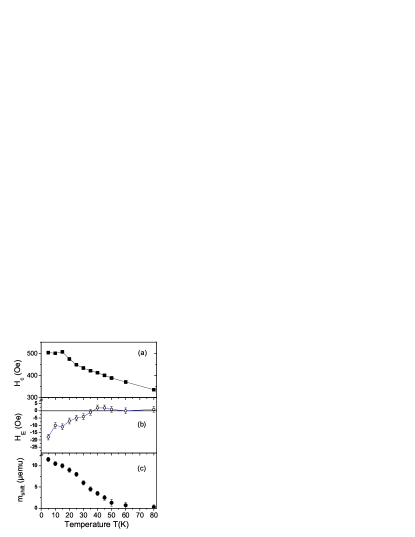
Figure 6 shows the coercivity (a), the exchange-bias (b) and the vertical shift in magnetic moment (c) as a function of K for sample B, measured after T, as an example. A similar behavior is observed for samples A and C. Both, and show an anomaly at K, in agreement with the behavior found in the remanence curve, see Fig. 4, suggesting that the transition at that temperature influences the exchange interaction. At K crosses zero and changes to positive. This sign change of from negative to positive increasing temperature was observed also in CoO/Co bilayersRadu et al. (2003) and suggests a change from direct () to indirect () interface interaction. As expected, as well as vanish at . In contrast to no anomalous behavior is observed in at , with exception of the slope change at K, see Fig. 6(c).
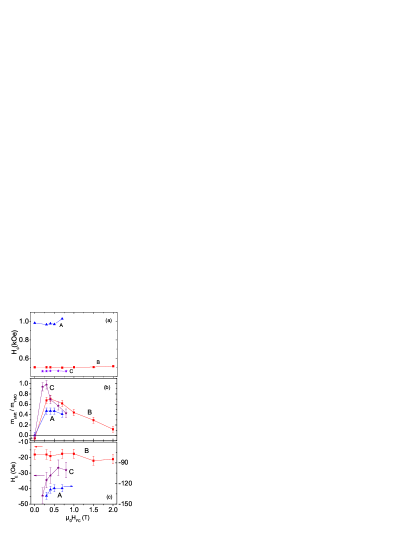
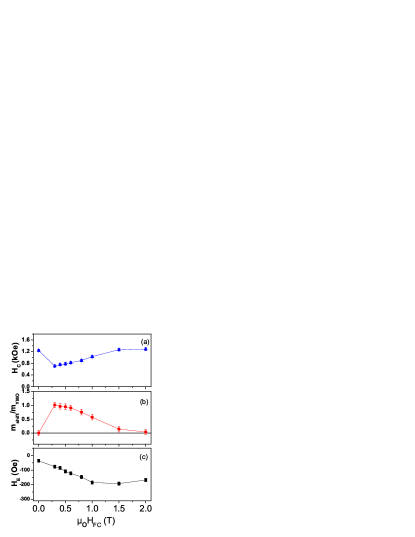
Figure 7 shows the -dependence of , and for the three samples measured at 5 K. The decrease of from samples A to B agrees with the expected inverse proportionality of with the thickness of the FM layer. According to this thickness dependence sample C should show nearly one order of magnitude smaller than for sample B, in clear disagreement with the obtained result, see Fig. 7(c), suggesting that the magnetic dilution of this sample is responsible for the large observed field.
Regarding the effect and in agreement with the results in Co/CoO bilayersKeller et al. (2002) we observe a vanishing effect at zero and at large enough values of , see Fig. 7(b). Under the assumptions done in Refs. Nowak et al., 2002b, a the shift is mainly due to the AFM layer. According to this model, the largest expected from our o-YMO layer, assuming complete saturation in the whole 375 nm thick layer, would be emu and emu from samples A or B and C, respectively. To estimate those numbers we have taken into account the measured magnetization at saturation of the single layers. The normalized by the corresponding , see Fig. 7(b), would indicate that it is necessary that 50% to 70% of the YMO layer should be responsible for the measured at T. This percentage increases further for the diluter sample C at TT. Taking into account the 375 nm thickness of the YMO layer this assumption appears unlikely.
We remark that unexpected phenomena can occur at oxide interfaces. A recent study, for example, found an excess magnetization produced at the interface between STO and an AFM La1/3Ca2/3MnO3 layer,Hoffmann et al. (2009) which origin remains unclear. In our case the large values – actually a giant effect – indicate that a large contribution should come from the FM layer. Taking into account the saturation moments of the LSMO layers alone, we estimate for example that a thickness of the LSMO layer of less than 1.3 nm for sample B and nm for sample C should be enough to produce the observed at T.
III.3 La0.67Ca0.33MnO3/YMnO3 bilayer
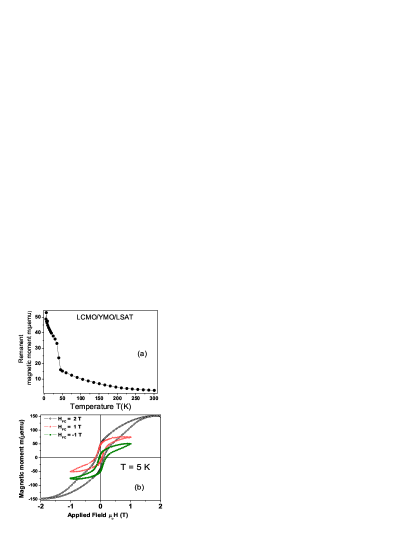
Further evidence for the reproducibility and robustness of the effects observed in the three LSMO/YMO bilayers reported in the last section are provided by the results of a LCMO/YMO bilayer with similar geometry and preparation conditions as sample A. Figure 8(a) shows the remanent magnetic moment of this bilayer after cooling the sample at 1 T applied field. The transition at the Néel temperature of the YMO layer is clearly seen as well as the change of slope at K. In Fig. 8(b) the hysteresis loops for three field cooled states at fields T and 2 T are shown. At low fields the exchange bias - and -effects are clearly observed whereas at high enough fields the effect vanishes, see Fig. 8(b). Figure 9 shows the -dependence for the three characteristics parameters. The observed at T, see Fig. 9(b), is as large as the magnetic moment at saturation of the 375 nm thick YMO layer alone, indicating clearly that the FM layer should contribute to this effect near the interface.
Although in the LSMO/YMO bilayers we did not find any correspondence between the coercive field and , see Fig. 7, one may expect some correlation between them in case of a bilayer with a very thin (and diluted) FM layer. This may be so if we take into account the amount of the FM layer that remains pinned at the interface. In this case the smaller the effective thickness of the remained unpinned ferromagnetic layer the smaller might be . Apparently this is observed in the (thin)LCMO/(thick)YMO bilayer. Indeed, the results shown in Fig.9 indicate that when decreases at T, i.e. when the amount of UCM decreases, increases.
IV Discussion and Conclusion
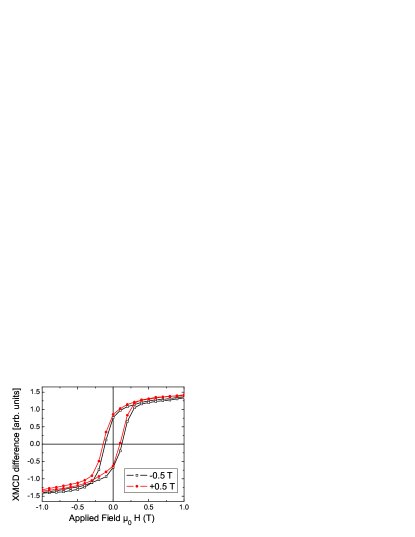
To further corroborate our conclusion that the observed vertical shift is mainly due to the FM and its interface region with the AFM layer we show the hysteresis loops acquired using x-ray magnetic circular dichroism in Fig. 10. For sample A we find a shift of about 5% using the surface sensitive approach measuring the response of the Mn ions within the LSMO FM layer only. The observed vertical shift is a clear indication that the FM layer is contributing to the effect and that the shift is not confined to the bulk of the AFM. Assuming that 95% of the secondary electrons detected in our experiment originate from the top 6 nm Ohldag et al. (2003, 2006) we can conclude that the interfacial region of the FM/AFM layer contributes significantly more to the mshift compared to the surface layers of the FM. This result agrees with the estimate from the bulk SQUID measurements that one needs about 1 nm thick FM layer (for samples A as well as B) to account for the observed . Taking into account the previous statement that it is highly unlikely that the entire AFM bulk contributes to the shift we can conclude that the excess magnetization is produced predominately at the FM interface during the field cooling process due to interfacial exchange coupling between the AFM and the FM as shown previously for the case of Co/FeF2 Ohldag et al. (2006).
Using similar arguments on the importance of the magnetic dilution of the AFM layer Nowak et al. (2002b, a), we argue that in our system the dilution of the FM layer may play a mayor role in the shift. In other words, the robust AFM layer influences the magnetic behavior of the FM one, within a certain thickness from the interface. We note that some kind of -shift were recently reported for ferrimagnetic very thin hard/soft (3nm/12nm) DyFe2/YFe2 heterostructures.Fitzsimmons et al. (2009) However, in that work the effect is in opposite direction to that of the applied , in contrast to our observations.
Furthermore, a comparison between the overall behavior obtained for and indicates that there is no simple correlation between the two exchange bias effects. Note that decreases strongly from sample A to B, whereas increases. Although element selective x-ray magnetic measurements would help to determine the penetration depth of the UCM in each of the layers, it is clear from our SQUID measurements that the o-YMO layer alone cannot be the reason for the observed giant effect, this is the main message of our work.
In conclusion, our studies on LSMO/o-YMO bilayers and on a single LCMO/o-YMO bilayer found large uncompensated shifts, whose sign correlates with the direction of the cooling field . Both, the exchange-bias and effects, vanish near of the YMO layer. The large values indicate that the AFM layer cannot be the only responsible but a certain thickness of the FM layer near the interface. This behavior can be actually understood taking similar arguments as those used for the AFM layer in the domain state exchange-bias model of Refs. Nowak et al., 2002a, b. Tuning the thickness and magnetic dilution of the FM layer one should be able to obtain large shifts making it an effect worth to study in systems with K. The different behaviors of and with temperature, cooling field and FM layer thickness indicate that these two phenomena are not correlated in a simple way.
Acknowledgements.
We thank M. Ziese for fruitful discussions and for pointing us Ref. Pi et al., 2006 and A. Setzer for technical assistance. This work was supported by the DFG within the Collaborative Research Center (SFB 762) “Functionality of Oxide Interfaces”. One of us (C.Z.) was supported by the Sächsisches Staatsministerium für Wissenschaft und Kunst under 4-7531.50-04-0361-09/1. SSRL and ALS are national user facilities supported by the Department of Energy, Office of Basic Energy Sciences. SSRL is operated by Stanford University and ALS is operated by the University of California.References
- (1)
- Meiklejohn and Bean (1957) W. Meiklejohn and C. Bean, Phys. Rev. 105, 904 (1957).
- Nogués and Schuller (1999) J. Nogués and I. K. Schuller, J. Magn. Magn. Mat. 192, 203 (1999).
- Skumryev et al. (2003) V. Skumryev, S. Stoyanov, Y. Zhang, G. Hadjipanayis, D. Givord, and J. Nogués, Nature (London) 423, 850 (2003).
- Miltényi et al. (2000) P. Miltényi, M. Gierlings, J. Keller, B. Beschoten, G. Güntherodt, U. Nowak, and K. D. Usadel, Phys. Rev. Lett. 84, 4224 (2000).
- Hong et al. (2006) J.-I. Hong, T. Leo, D. J. Smith, and A. E. Berkowitz, Phys. Rev. Lett. 96, 117204 (2006).
- Nogués et al. (2000) J. Nogués, C. Leighton, and I. K. Schuller, Phys. Rev. B 61, 1315 (2000).
- Keller et al. (2002) J. Keller, P. Miltényi, B. Beschoten, G. Güntherodt, U. Nowak, and K. D. Usadel, Phys. Rev. B 66, 014431 (2002).
- Cheon et al. (2007) M. Cheon, Z. Liu, and D. Lederman, J. Appl. Phys. 101, 095E503 (2007).
- Nowak et al. (2002a) U. Nowak, K. D. Usadel, J. Keller, P. Miltényi, B. Beschoten, and G. Güntherodt, Phys. Rev. B 66, 014430 (2002a).
- Ohldag et al. (2003) H. Ohldag, A. Scholl, F. Nolting, E. Arenholz, S. Maat, A. T. Young, M. Carey, and J. Stöhr, Phys. Rev. Lett. 91, 017203 (2003).
- Ohldag et al. (2006) H. Ohldag, H. Shi, E. Arenholz, J. Stöhr, and D. Lederman, Phys. Rev. Lett. 96, 027203 (2006).
- Gruyters and Schmitz (2008) M. Gruyters and D. Schmitz, Phys. Rev. Lett. 100, 077205 (2008).
- Hsieh et al. (2008) C. C. Hsieh, T. H. Lin, H. C. Shih, C.-H. Hsu, C. W. Luo, J.-Y. Lin, K. H. Wu, T. M. Uen, and J. Y. Juang, J. Appl. Phys. 104, 103912 (2008).
- Kim et al. (2006) J. Kim, S. Jung, M. S. Park, S.-I. Lee, H. D. Drew, H. Cheong, K. H. Kim, and E. J. Choi, Phys. Rev. B 74, 052406 (2006).
- Laukhin et al. (2006) V. Laukhin, V. Skumryev, X. Martí, D. Hrabovsky, F. Sanchez, M. García-Cuenca, C. Ferrater, M. Varela, U. Lüders, J. F. Bobo, et al., Phys. Rev. Lett. 97, 227201 (2006).
- Li et al. (2009) S. Z. Li, Z. B. Yan, T. Wei, S. J. Luo, B. Liu, K. F. Wang, and J. M. Liu, Appl. Phys. A 94, 975 (2009).
- Demmel and Chatterji (2007) F. Demmel and T. Chatterji, Phys. Rev. B 76, 212402 (2007).
- Marti et al. (2009) X. Marti, V. Skumryev, A. Cattoni, R. Bertacco, V. Laukhin, C. Ferrater, M. V. García-Cuenca, M. Varela, F. Sánchez, and J. Fontcuberta, J. Magn. Magn. Mater. 321, 1719 (2009).
- Nowak et al. (2002b) U. Nowak, A. Misra, and K. D. Usadel, J. Magn. Magn. Mat. 240, 243 (2002b).
- Radu et al. (2003) F. Radu, M. Etzkorn, R. Siebrecht, T. Schmitte, K. Westerholt, and H. Zabel, Phys. Rev. B 67, 134409 (2003).
- Radu and Zabel (2008) F. Radu and H. Zabel, Magnetic Heterostructures, vol. 227 of STMP (Springer Berlin, Heidelberg, 2008).
- Fitzsimmons et al. (2009) M. R. Fitzsimmons, C. Dufour, K. Dumesnil, J. Dou, and M. Pechan, Phys. Rev. B 79, 144425 (2009).
- Ke et al. (2004) X. Ke, M. S. Rzchowski, L. J. Belenky, and c. B. Eom, Appl. Phys. Lett. 84, 5458 (2004).
- Canet et al. (2001) F. Canet, S. Mangin, C. Bellouard, M. Piécuch, and A. Schuhl, J. Appl. Phys. 89, 6916 (2001).
- van Lierop et al. (2007) J. van Lierop, K.-W. Lin, J.-Y. Guo, H. Ouyang, and B. W. Southern, Phys. Rev. B 75, 134409 (2007).
- van der Zaag et al. (2000) P. J. van der Zaag, Y. Ijiri, J. A. Borchers, L. F. Feiner, R. M. Wolf, J. M. Gaines, R. W. Erwin, and M. A. Verheijen, Phys. Rev. Lett. 84, 6102 (2000).
- Shi et al. (2004) H. Shi, D. Lederman, K. V. O’Donovan, and J. A. Borchers, Phys. Rev. B 69, 214416 (2004).
- Fina et al. (2010) I. Fina, X. Martí, L. Fàbrega, F. Sànchez, and J. Fontcuberta, Thin Solid Films (2010), to be published.
- Pi et al. (2006) L. Pi, S. Zhang, S. Tah, and Y. Zhang, Appl. Phys. Lett. 88, 102502 (2006), see also the comment by L. Klein, idem 89, 036101 (2006) and the Erratum by the authors in idem 89, 039902 (2006).
- Hoffmann et al. (2009) A. Hoffmann, S. J. May, S. G. E. te Velthuis, S. Park, M. R. Fitzsimmons, G. Campillo, and M. E. Gómez, Phys. Rev. B 80, 052403 (2009).