Probing the transition between the synchrotron and inverse-Compton spectral components of 1ES 1959+650
Abstract
1ES 1959+650 is one of the most remarkable high-peaked BL Lacertae objects (HBL). In 2002 it exhibited a TeV –ray flare without a similar brightening of the synchrotron component at lower energies. This orphan TeV flare remained a mystery. We present the results of a multifrequency campaign, triggered by the INTEGRAL IBIS detection of 1ES 1959+650. Our data range from the optical to hard X-ray energies, thus covering the synchrotron and inverse-Compton components simultaneously. We observed the source with INTEGRAL, Swift/XRT, and UV-Optical Telescope, and nearly simultaneously with ground-based optical telescope. The steep spectral component at X-ray energies is most likely due to synchrotron emission, while at soft -ray energies the hard spectral index may be interpreted as the onset of the high-energy component of the blazar spectral energy distribution (SED). This is the first clear measurement of a concave X-ray – soft -ray spectrum for an HBL. The SED can be well modeled with a leptonic synchrotron- self-Compton model. When the SED is fitted this model requires a very hard electron spectral index of 1.85, possibly indicating the relevance of second-order Fermi acceleration.
Subject headings:
BL Lacertae objects: individual (1ES 1959+650) – galaxies: jets – radiation mechanisms: non-thermal – X-rays: galaxiesOnline-only material: color figures
1. Introduction
Blazars are very bright from radio frequencies to gamma-ray energies (Ulrich et al., 1997) due to the alignment of their jets with respect to the line of sight of the observer (Antonucci, 1993; Urry & Padovani, 1995). Relativistic beaming in these outflows (Rees, 1966) enhances the observed flux and shortens the variability timescales. The spectral energy distribution (SED) typically shows a non-thermal two-component structure. The low-energy emission is generally believed to be produced through synchrotron radiation of relativistic electrons. In contrast, the nature of the high-energy component is still being debated. A possible explanation is that the same electron population that is responsible for the low-energy component generates the high-energy component through Compton scattering (Sikora et al., 1994; Dermer & Schlickeiser, 1993). Alternative explanations are proton-initiated cascades (Mannheim, 1993) or proton-synchrotron emission from ultrarelativistic protons (Mücke et al., 2003).
The position of the synchrotron peak defines two classes of BL Lac objects: high frequency peaked BL Lac objects (HBL, peak at UV–X-ray frequencies) and Low frequency peaked BL Lac objects (LBL, peak in the IR–optical band). 1ES 1959+650, at z = 0.046 (Véron-Cetty & Véron, 2006), is one of the best-studied member of the former group. It was first detected at X-rays during the Slew Survey of Einstein–IPC (Elvis et al., 1992). Further observations detected the object at X-rays with ROSAT and BeppoSAX (Beckmann et al., 2002). Based on the X-ray/radio versus X-ray/optical color–color diagram the source was classified as BL Lac object by Schachter et al. (1993). The blazar was also detected at -rays by EGRET (Hartman et al., 1999). Very recently, the source was included in the Fermi first catalog of active galactic nucleus (AGN;Abdo et al. 2010). 1ES 1959+650 was observed several times at TeV energies (Aharonian et al., 2003). On 2002 June 4, followed by the detection of a strong TeV -ray flare of the source with the 10m Whipple Čerenkov Telescope, Target of Opportunity observations in optical and X-rays were performed. Despite an increased activity in the –rays, no flux variation was detected in X-rays (Krawczynski et al., 2004) during simultaneous observations by the Rossi X-Ray Timing Explorer (RXTE). As a possible explanation, a hadronic synchrotron-mirror model has been suggested by Böttcher (2005), but this suffers from rather extreme energy requirements (Böttcher, 2007). Hence, the origin of the orphan TeV flare is at present not understood. It is therefore important to monitor the synchrotron and inverse-Compton components simultaneously.
In this Letter, we report on a multiwavelength campaign on 1ES 1959+650 ranging from the optical to hard X-ray energies. In Section 2, we describe the observations of the multiwavelength campaign, and in Section 3 its results. In Section 4, we summarize our main conclusions.
2. Observations
| Instrument | Start Date UTC | Exp (s) | Band | mag | Err | Fluxb |
|---|---|---|---|---|---|---|
| UVOT | 2007-Nov-16 02:34:55 | 1069 | 14.96 | 0.02 | - | |
| UVOT | 2007-Nov-23 03:00:46 | 479 | 14.98 | 0.03 | - | |
| UVOT | 2007-Nov-23 04:34:45 | 539 | 15.09 | 0.02 | - | |
| UVOT | 2007-Nov-30 17:54:42 | 98 | 15.33 | 0.03 | - | |
| UVOT | 2007-Nov-30 17:56:10 | 165 | 15.19 | 0.03 | - | |
| UVOT | 2007-Nov-30 17:58:55 | 388 | 14.78 | 0.02 | - | |
| UVOT | 2007-Nov-30 18:05:23 | 318 | 14.63 | 0.02 | - | |
| 60 | 2007-Dec-03 01:56:02 | 30 | 15.28 | 0.03 | - | |
| 60 | 2007-Dec-04 01:56:33 | 30 | 15.29 | 0.03 | - | |
| 60 | 2007-Dec-05 01:54:03 | 30 | 15.32 | 0.03 | - | |
| 60 | 2007-Dec-11 02:25:35 | 30 | 15.38 | 0.03 | - | |
| ISGRI | 2007-Nov-24 16:51:47 (624) | 55000 | - | - | - | 4.5 |
| ISGRI | 2007-Nov-25 19:47:58 (625) | 198000 | - | - | - | 3.8 |
| ISGRI | 2007-Nov-28 20:16:36 (626) | 198000 | - | - | - | 5.3 |
| ISGRI | 2007-Dec-01 19:19:58 (627) | 208000 | - | - | - | 2.6 |
aFor ISGRI observation, revolution number is reported in bfluxes that are computed in the 20 – 40 keV energy range in units of 10-11 erg cm-2 s-1.
2.1. The 2007 multiwavelength campaign
1ES 1959+650 was monitored by INTEGRAL (from 2007 November 27th to 2007 December 1st 2007 ) during the North Ecliptic Pole Key Program (proposal id: 0531000). The source was detected by IBIS/ISGRI (Bottacini et al., 2007) in the 20 – 40 keV band in an active state at a significance of 7.2 . Simultaneous X-ray and UV observations were obtained as a Target of Opportunity with Swift on 2007 November 30th. From December 3-11, the Palomar (60) telescope performed optical photometry. Details of the multiwavelength campaign can be found in Table 1.
2.1.1 UV to Optical Observations
UVOT. 1ES 1950+650 was observed in the , , , and bands (having central wavelengths in units of Å at 3465, 4392, 2600, 1928 respectively) with the UV-Optical Telescope (UVOT; Roming et al. 2005) on board the Swift satellite (Table 1). We used the standard pipeline reduced image products, co-added and exposure corrected within the XIMAGE111See http://heasarc.gsfc.nasa.gov/docs/xanadu/ximage/ximage.html environment. For the photometry we used the standard 5′′ aperture. The reddening correction of was applied according to Schlegel et al. (1998) and Cardelli et al. (1989).
Palomar. -band (central wavelength 5240 Å) observations were carried out with the robotic Palomar 60- inch telescope (Cenko et al., 2006) (see Table 1). Data were reduced with standard IRAF routines. Photometric calibration was performed relative to the USNO-B1 catalog,222See http://www.nofs.navy.mil/data/fchpix which leads to a systematic contribution to the photometric uncertainties of 0.5 mag.
2.2. X-ray observations
INTEGRAL. The INTEGRAL satellite observed the source during the North Ecliptic Pole Key Program with its imager IBIS/ISGRI (Lebrun et al., 2003) which operates in the 17 – 1000 keV range (Table 1). The observations were performed with a rectangular 5 5 dithering pattern. We used the standard Off-line Science Analysis (OSA; Courvoisier et al. 2003) software version 7.0 for the ISGRI analysis. Most recent matrices available for standard software (isgri_arf_rsp_0025.fits) were used for spectral analysis. We used 83 science windows for a total amount of 661 ks of exposure time. Data screening was performed according to the median count rate with respect to each science window and its distribution. After data cleaning the effective exposure on the source is 466 ks. INTEGRAL/SPI upper limits were obtained with the SPIMODFIT software, which is available in OSA. It performs spectral model fitting for point sources and diffuse emission based on the maximum likelihood method as described in Petry et al. (2009). Due to the adopted dithering pattern, 1ES 1959+650 is outside the field of view of INTEGRAL’s Joint European Monitor for X rays (JEM-X; Lund et al. 2003) for at least 77 % of the observation time. For the same reason the Optical Monitoring Camera (OMC; Mas-Hesse et al. 2003) could not point to the source. Therefore, no flux measurement could be obtained from these instruments.
Swift/XRT. The X-Ray Telescope (XRT; Burrows et al. 2005) on board Swift observed the blazar in 2007 November (Start date: UTC 2007 November 30 11:57:33) for an exposure time of 1283 s. Data processing, screening and filtering were done using the FTOOL xrtpipeline included in the HEAsoft 6.3 distribution.
3. Results
| Inst. | Fit Mo | NH | Eb | Norm | 2/dof | Fluxa | ||
|---|---|---|---|---|---|---|---|---|
| (1) | (2) | (3) | (4) | (5) | (6) | (7) | (8) | (9) |
| XRT | ab pl | 0.17 | 2.1 | - | - | 4.1 | 178/192 | 1.09 |
| XRT | ab pl | fixed | 2.0 | - | - | 3.3 | 196/193 | 1.09 |
| ISGRI | pl | - | 1.2 | - | 7.8 | 0.6/3 | 1.4 | |
| joint | ab bkn | fixed | 1.9 | 7.6 | 7.2 | 3.3 | 200/198 | - |
| joint | log-par | fixed | 1.3 | 0.6 | - | 3.4 | 323/199 | - |
Explanation of columns: (1)instruments; (2)fit model; (3)column density (units of 1022 cm-2); (4)spectral index; (5)spectral index after break; (6)break energy; (7)normalization (units of 10-4 ph keV-1 cm-2); (8)statistical fit result; (9)flux units are 10-8 erg cm-2 s-1 for XRT and joint spectra and 10-11 erg cm-2 s-1 for IBIS/ISGRI spectrum; afluxes are computed in the 0.6 – 6.0 keV and 20 – 60 keV energy ranges for the XRT and ISGRI respectively.
3.1. Variability analysis
Blazars are strongly variable objects on timescales as short as minutes to hours (e.g., Fossati et al. 2008). The long exposures used with IBIS/ISGRI may therefore be affected by variations in flux and spectrum. Thus, we analyzed the available multiwavelength data set for indications of variability.
The non-simultaneous (to IBIS/ISGRI, Swift/XRT and Swift/UVOT; see Table 1) Palomar 60- inch observations show a very low variability in brightness of the source of % at a significance of 3.
The UVOT observations show marginal brightness variations by about 10 % on a daily timescale and 20 % on inter-day timescales (significant at 6).
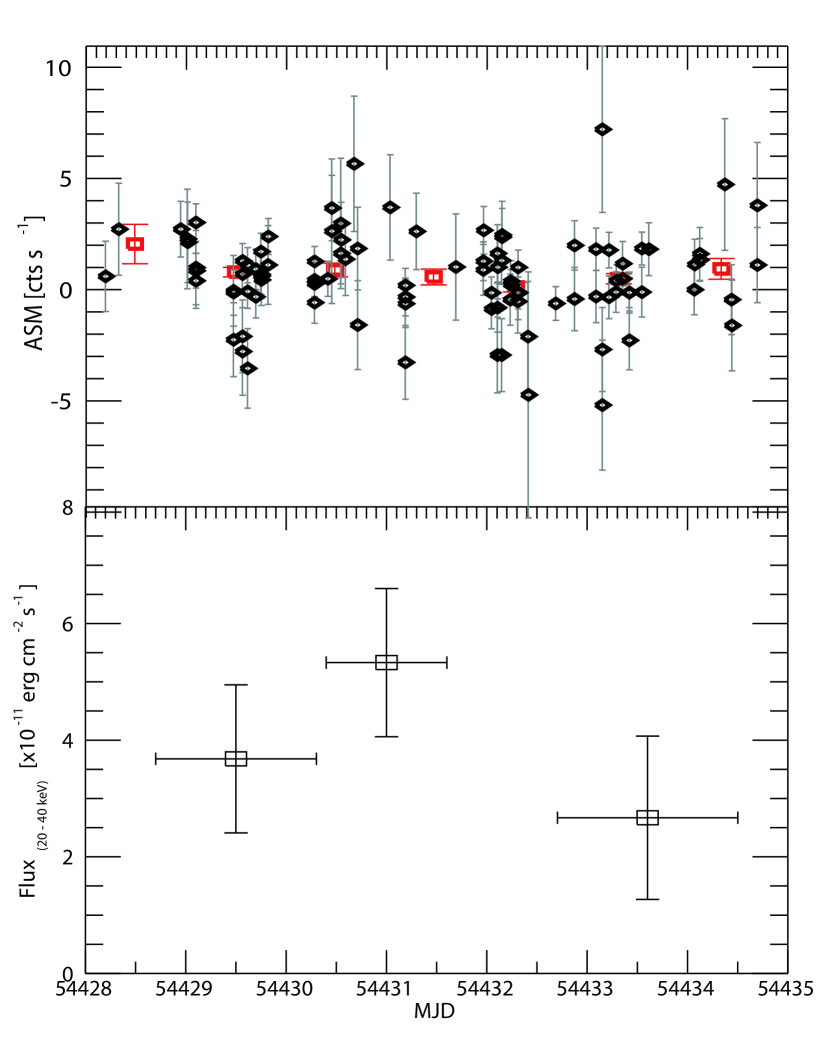
The all-sky monitor (ASM; Levine et al. 1996) on the RXTE) provides regular monitoring of 1ES 1959+650 in the 1.5 – 10 keV band 333http://xte.mit.edu/asmlc/ASM.html. The dwell-by-dwell 90 s exposure light curve does not show flaring activity during the INTEGRAL/IBIS observations (Figure 1, upper panel). The one-day average light curve excludes the presence of any flare, and it shows flux variability ( %), well within the errors.
The 20-40 keV IBIS/ISGRI light curve binned per revolution is shown in Figure 1 - lower panel (revolutions 624 and 625 are co-added). The low detection significance of the source in each individual revolution () does not allow a proper light-curve fitting. If binned to SCW level (time binning of 1 hr), the light curve does not allow to rule out some marginally significant variability due to the low signal-to-noise ratio (S/N). However, we can exclude any flaring activity in the 20-40 keV band.
3.2. Swift/XRT and IBIS/ISGRI spectra
The fit results for the single Swift/XRT and averaged IBIS/ISGRI spectrum are shown in Table 2. The spectra were fitted using XSPEC 12 and the latest available response matrices for calibration. IBIS/ISGRI detected 1ES 1959+650 with a flux of 1.5 10-11 erg cm-2 s-1 in the 20 – 60 keV range. The low Galactic NH- value (1.0 1021 cm-2; Dickey & Lockman 1990) does not affect the IBIS/ISGRI energy range, and we do not see evidence for further absorption or deviations from a single power law.
The best-fit result ( 0.9) for the Swift/XRT spectrum is given by an absorbed power-law model, with absorption parameter free to vary. The derived NH-value (1.7 1021 cm-2) is a factor 1.7 larger (at a significance of 2) than the Galactic one.
We do not see significant variability neither on long timescales nor on short timescales in the hard X-ray (20 – 40 keV) and in the X-ray (1.5 – 10 keV) bands during the multifrequency campaign (see Figure 1). Therefore, we combine the relatively short (simultaneous to IBIS/ISGRI) Swift/XRT observation (0.6 – 6 keV) with the averaged IBIS/ISGRI spectrum. We model the data best with a broken power-law model with the absorption parameter fixed to the Galactic value. Furthermore, we have applied a log-parabolic model:
| (1) |
This curved model was first proposed by Landau et al. (1986) to describe the synchrotron component of BL Lac objects. Massaro et al. (2004) used it to describe the synchrotron X-ray component of the spectrum of TeV BL Lac objects. The model is explained in physical terms by means of radiative cooling processes (via synchrotron and inverse-Compton) of the high-energy electron population injected with power-law slope. The log-parabolic law is a rather simple analytical formula related to physical parameters of the source. It is applied to synchrotron broadband spectra since it better describes the spectra compared to power laws with exponential cutoff. The photon index is considered at energy , and the parameter describes the curvature of the spectrum. The fit result is reported in Table 2.
4. The spectral energy distribution
| D | |||||||||||
|---|---|---|---|---|---|---|---|---|---|---|---|
| (1) | (2) | (3) | (4) | (5) | (6) | (7) | (8) | (9) | (10) | (11) | (12) |
| leptonic | 0.5 | 10 | 14 | 19 | 1103 | 6104 | 1.85 | - | - | - | - |
| lepto-hadronic | 2 | 5 | 20 | 19 | 8102 | 4.5104 | 1.9 | 1103 | 1.2109 | 1.9 | 3.5 |
Explanation of columns: (1) = SED model; (2) = radius of emitting region in units of cm; (3) = escape time parameter: ; (4) = magnetic field in Gauss; (5) = Doppler factor; (6) and (7) = minimum and maximum random Lorentz factors of the injected electrons; (8) = slope of the injected electron distribution; (9) and (10) = minimum and maximum random Lorentz factors of the injected protons; (11) = slope of the injected proton distribution; (12) = kinetic power of relativistic protons in units of 1046 erg s-1.
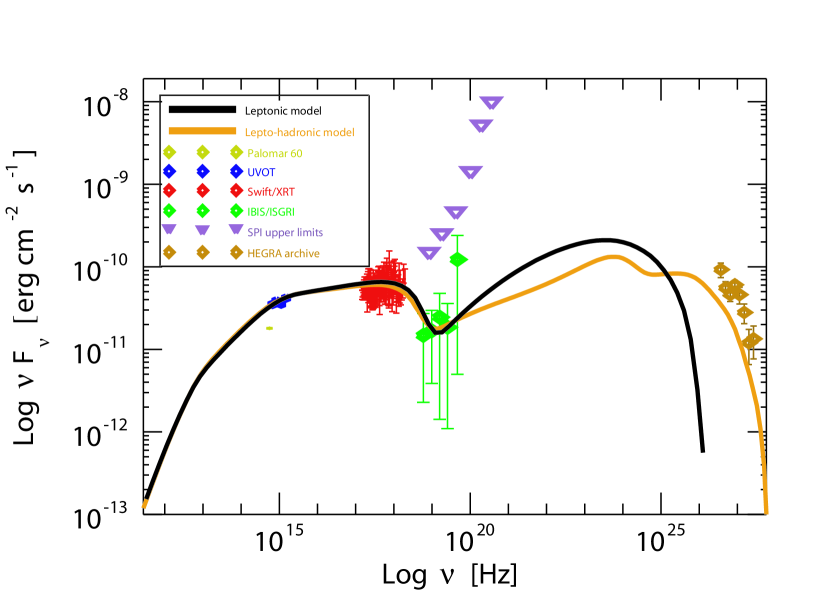
In order to construct a multiwavelength spectrum of the source we use the data sampled during the simultaneous multifrequency campaign in 2007. At TeV energies we show non simultaneous archive HEGRA IACT data (Aharonian et al., 2003), when the source showed a major outburst (in 2002). Such activity at TeV energies was not reported during our multifrequency campaign in 2007. Therefore these data are not used to constrain our SED model.
Given the lack of variability on short and long timescales, we used the average values in each energy band to construct the SED. The SED of 1ES 1959+650 shows the typical two-component structure of an HBL (Figure 2). The synchrotron peak can be constrained by the XRT spectrum ( 2, see Table 2), whereas the hard X-ray–soft -ray data constrain the onset of the high-energy component. Indeed, the log-parabolic fit model for the synchrotron emission is not able to reproduce the jointly fitted XRT and IBIS/ISGRI data (see fit result in Table 2). This, in turn, suggests that the IBIS/ISGRI spectrum represents the onset of the high-energy component. The high-energy peak is very poorly constrained due to the lack of simultaneous -ray data. During its first year of survey, the Fermi Large Area Telescope (LAT) detects the source in quiescence state (Abdo et al., 2010). Therefore the power output measured by LAT is not comparable to the power output in the same energy range inferred with our model that refers to an active state of the source. The LAT measurement is a factor 6 lower. The Fermi-LAT observations are taken 1 year after our multifrequency campaign of 2007.
The data are modeled by a pure leptonic SSC model (see Figure 2 black solid line), using the equilibrium version of the code of Böttcher & Chiang (2002), as described in more detail in (Acciari et al., 2009). The geometry of the emitting region is a spherical volume of radius in the comoving frame. It moves with respect to the observer with a bulk Lorentz factor (speed c) at an angle , resulting in relativistic beaming determined by the Doppler factor. Ultrarelativistic leptons are injected into the emission region with a power-law distribution (in the comoving frame):
| (2) |
where the normalization is determined by the injection power . The code finds a self-consistent equilibrium between particle injection, radiative cooling due to synchrotron and synchrotron self-Compton (SSC) losses and particle escape on a timescale . The effect of absorption by the extragalactic background light (EBL) is taken into account using the model of Finke et al. (2010). The fit is constrained by the synchrotron component from the optical to X-rays as well as the onset of the SSC component at hard X-rays – soft -rays. The hard synchrotron spectrum as well as the unusually high level of the low-frequency end of the SSC component (see Figure 2) requires the choice of a very hard injection spectrum with a slope of . The optical data point from the Palomar observations were taken up to 10 days after the X-ray and UV pointings with XRT and UVOT respectively. They cannot be reconciled with our model SED. This is not surprising, as variability by a factor of on timescales of weeks is not uncommon in this object (Villata et al., 2000). The parameters used for the fit shown in Figure 2 are listed in Table 3. The equilibrium particle distribution found by the code corresponds to a kinetic power in relativistic electrons of erg s-1, while the magnetic field of G yields to a power in Poynting flux of erg s-1. Hence, the magnetic field energy density is a factor below equipartition. The hard injection index of (constrained by the mere synchrotron component) is inconsistent with standard first-order Fermi acceleration at relativistic shocks, which predicts an index of – 2.3 (Achterberg et al., 2001; Ellison & Double, 2004). This might indicate a substantial contribution to particle acceleration from second-order Fermi acceleration (Virtanen & Vainio, 2005; Stecker et al., 2007). A similar conclusion was also reached when modeling the very hard X-ray and Fermi -ray spectrum of the HBL RGB J0710+591, recently detected at very-high-energy (VHE) -rays by VERITAS.
As an alternative to the pure leptonic model, we have applied a semi-analytical lepto-hadronic model shown by the orange solid line in Figure 2. This model assumes, in addition to a leptonic component similar to the one used for the leptonic model described above, a power-law population of relativistic protons extending out to energies beyond the threshold for p pion production on the electron-synchrotron radiation field. The production rates of final decay products (electrons, positrons, decay photons, and neutrinos) are calculated using the analytical templates of Kelner & Aharonian (2008). Synchrotron emission of secondaries is calculated using a approximation. The decay photons as well as synchrotron emission from the first-generation pairs from charged pion decay are produced predominantly at TeV energies, at which the emission region is highly opaque to absorption. Therefore, the radiative power at those energies is redistributed to lower frequencies through electromagnetic cascades. We employ a semi-analytical treatment of the cascading process as described in Böttcher (2010). The inferred parameters are reported in Tabel 3, and they are in good agreement with the leptonic model.
5. Conclusions
We have performed a multiwavelength campaign on 1ES 1959+650 in 2007. This is the first and only detection by IBIS/ISGRI of the source. The source was monitored nearly simultaneously from optical to hard X-ray energies. In the optical to UV band the most evident flux variations are of the order of 20 % on inter-day timescales. At hard X-rays the source flux stayed constant. The compiled SED allowed us to derive the physical parameters of the source. The SED clearly shows the simultaneous detection of both the synchrotron and the rise of the high-energy (inverse-Compton) emission components. This is the first time that the transition region between the synchrotron and inverse-Compton components is detected for 1ES 1959+650, and has so far been measured only for a few other BL Lac objects of intermediate type. The best example is ON 231 (Tagliaferri et al., 2000) which is an Intermediate BL Lac object (IBL). These objects are characterized by SEDs peaking at frequencies intermediate to LBL and HBL. Other examples, not as clear as the previous one, are PKS 2155-304 (Kubo et al., 1998; Foschini et al., 2008), another IBL, and S5 0716+714 (Foschini et al., 2006; Giommi et al., 1999), an LBL. Foschini et al. (2008) suggest that the source is in a continuous high active state and only seldom lowers its activity shifting the position of the peak of the synchrotron emission to lower frequencies. For HBL objects, the synchrotron peak is located usually at soft X-ray energies and exceptionally at hard X-ray energies, thus making the descending branch of the synchrotron component and the ascending branch of the inverse-Compton component difficult or impossible to measure. This interesting hard X-ray regime (20 keV – 1 MeV) is important since the two emission components are competing: higher fluxes translate into harder spectra indicating changes in the injected particle population. In turn this gives clues on the jet physics and its composition. Monitoring the hard X-ray to -ray domain allows to trace the evolution of the emission mechanism. This can be performed by instruments with higher sensitivity as could be GRIPS (Greiner et al., 2009), a future -ray mission proposed to the European Space Agency.
We reproduced the observed SED with a simple one-zone, leptonic SSC model and with a lepto-hadronic model. Both models required a very hard electron injection spectrum with an index of and for the leptonic and lepto-hadronic models respectively. This requirement might indicate the importance of second-order Fermi acceleration mechanisms in the energization of ultrarelativistic particles in the jet of 1ES 1959+650.
References
- Abdo et al. (2010) Abdo, A. A., Ackermann, M., Ajello, M., et al. 2010, ApJ, 715, 429
- Acciari et al. (2009) Acciari, V. A., Aliu, E., Aune, T., et al. 2009, ApJ, 707, 612
- Achterberg et al. (2001) Achterberg, A., Gallant, Y. A., Kirk, J. G., & Guthmann, A. W. 2001, MNRAS, 328, 393
- Aharonian et al. (2003) Aharonian, F., Akhperjanian, A., Beilicke, M., et al. 2003, VizieR Online Data Catalog, 340, 69009
- Antonucci (1993) Antonucci, R. 1993, ARA&A, 31, 473
- Beckmann et al. (2002) Beckmann, V., Wolter, A., Celotti, A., et al. 2002, A&A, 383, 410
- Bottacini et al. (2007) Bottacini, E., Beckmann, V., Ishibashi, W., Ajello, M., & Greiner, J. 2007, The Astronomer’s Telegram, 1315, 1
- Böttcher (2005) Böttcher, M. 2005, ApJ, 621, 176
- Böttcher (2007) Böttcher, M. 2007, Ap&SS, 309, 95
- Böttcher (2010) Böttcher, M. 2010, Proc. of Fermi Meets Jansky, MPIfR Bonn, Eds.: T. Savolainen, E. Ros, R. W. Porcas & J. A. Zensus; p. 41
- Böttcher & Chiang (2002) Böttcher, M. & Chiang, J. 2002, ApJ, 581, 127
- Burrows et al. (2005) Burrows, D. N., Hill, J. E., Nousek, J. A., et al. 2005, Space Science Reviews, 120, 165
- Cardelli et al. (1989) Cardelli, J. A., Clayton, G. C., & Mathis, J. S. 1989, ApJ, 345, 245
- Cenko et al. (2006) Cenko, S. B., Fox, D. B., Moon, D.-S., et al. 2006, PASP, 118, 1396
- Courvoisier et al. (2003) Courvoisier, T. J.-L., Walter, R., Beckmann, V., et al. 2003, A&A, 411, L53
- Dermer & Schlickeiser (1993) Dermer, C. D. & Schlickeiser, R. 1993, ApJ, 416, 458
- Dickey & Lockman (1990) Dickey, J. M. & Lockman, F. J. 1990, ARA&A, 28, 215
- Ellison & Double (2004) Ellison, D. C. & Double, G. P. 2004, Astroparticle Physics, 22, 323
- Elvis et al. (1992) Elvis, M., Plummer, D., Schachter, J., & Fabbiano, G. 1992, ApJS, 80, 257
- Finke et al. (2010) Finke, J. D., Razzaque, S., & Dermer, C. D. 2010, ApJ, 712, 238
- Foschini et al. (2006) Foschini, L., Tagliaferri, G., Pian, E., et al. 2006, A&A, 455, 871
- Foschini et al. (2008) Foschini, L., Treves, A., Tavecchio, F., et al. 2008, A&A, 484, L35
- Fossati et al. (2008) Fossati, G., Buckley, J. H., Bond, I. H., et al. 2008, ApJ, 677, 906
- Giommi et al. (1999) Giommi, P., Massaro, E., Chiappetti, L., et al. 1999, A&A, 351, 59
- Greiner et al. (2009) Greiner, J., Iyudin, A., & Kanbach, G. 2009, Exp. Astr., 23, 91
- Hartman et al. (1999) Hartman, R. C., Bertsch, D. L., Bloom, S. D., et al. 1999, ApJS, 123, 79
- Kelner & Aharonian (2008) Kelner, S. R. & Aharonian, F. A. 2008, Phys. Rev. D, 78, 034013
- Krawczynski et al. (2004) Krawczynski, H., Hughes, S. B., Horan, D., et al. 2004, ApJ, 601, 151
- Kubo et al. (1998) Kubo, H., Takahashi, T., Madejski, G., et al. 1998, ApJ, 504, 693
- Landau et al. (1986) Landau, R., Golisch, B., Jones, T. J., et al. 1986, ApJ, 308, 78
- Lebrun et al. (2003) Lebrun, F., Leray, J. P., Lavocat, P., et al. 2003, A&A, 411, L141
- Levine et al. (1996) Levine, A. M., Bradt, H., Cui, W., et al. 1996, ApJ, 469, L33+
- Lund et al. (2003) Lund, N., Budtz-Jørgensen, C., Westergaard, N. J., et al. 2003, A&A, 411, L231
- Mannheim (1993) Mannheim, K. 1993, A&A, 269, 67
- Mas-Hesse et al. (2003) Mas-Hesse, J. M., Giménez, A., Culhane, J. L., et al. 2003, A&A, 411, L261
- Massaro et al. (2004) Massaro, E., Perri, M., Giommi, P., & Nesci, R. 2004, A&A, 413, 489
- Mücke et al. (2003) Mücke, A., Protheroe, R. J., Engel, R., Rachen, J. P., & Stanev, T. 2003, Astroparticle Physics, 18, 593
- Petry et al. (2009) Petry, D., Beckmann, V., Halloin, H., & Strong, A. 2009, A&A, 507, 549
- Rees (1966) Rees, M. J. 1966, Nature, 211, 468
- Roming et al. (2005) Roming, P. W. A., Kennedy, T. E., Mason, K. O., et al. 2005, Space Science Reviews, 120, 95
- Schachter et al. (1993) Schachter, J. F., Stocke, J. T., Perlman, E., et al. 1993, ApJ, 412, 541
- Schlegel et al. (1998) Schlegel, D. J., Finkbeiner, D. P., & Davis, M. 1998, ApJ, 500, 525
- Sikora et al. (1994) Sikora, M., Begelman, M. C., & Rees, M. J. 1994, ApJ, 421, 153
- Stecker et al. (2007) Stecker, F. W., Baring, M. G., & Summerlin, E. J. 2007, ApJ, 667, L29
- Tagliaferri et al. (2000) Tagliaferri, G., Ghisellini, G., Giommi, P., et al. 2000, A&A, 354, 431
- Ulrich et al. (1997) Ulrich, M.-H., Maraschi, L., & Urry, C. M. 1997, ARA&A, 35, 445
- Urry & Padovani (1995) Urry, C. M. & Padovani, P. 1995, PASP, 107, 803
- Véron-Cetty & Véron (2006) Véron-Cetty, M. & Véron, P. 2006, A&A, 455, 773
- Villata et al. (2000) Villata, M., Raiteri, C. M., Popescu, M. D., et al. 2000, A&AS, 144, 481
- Virtanen & Vainio (2005) Virtanen, J. J. P. & Vainio, R. 2005, ApJ, 621, 313