11
A. Comastri
The high-redshift Universe with the International X-ray Observatory
Abstract
We discuss some of the main open issues related to the light–up and evolution of the first accreting sources powering high redshift luminous quasars. We discuss the perspectives of future deep X–ray surveys with the International X–ray Observatory and possible synergies with the Wide Field X-ray Telescope.
keywords:
Galaxies: active – X-rays; Active Galactic Nuclei – galaxies: high-redshift1 Introduction
The “dark ages” of the Universe ended when the UV radiation from the first objects reionized the intergalactic medium. This epoch began approximately at and so far has remained essentially unexplored. Investigating the end of the dark ages is extremely important to understand structure formation, since during this phase the first proto–galaxies and the first seed black holes, that would later grow into luminous quasars, formed. Observations of the most distant (z) quasars (QSOs) thus probe the very early growth of supermassive black holes (SMBHs) in the centers of massive galaxies.
The high luminosities and broad line widths of the most distant QSOs require BH masses above (Fan et al., 2001; Willott et al., 2003). The formation of such systems within the first 700-800 Myr of cosmic time is a challenge for theoretical models (i.e. Volonteri & Rees, 2005; Li et al., 2007; Begelman, 2010). A number of possibilities have been proposed for the origin of the seed BHs (from Pop III stars to more massive objects resulting from the direct collapse of molecular clouds), the accretion rate (Eddington limited or super Eddington) and the merging rate of dark halos in the early Universe. Even though suitable combinations of the above parameters may explain the presence of massive BHs at 6, the processes responsible for their assembly and light–up are largely unknown. The search for and the study of the first QSOs is a key scientific goal of future X–ray missions and in particular of the Wide Field X–ray Telescope (WFXT; Rosati et al. 2010, this book) and the International X–ray Observatory (IXO; White et al. 2010).
2 Supermassive Black Holes in the early Universe
Most of the SMBH accretion luminosity is emitted in the optical/UV and X–ray bands. As a consequence, optical and X–ray surveys have played a major role in the discovery of high–redshift quasars.
2.1 Optical surveys
A major step forward in the study of the high redshift Universe was achieved thanks to the Sloan Digital Sky Survey (SDSS). In a series of papers, Fan and collaborators searched for QSOs in different releases of the SDSS over an area of about 6600 deg2 with a color selection (–band drop out) technique (see Fan et al. 2001 for a detailed description). Their final sample includes 19 objects with and . Using the same technique, the search for 6 QSOs was recently extended towards lower luminosities () in the deep SDSS stripe by Jiang et al. (2008,2009), allowing the discovery of 12 additional objects. Thanks to the Canada France High Redshift Quasar Survey (CFHQS), which covers about 500 deg2 down to fainter magnitudes, and applying a similar selection criterion, 19 additional QSOs at 5.7 have been found (Willott et al., 2007, 2009, 2010). The number of optically selected QSOs revealed up to is large enough to determine their luminosity function. By combining the CFHQS data with the luminous SDSS QSOs, Willott et al. (2010) assembled a sample of 40 QSOs to estimate the 5.74 6.42 luminosity function over the range . Although the covariance between the slope and luminosity prevents strong constraints to be placed on either parameter, there is evidence for the detection of a break at . As far as luminous QSOs are concerned, an exponential decline () in their space density from 3 to 6 has been clearly observed. Although SDSS has pushed the redshift record well above 6 with a statistics good enough to estimate the cosmological space density of high- QSOs, it is crucial to point out that SDSS QSOs are among the brightest and most extreme sources in the early Universe (in terms of luminosities and BH masses), and thus probably not representative of the QSO population at those redshifts.
2.2 X–ray surveys
The Chandra and XMM sensitivities to faint and hard X–ray sources has opened up a new era in the observations of the high redshift Universe. The systematic study of high– ( 4) optically selected QSOs was pioneered by Brandt and coworkers (i.e. Kaspi et al., 2000; Vignali et al., 2003; Shemmer et al., 2006); see Brandt et al. 2004 for a review) with pointed snapshot observations, and further expanded by cross correlating the SDSS catalogues with the XMM archive (Young et al., 2009) and the Champ project (Green et al., 2009). Multifrequency observations point towards the absence of evolution in the X–ray spectral index, absorption, metallicity, emission–line strengths and dust properties over a broad redshift range suggesting that the physical mechanisms powering luminous QSOs are insensitive to the significant changes on larger scales that occur at 0–6 (Maiolino, 2006; Shemmer et al., 2006). Some departures from a self-similar evolution have emerged thanks to Spitzer near infrared observations of a small sample of 6 QSOs (Jiang et al., 2010). Two out of the 21 6 QSOs observed by Spitzer do not show any detectable emission from hot dust. There is also evidence that hot dust free QSOs have the smallest BH masses in the sample (2–3 10) and are accreting close to their Eddington limit, suggesting an early evolutionary stage.
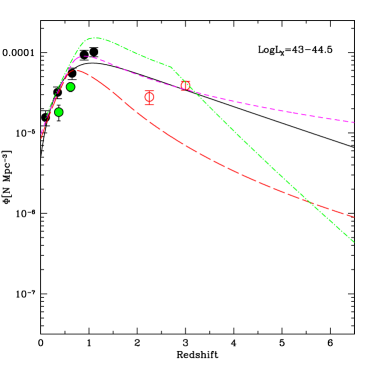
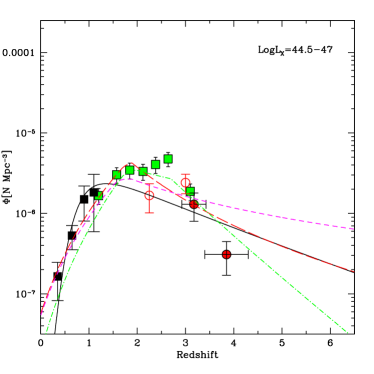
A major improvement in the study of the cosmological evolution of the X–ray emission of moderate to high– QSOs has been obtained in the last few years thanks to the large number of deep and medium–deep Chandra and XMM surveys. Large samples of X–ray selected objects were built, and by now the X–ray luminosity function is sampled up to 3–4, down to X–ray luminosities of the order of a few erg s-1 and to 2–3 at lower luminosities (see Fig. 1; Brusa et al. 2009; Ebrero et al. 2009; Yencho et al. 2009; Aird et al. 2010; Fontanot et al. 2007).
At higher redshifts, present X–ray observations are highly incomplete, being strongly limited by the survey areas. The redshift records for X–ray selected QSOs are reached in the COSMOS survey (; Civano et al 2010 ApJ in prep.) and in the CLASXS survey (; Steffen et al. 2004), with only one spectroscopically identified object per survey. Deep and ultra–deep Chandra surveys in the CDFS and CDFN would be sensitive to lower X–ray luminosities, but the lack of area coverage is much more severe. Also in this case only one 5 spectroscopically confirmed AGN is found in the CDFN at = 5.19, (Barger et al., 2005), and none in the CDFS (Luo et al., 2010). As a result, the space density of X–ray selected QSOs is still unconstrained at 5.
3 Beyond 6
The volume and surface density of the first QSOs can be estimated following two different approaches. A theoretical one, by building up semi analytical models (SAMs) which include a description as accurate as possible of the complex physical processes thought to be at work and key model parameters such as the seed BH mass, the accretion rate and the peak in the density field fluctuations above which they can start to form. Alternatively, an observational route may be followed. The best fit luminosity function and evolution, as measured by present X–ray surveys or by optical surveys can be extrapolated to high redshifts with some educated guesses on the optical to X–ray luminosity ratio.
Fig. 1 shows the most updated compilation of the X–ray luminosity function (XLF) parameterized with a Luminosity Dependent Density Evolution phenomenological model (LDDE; Silverman et al. 2008; Ebrero et al. 2009) or a Luminosity and Density Evolution model (LADE; Aird et al. 2010). The predictions based on the AGN synthesis model for the XRB of Gilli et al. (2007) are also shown, obtained by including an exponential cut–off in the XLF evolution at =2.7, which is a good description of the observed space density of luminous QSOs in the XMM–COSMOS survey (Brusa et al., 2009).
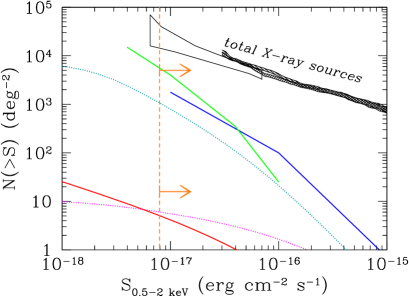
A detailed description of the best fit parameters of each XLF is beyond the purposes of this paper. Here we would like to stress that the extrapolations beyond the redshift range where the XLF was computed may differ by more than one order of magnitude. Moreover, the faint end of the XLF is poorly determined, even at relatively low redshifts (left panel of Fig. 1), making the predictions even more uncertain. The space density of 6 QSOs predicted by a few recent SAMs (Marulli et al., 2009; Salvaterra et al., 2007; Rhook & Haehnelt, 2008) are compared with the extrapolation of the observed XLF in the left panel of Fig. 2.
The lower dotted curve corresponds to the “decline” model (cfr. Fig. 1) which is found to provide a good fit to the observed space density of 3–5 QSOs in the Chandra–COSMOS survey (Civano et al. 2010, in prep.). The upper dotted curve corresponds to an ad–hoc parameterization of the XLF high–redshift evolution named “maxXLF”. The space density of low luminosity (log 44) AGN is kept constant at . This model maximizes the predicted number of higher redshift QSOs, being at the same time in agreement with the observational results at lower , hence the name “maxXLF” (see Fig. 1 in Gilli et al. 2010, this volume). Different choices for the evolution of the luminosity function (cfr. Fig. 1) would correspond to space densities in between the “decline” and the “maxXLF” predictions which should then be considered as a conservative and an optimistic estimate, respectively.
4 Breaking through the first typical AGN
The bulk of the population of high–z QSOs representative of the first accreting objects in the Universe is likely to be characterized, on average, by relatively low X–ray luminosities and BH masses. Large area optical and near–infrared surveys such as those foreseen with future ground-based facilities and space observatories like panstarrs, vista, lsst and jdem/euclid will discover a large number of high- QSOs. The above surveys will be biased against dust obscured QSOs and faint active nuclei for which the host galaxy starlight cannot be neglected.


X–ray observations can probe much lower luminosities and high absorption column densities. Moreover, the X–ray emission is the telltale of an accreting object. A blind search for X–ray selected 5–6 QSOs would require to survey several tens of square degrees to a depth comparable to that reached in the Chandra deep surveys (about 0.2 square degrees for a total observing time of 6 Ms) and is far beyond the capabilities of current X–ray facilities.
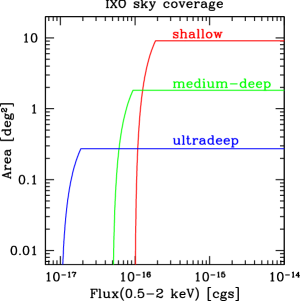
Thanks to its large effective area at 1 keV ( 3 m2) and good spatial resolution (5 arcsec HPD), IXO will perform deep surveys reaching limiting fluxes below erg cm-2 s-1 in the 0.5–2 keV energy range (Fig. 2, left panel). The final sensitivity will depend on the actual number of faint sources which sets the confusion limit. In order to harvest a significant number of moderate luminosity, obscured AGN at 6 and to cope with the present large uncertainties on their predicted space density, a typical multi–cone observing strategy is mandatory.
A possible observational strategy for a multi–cone IXO survey with the Wide Field Imager (WFI) is shown in the right panel of Fig. 2. The total observing time invested in cosmological surveys would be of the order of 18 Ms broadly split in deep (3 pointings, 2 Ms each) medium (20 pointings, 300 ks each) and shallow (100 pointings, 60 ks each) corresponding to about 10 months of observing time assuming an efficiency of 70%, though it should be noted that shallower observations will be performed anyway for a wide range of scientific investigations.
The expected number of QSOs will range from a few hundreds to more than a thousands, while at 6 the predicted number of sources could vary beween a dozen up to a few hundreds, reflecting the uncertainties reported in Fig. 1 and 2. Taking a median value, the total number of high– QSOs will be sufficient to constrain the evolution of the faint end of the XLF down to 1042 erg s-1 and up to 6. IXO will also be able to detect the very first objects at 10, if they exist, and if their X–ray luminosity is larger than approximately 1043 erg s-1. IXO deep surveys need to be performed over well studied sky areas at longer wavelengths to ease the process of source identification and redshift determination. The excellent IXO angular resolution and sensitivity coupled with the capabilities of jwst, alma, e-elt and tmt will allow to study the assembly of early Black Holes and their host galaxies.
The large IXO collecting area is extremely well suited for detailed spectroscopic studies. According to the currently accepted models for the joint evolution of SMBH and their host galaxies (Hopkins et al., 2006; Lamastra et al., 2010), the fraction of obscured and heavily absorbed or Compton Thick ( cm-2) AGN is predicted to increase with redshift (i.e. Menci et al., 2008). From an observational point of view, the issue of an increased fraction of obscured AGN at high redshifts is still debated (see the discussion in Gilli et al. 2010). Irrespective of what the true fraction is, the study of heavily obscured AGN at high– would bear important information on the formation and early growth of the first active galaxies. Primordial, gas and dust rich galaxies, should undergo a phase of high obscuration, gas accretion on the central BH and vigorous starformation, making deep hard X–ray observations an ideal tool for their discovery. The IXO spectroscopic capabilities are shown in the two panels of Fig. 3. The spectrum of a luminous ( 1044 erg s-1), mildly obscured ( cm-2) QSO at =6 is simulated with a 100 ks WFI exposure. The 6.4 keV iron line EW is assumed to be 280 eV rest–frame. The residuals, with respect to an absorbed power law fit show a line–like feature with an observed frame EW of 40 eV. In the right panel, the X–ray emission of a 7, 1043 erg s-1, CT AGN is modeled with a pure reflection spectrum plus a strong (EW 1.2 keV rest–frame) iron K line. The residuals of the fit with the same model, without including line emission, show that the iron line can be used to directly measure source redshift with an accuracy of 0.2.
5 IXO and WFXT Synergies
The study of the first SMBH would greatly benefit from joint WFXT and IXO surveys. The synergies between the two proposed missions are obviously clear. The WFXT multi-tiered survey strategy is designed to maximize the yield in the discovery of high– AGN. Detailed and quantitative estimates are extensively discussed in Gilli et al. (2010, this volume). IXO with its superior sensitivity to faint sources would be unique for spectroscopic follow–up of the large WFXT samples and to discover the faintest AGN at the highest redshifts. At the flux of erg cm-2 s-1, about 300 AGN at 6 are expected in the WFXT medium survey assuming a conservative “decline” model. Relatively inexpensive IXO pointings (100 ks each), would allow us to obtain spectra of the quality show in the left panel of Fig. 3, making possible to measure metal abundances and many other QSO physical parameters at very high–.
References
- Aird et al. (2010) Aird, J., et al. 2010, MNRAS, 401, 2531
- Barger et al. (2005) Barger, A., et al. 2005, AJ, 129, 578
- Begelman (2010) Begelman, M. 2010, MNRAS, 402, 673
- Brandt et al. (2004) Brandt, W.N., et al. 2004, arXiv:0411355
- Brusa et al. (2009) Brusa, M., et al. 2009, ApJ, 693, 8
- Brusa et al. (2010) Brusa, M., et al. 2010, ApJ, 716, 348
- Ebrero et al. (2009) Ebrero, J., et al. 2009, A&A, 493, 55
- Fan et al. (2001) Fan, X., et al. 2001, AJ, 122, 2833
- Fontanot et al. (2007) Fontanot, F., et al. 2007, A&A, 461, 39
- Gilli et al. (2007) Gilli, R., Comastri, A., Hasinger, G. 2007, A&A, 463, 67
- Gilli et al. (2010) Gilli, R., et al. 2010, Proceedings of ”X-ray Astronomy 2009” AIP Conf. Proc. (eds: A. Comastri, M. Cappi, L. Angelini) arXiv:1004.2412
- Green et al. (2009) Green, P., et al. 2009, ApJ, 690, 644
- Hopkins et al. (2006) Hopkins, P.F., et al. 2006, ApJS, 163, 1
- Jiang et al. (2008) Jiang, L., et al. 2008, AJ, 135, 1057
- Jiang et al. (2009) Jiang, L., et al. 2009, AJ, 138, 305
- Jiang et al. (2010) Jiang, L., et al. 2010, Nature, 464, 380
- Kaspi et al. (2000) Kaspi, S., et al. 2000, AJ, 119, 2031
- Lamastra et al. (2010) Lamastra, A., et al. 2010, MNRAS, 405, 29
- Li et al. (2007) Li, Y., et al. 2007, ApJ, 665, 187
- Luo et al. (2010) Luo, B. et al. 2010, ApJS, 187, 560
- Maiolino (2006) Maiolino, R., et al. 2006, arXiv:0306261
- Marulli et al. (2009) Marulli, F., et al. 2009, MNRAS, 396, 1404
- Menci et al. (2008) Menci, N., et al. 2008, ApJ, 686, 219
- Rhook & Haehnelt (2008) Rhook, K. & Haehnelt, M. 2008, MNRAS, 389, 270
- Salvaterra et al. (2007) Salvaterra, R., et al. 2007, MNRAS, 374, 761
- Shemmer et al. (2006) Shemmer, O., et al. 2006, ApJ, 644, 86
- Steffen et al. (2004) Steffen, A., et al. 2004, AJ, 128, 1483
- Vignali et al. (2003) Vignali, C., et al. 2003, AJ, 125, 2876
- Volonteri & Rees (2005) Volonteri, M. & Rees, M. 2005, ApJ, 633, 624
- White et al. (2010) White, N.E., et al. 2010, Proceedings of ”X-ray Astronomy 2009” AIP Conf. Proc. (eds: A. Comastri, M. Cappi, L. Angelini)
- Willott et al. (2003) Willott, C., et al. 2003, ApJ, 587, L15
- Willott et al. (2007) Willott, C., et al. 2007, AJ, 134, 2435
- Willott et al. (2009) Willott, C., et al. 2009, AJ, 137, 3541
- Willott et al. (2010) Willott, C., et al. 2010, AJ, 139, 906
- Yencho et al. (2009) Yencho, B., et al. 2009, ApJ, 698, 380
- Young et al. (2009) Young, M., et al. 2009, ApJS, 183, 17