Investigation of magnetically sensitive FeH lines
Abstract
M-type stars exhibit strong magnetic fields towards decreasing effective temperatures.
The measurement of these fields is complicated due to missing
indicators. Molecular FeH lines provide an excellent means to
determine magnetic field strengths from the Zeeman broadening of
magnetically sensitive lines.
Our aim is the investigation of possible dependencies of the amount of
sensitivity to magnetic fields from rotational quantum number, branch,
and the projection of the total angular momentum onto the internuclear axis
().
We also compare results from computations with those from
observations.
We use high resolution CRIRES spectra of the two M dwarfs GJ1002
(M5.5 inactive) and GJ1224 (M4.5 active). Individual lines are
fitted by Gaussians and the obtained line depths and widths from the
active and inactive star can be compared with each other. In this
way, magnetically sensitive lines can be detected. For test purposes,
we do the same with computed spectra of FeH. One with zero magnetic
field and the other with a kG magnetic field vector used
in the disc integration (i.e. pure radial at the disc center).
We found, in agreement with theory, that lines with high show
strong sensitivity to magnetic fields. No obvious correlation with
branch or was found, which was also expected for lines formed in
intermediate Hund’s case. The computations agreed in general well with
the observations, but in many cases the individual splitting of
certain lines can be very different to observations.
1 Introduction
M-type stars are most numerous in the universe and are also dominating the stellar mass function. Towards later spectral types, they become fully convective and exhibit strong magnetic fields: while only % of M0 dwarfs show Hα emission (which is an indicator for magnetic activity), more than % of the M8 dwarfs show signs of magnetic activity (Reid & Hawley 2005). Measuring these magnetic fields in M-type stars is an interesting, but very challenging task. The well probed atomic indicators are vanishing towards these low temperatures, or become too strongly pressure broadened. A possible solution is the application of molecular FeH lines, which are very numerous and strong around nm. The molecule provides magnetically sensitive and insensitive absorption lines closely side by side, which makes it in principle possible to adjust stellar parameters of synthetic spectra to the insensitive lines and then use the sensitive lines to obtain magnetic field strength. Unfortunately the description of the molecular Zeeman effect for FeH is still insufficient, since most FeH lines behave like they were formed in intermediate Hund’s case (Berdyugina & Solanki 2002; Berdyugina et al. 2003). Recent work was done by Afram et al. (2007, 2008), who determined Landé factors by empirically fitting solar FeH lines. The factors could then be used to compute spectra of FeH including Zeeman splitting. Another way to determine magnetic field strengths was demonstrated by Reiners & Basri (2006, 2007). They compared magnetically sensitive FeH lines from active M dwarfs to those from an inactive template M dwarf.
In this work, we identify magnetically sensitive FeH lines in high resolution CRIRES spectra of the active M4.5 dwarf GJ1224, through comparison with the inactive M5.5 dwarf GJ1002. With the help of the line list from Wende et al. (2010), we assign quantum numbers and investigate the dependence of magnetic sensitivity on rotational quantum number , branch, and (projection of the total angular momentum onto the internuclear axis).
2 Identification of Sensitive Lines
When comparing FeH in a spectrum of an M dwarf with a known strong magnetic field to a spectrum of an M dwarf with only weak magnetic activity and similar spectral type (i.e. effective temperature), one notices that certain lines of the magnetically active star are broader than their counterparts in the inactive star. This could, of course, be due to different rotation velocities, but since only some lines are affected, the broadening must be due to the Zeeman effect which also operates in molecular lines (Berdyugina & Solanki 2002; Berdyugina et al. 2003). Reiners & Basri (2006, 2007) used this effect to determine magnetic field strengths in a sample of M type dwarfs. To make stars with different effective temperatures comparable, they used a scaling procedure which is inspired by scaling optical depth:
| (1) |
In this expression, is the resulting scaled spectrum, the normalized spectrum which will be scaled, the optical depth scaling factor, which is applied to the overall spectral range, and C is a constant controlling the maximum of absorption due to saturation. To determine the magnetic field strength, they linearly interpolate between a zero field template star and one with known magnetic field. The zero field template star is the M dwarf GJ1002 which was already used for the indentification of FeH lines in the z-band (Wende et al. 2010). For GJ1224 (M 4.5 dwarf), they determined a magnetic field strength of kG.
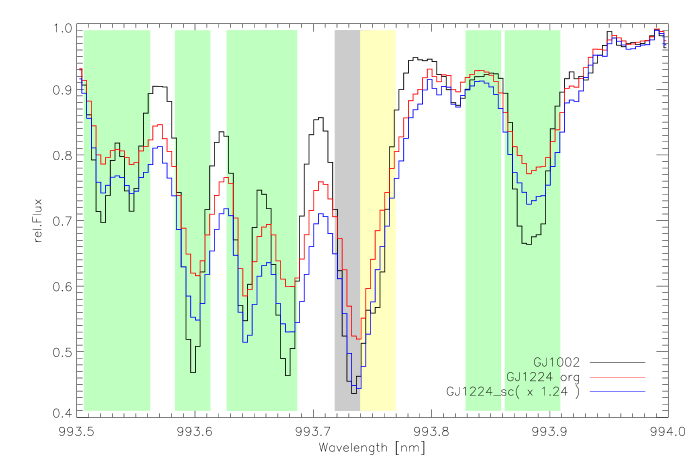
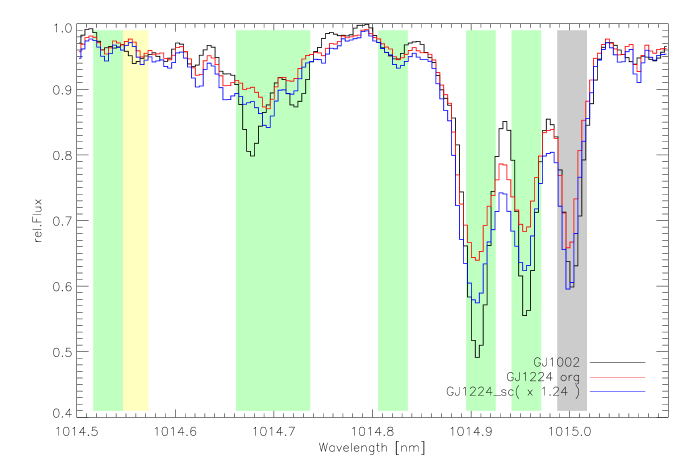
We obtained high-resolution CRIRES111Data for GJ1224 were taken at ESO Telescopes under the program 83.D-0124(A). Data for GJ1002 were taken at ESO Telescopes under the program 79.D-0357(A). spectra for the same stars over the whole z-range and used it to detect more magnetically sensitive FeH lines redwards of m. For this task, we used the optical depth scaling with for GJ1224 and compared it with the spectra of GJ1002 (both have km-1). Two exemplary spectral bins are shown in the upper plots of Figs. 1 and 2. It is obvious that some lines are strongly split and others not at all. The unsplit lines were used to scale GJ1224 to the effective temperature of GJ1002. We will quantify the identification by fitting Gaussian line profiles to the FeH absorption lines and compare line depths and line widths in Sect. 4
3 Theoretical Zeeman Splitting
The theoretical description of the Zeeman effect in FeH molecular lines is still a challenging task, since the Born-Oppenheimer approximation is no longer useful for determining Landé g factors. Also, the rovibronic transitions of FeH are mostly in intermediate Hund’s case, and the description of the Zeeman splitting must also be treated in this intermediate case (Berdyugina & Solanki 2002; Berdyugina et al. 2003). Not all lines can be described in this case, which make an empirical ansatz necessary (Afram et al. 2007, 2008). A semi-analytical description was presented by Shulyak et al. (2010), who found, that the intermediate case is, in general, a good approximation for the following cases:
-
1.
-
2.
and for P and Q branches
-
3.
and for the R branch
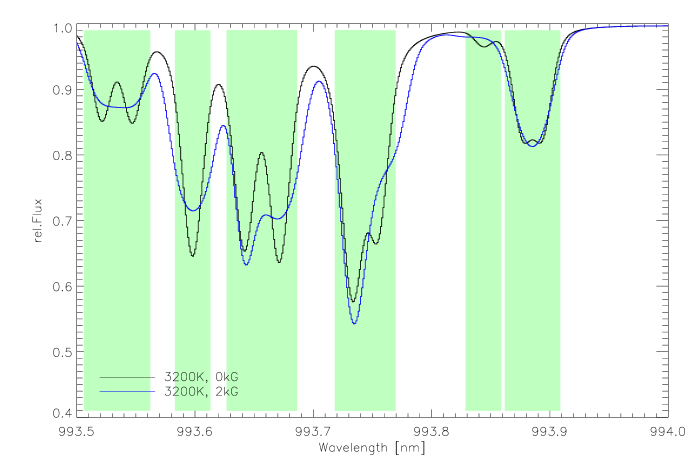
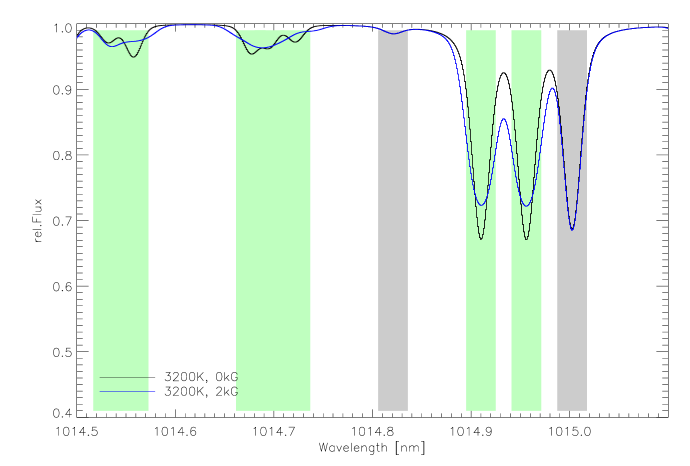
Here, is the ratio of the spin-orbit coupling and rotational constants. For all other cases, a good approximation is the assumption of Hund’s case (a) for the upper level and Hund’s case (b) for the lower level. We follow this description and use a code from Leroy (2004) (modified by D. Shulyak) to determine Landé factors which describe the strength of the splitting. These factors can be used in the SYNMAST code (Kochukhov 2007) to generate spectra including effects from Zeeman splitting. In the bottom plots of Figs. 1 and 2, the two exemplary spectral regions are shown for computed spectra with zero magnetic field and with a kG magnetic field vector (it describes a pure radial magnetic field at the disc center and is pure horizontal at the limb). The observed and computed spectra look similar, but at least for some lines, the computed splitting is very different from the observed ones. These shortcomings could be related to the inadequate theoretical description of the Zeeman splitting as well as to possible more significant horizontal components in the geometry of the magnetic field. The computed spectra also show the possibility, that the line depth could be enhanced due to the split components. That means, that it is necessary to investigate the line width as well as the line depth to detect magnetically sensitive lines.
4 Comparison Between Computations and Observations
In order to quantify the identification of magnetically sensitive
lines, we used a Gaussian fit to the FeH line profiles to measure
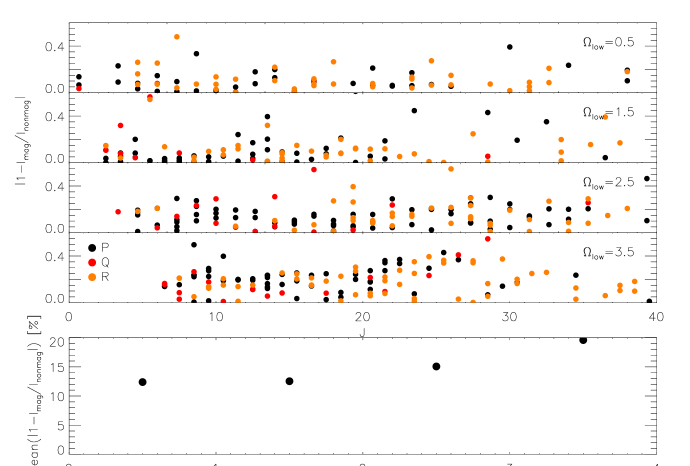
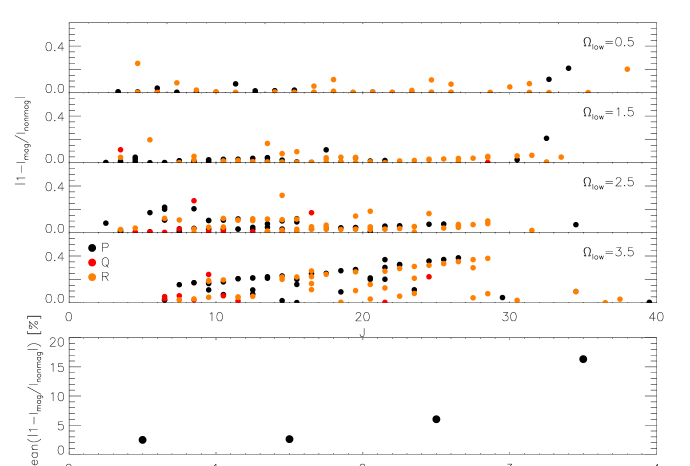
their depths () and widths (). This was done for the magnetically broadened
spectra as well as for the non magnetic ones. The ratio of the
line widths can be used to investigate if a line is
broadened by the magnetic field. The ratio
can be used to characterise the amount of variation in the line depth.
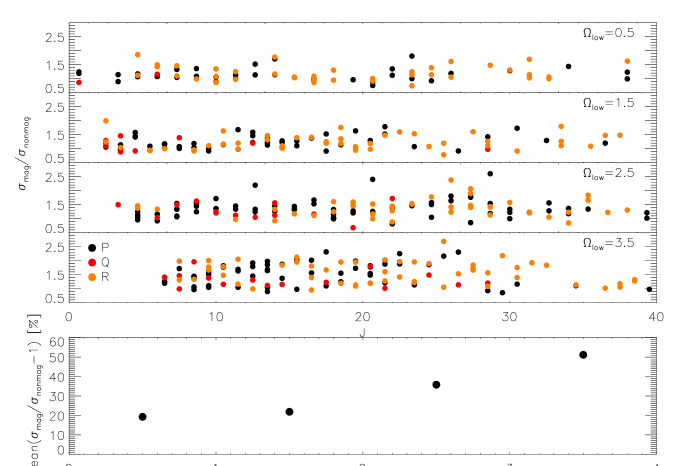
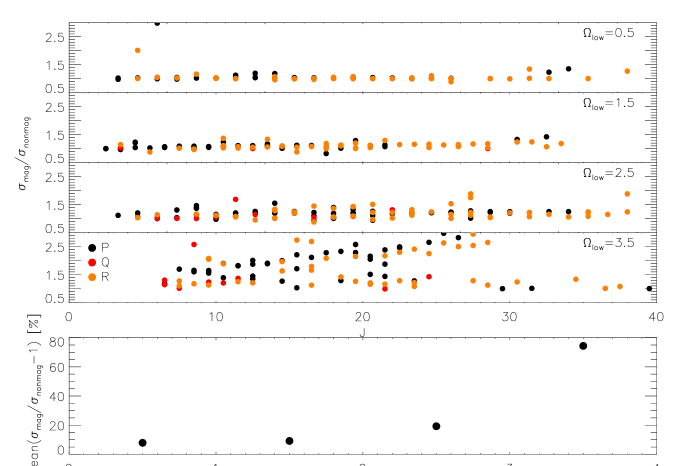
The ratios of line widths are plotted in Fig. 3 and the ratios of line depths are plotted in Figs. 4. The upper plots in these figures
are for the observations and the bottom plots for computations.
The ratios are plotted as a function of rotational
quantum number and are separated by
(starting with at the top and ending at at the
bottom in steps of ) since the Landé factor strongly depends on it
(Berdyugina & Solanki 2002). The Landé factor is also a function of
and different for rotational branches. Due to this, the P, Q, and
R branches are indicated by different colors. One can see that there
is no obvious dependence on , which would be expected if the
splitting were pure Hund’s case (a) or (b).
This investigation was also done for the synthetic spectra and the results are shown
in the bottom plots of Figs. 3 and 4.
The computed spectra
reproduce the general trends of the observations, which could be regarded as a sign
that the ansatz described above is a good approximation.
In these figures, the average ratio
is also shown as a function of : the
magnetic influence is clear visible stronger for lines with high , in
agreement with theory. Again, the results from observations and
computations are very similar and differ only in the absolute
values. This discrepancy could be due to noise in the
observations.
5 Conclusion
We conclude that the potential of FeH lines for measuring magnetic fields is very high. Empirically, it is already possible to use them, but the results depend on well-chosen and accurate template spectra with known parameters. The theoretical approach is promising, but has to be investigated further to describe the Zeeman splitting more correctly.
Acknowledgments
SW acknowledges funding from the GrK 1351 “Extrasolar Planets and
their host stars”.
AR & AS acknowledges research funding from the
DFG (RE 1664/4 -1), and DS also acknowledges funding from the DFG
(RE 1664/7-1).
OK is a Royal Swedish Academy of Sciences Research Fellow supported
by grants from the Knut and Alice Wallenberg Foundation and the
Swedish Research Council.
References
- Afram et al. (2007) Afram, N., Berdyugina, S. V., Fluri, D. M., Semel, M., Bianda, M., & Ramelli, R. 2007, A&A, 473, L1. 0708.0298
- Afram et al. (2008) Afram, N., Berdyugina, S. V., Fluri, D. M., Solanki, S. K., & Lagg, A. 2008, A&A, 482, 387
- Berdyugina & Solanki (2002) Berdyugina, S. V., & Solanki, S. K. 2002, A&A, 385, 701
- Berdyugina et al. (2003) Berdyugina, S. V., Solanki, S. K., & Frutiger, C. 2003, A&A, 412, 513
- Kochukhov (2007) Kochukhov, O. P. 2007, in Physics of Magnetic Stars, 109. arXiv:astro-ph/0701084
- Leroy (2004) Leroy, B. 2004
- Reid & Hawley (2005) Reid, I. N., & Hawley, S. L. 2005, New light on dark stars : red dwarfs, low-mass stars, brown dwarfs
- Reiners & Basri (2006) Reiners, A., & Basri, G. 2006, ApJ, 644, 497. arXiv:astro-ph/0602221
- Reiners & Basri (2007) — 2007, ApJ, 656, 1121. arXiv:astro-ph/0610365
- Shulyak et al. (2010) Shulyak, D., Reiners, A., Wende, S., Kochukhov, O., Piskunov, N., & Seifahrt, A. 2010, A&A, 523, A37+. 1008.2512
- Wende et al. (2010) Wende, S., Reiners, A., Seifahrt, A., & Bernath, P. F. 2010, A&A, 523, A58+. 1007.4116