Low energy, quasi-one-dimensional, spin dynamics in charge-ordered La2-xSrxNiO4
Abstract
The low energy spin excitations of La2-xSrxNiO4, and , have been investigated by unpolarized- and polarized-inelastic neutron scattering from single crystals. A pattern of magnetic diffuse scattering is observed in both compositions, and is consistent with quasi-one-dimensional AFM spin correlations along the charge stripes. Analysis of the energy lineshape for indicates that the diffuse scattering is inelastic with a characteristic energy of meV. There is no discernible difference between the diffuse scattering from and , suggesting that it is an intrinsic property of the charge stripes.
pacs:
75.40.Gb, 71.45.Lr, 75.30.Fv,75.30.EtI Introduction
Striped patterns of spin and charge order have been observed in a wide range of antiferromagnetic oxides since the initial discovery in La1.48Nd0.4Sr0.12CuO4.tranquada-Nature-1995 Interest has been sustained by continuing uncertainty about the true importance of stripe correlations for the mechanism of superconductivity in the layered cuprates. In some models, for example, stripe correlations assist in the formation of pairing instabilities that can lead to superconductivity,mechanism whereas according to experiment static charge stripes suppress superconductivity.tranquada-Nature-1995 . Investigations into the fundamental properties of stripes are therefore potentially important for an understanding of cuprate superconductivity, as well as providing insight into an interesting emergent phase of electronic matter.
Experimental investigations on stripe phases have been made on various materials, but the layered nickelates La2-xSrxNiO4+δ (LSNO) have been a particularly informative model system to study.neutron ; x-ray ; chen93 ; Yamada94 ; pash-PRL-2000 ; Yoshinari-PRL-2000 LSNO, which is isostructural with the “214” high temperature superconductor La2-xSrxCuO4+δ, exhibits spin and charge stripe order for .yoshizawa-PRB-2000 ; hatton-2002 The stripes form on the square NiO2 layers and consist of diagonal bands of antiferromagnetically (AFM) ordered Ni2+ spins separated by charged domain walls that act as antiphase boundaries to the magnetic order. At one-third doping (e.g. ) the stripe order is particularly stable owing to a combination of two factors, firstly a commensurability effect that pins the charge stripes to the lattice, and second a stripe periodicity which is the same for the magnetic and a charge order.ramirez-PRL-1996 ; yoshizawa-PRB-2000 ; kajimoto-PRB-2001 At this doping level LSNO displays long range ( Å) charge order,yoshizawa-PRB-2000 ; hatton-2002 making it an ideal material in which to probe the charge ordered state.
The magnetic excitation spectrum in the ordered stripe phase of LSNO with has been investigated in some detail by neutron inelastic scattering and found to contain two distinct components, (i) quasi-two-dimensional spin-wave excitations of the AFM-ordered regions, extending to 80 meV in energy,boothroyd-PRB-2003 ; bourges-PRL-2003 ; boothroyd-PhysicaB ; Woo and (ii) a low energy ( meV) quasi-one-dimensional (q-1D) magnetic fluctuation consistent with short-range AFM correlations along the charge stripes.boothroyd-PRL-2003 A two-component spectrum with qualitatively similar characteristics has also been observed in La3/2Sr1/2NiO4. (Ref. freeman-PRB-2005, ) The observation of two types of magnetic dynamics is consistent with the existence two magnetic sub-systems associated with nominally Ni2+ and Ni3+ ions, the latter of which form the charge stripes. At this time, however, there is no microscopic model of the magnetic interactions in LSNO that provides a unified description of the complete magnetic spectrum.
The aim of the present study was to work towards a better understanding of the low-energy q-1D magnetic correlations by comparing neutron scattering data from two doping levels, and (both with ), and by examining in more detail the energy lineshape of the magnetic scattering. We have found that the q-1D scattering is present at both doping levels, and our analysis of the energy lineshape reveals that the signal is gapped at the minimum of the q-1D dispersion.
II Experimental Details
Single crystals of La2-xSrxNiO4 were grown by the floating-zone method.Prabhakaran-JCG-2002 The crystals were in the form of rods with typical dimensions 7–8 mm in diameter and 40 mm in length (mass g).
Neutron scattering measurements were performed on crystals with and on the triple-axis spectrometers (TAS) IN8, IN20 and IN14 at the Institut Laue-Langevin, and on RITA-II at SINQ, Paul Scherrer Institut. The energies of the incident and scattered neutrons were selected by Bragg reflection from crystal arrays of pyrolytic graphite (PG) crystals (IN8, IN14, RITA-II), physically bent Si crystals (IN8) or Heusler arrays (IN20). The monochromators were vertically focused (IN8, IN14) and horizontally focused (IN8, IN20, RITA-II) to maximise neutron flux on the sample position. The analyzers were horizontal focused on all instruments and vertically focused on IN8. Data were collected with fixed final neutron wavevectors of 2.662 Å-1 (IN8, IN20), 1.5 Å-1 (IN14, RITA-II) and 1.2 Å-1 (IN14). A pyrolytic graphite filter (IN8, IN20) or Be/BeO filter operating at 77 K (IN14, RITA-II) was placed between the sample and analyzer to suppress higher-order harmonic scattering. On IN20 polarized neutrons were employed, and the neutron spin polarization was maintained in a specified orientation with respect to the neutron scattering vector by an adjustable guide field of a few mT at the sample position. A monitor is placed between the monochromator and sample position to determine the number of neutrons incident on the sample position. The monitor count has an energy dependent contamination due to higher order neutrons in the incident beam, which we have corrected for when integrated intensities are shown. The crystals we aligned so that the horizontal scattering plane was for and for (we refer here to the tetragonal unit cell of the space group with unit cell parameters Å and Å). The particular crystals used in the TAS measurements were grown at Oxford University and have been used in previous neutron scattering studies described elsewhere.boothroyd-PRB-2003 ; Woo ; freeman-PRB-2004 ; boothroyd-PhysicaB
To supplement the TAS measurements we will also present some data on the composition collected on the MAPS time-of-flight spectrometer at the ISIS spallation neutron source. A report on the findings of this study at higher energy transfers, can be found elsewhere.Woo The sample used on MAPS was an array of four crystals grown at Kyoto University and co-aligned by X-ray diffraction to within about . Crystals with from the same source have been used in neutron diffraction studies of magnetic and charge order.lee-PRB-2001 The sample was mounted on MAPS in a closed-cycle refrigerator and aligned with the axis parallel to the incident beam direction. A Fermi chopper was used to select the incident neutron energy of 60 meV. The intensity was normalized and converted to units of scattering cross-section (mb sr-1 meV-1 [f.u.]-1) by comparison with measurements from a standard vanadium sample. Scattered neutrons were recorded in large banks of position-sensitive detectors. The spin dispersion in La2-xSrxNiO4 is highly two-dimensional,Woo and so we project the data onto the two-dimensional reciprocal lattice plane. The elastic energy resolution on MAPS was 2.7 meV (full-width at half-maximum).
III Results
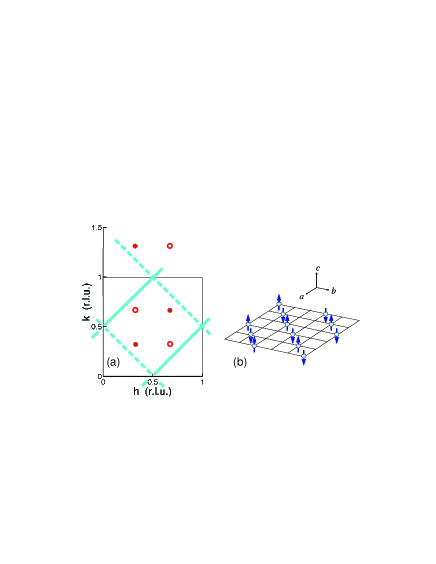
To help visualise the experimental measurements we reproduce in Fig. 1 part of a figure from our previous publication on the q-1D magnetic fluctuations in La5/3Sr1/3NiO4 (Ref. boothroyd-PRL-2003, ). Figure 1(a) is a simplified map of the low-energy scattering features in the plane of reciprocal space. The sharp peaks (circles) at and represent spin-wave scattering associated with the magnetic ordering wavevectors. There are two pairs of peaks because there are two possible orientations of the stripes on the NiO2 layers, either along the direction or the direction. The diagonal lines which run parallel to the stripe directions represent the approximate pattern of diffuse scattering observed in La5/3Sr1/3NiO4, Ref. boothroyd-PRL-2003, . Figure 1(b) depicts an array of AFM chains running parallel to the stripes which would give rise to the diagonal grid of diffuse scattering shown in Fig. 1(a). In reality, the the line of the observed diffuse scattering is not exactly straight but meanders slightly so as to follow approximately the magnetic zone boundaries, suggesting that the fluctuations on adjacent chains are weakly correlated. The spins are shown pointing upwards to reflect the observation that the strength of the out-of-plane fluctuations is about twice the strength of the in-plane fluctuations.boothroyd-PRL-2003 The diffuse scattering has a strong dynamic component on a THz frequency scale, and may even be entirely dynamic. Whether the q-1D scattering is quasielastic or inelastic (i.e. gapped) is an open question which will be addressed later in this work.
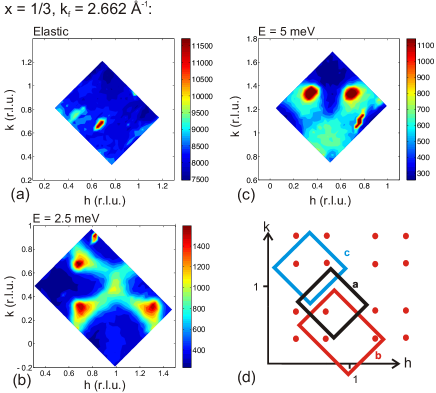
Figure 2 presents maps of the magnetic scattering intensity measured in the plane of the crystal at a temperature of 2 K. The maps were collected at three fixed energies, (a) 0 meV (i.e. elastic scattering within the resolution of the spectrometer), (b) 2.5 meV, and (c) 5 meV. The 2.5 meV data is reproduced from Ref. boothroyd-PRL-2003, . Figure 2(d) shows the areas covered in the three maps, which are not the same.
In the elastic map, Fig. 2(a), there is a magnetic Bragg reflection at due to the pattern of AFM order between the charge stripes, and a small spurious peak at . No diffuse elastic scattering signal can be observed within the experimental precision. Comparing the two inelastic maps, Figs. 2(b) and 2(c), one can see that the q-1D diffuse scattering is broader at meV than at at meV. This is consistent with our previous measurementsboothroyd-PRL-2003 which showed that the q-1D scattering disperses in the direction perpendicular to the scattering ridge, with a bandwidth of about 10 meV. The intensity of the q-1D scattering is modulated, with maxima adjacent to the spin-wave scattering from the AFM order and at the positions where the diffuse ridges meet, i.e. and equivalent positions.
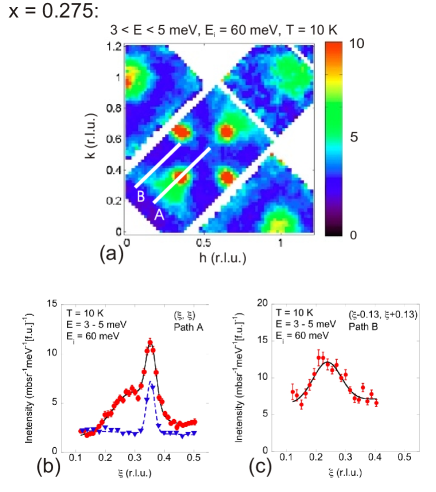
We now turn to the LSNO crystal with . At this composition the charge stripe order is incommensurate with the crystal lattice and it of interest to see whether this has any effect on the q-1D magnetic fluctuations. Figure 3(a) shows the distribution of scattering intensity from LSNO () measured on MAPS. The scattering has been averaged over the energy range 3–5 meV and plotted as a function of the in-plane components of reciprocal space. There are four strong scattering signals at positions and with , from the steeply dispersing spin-wave excitations of the AFM order. In Fig 3(a) the spin wave excitations from the AFM order are too low in energy to be resolved into spin wave cones, and appear simply as spots. In addition to these, there can also be seen ridges of diffuse scattering similar to the q-1D scattering observed from the crystal [Fig. 2(b,c)]. Figures 3(b) and 3(c) show cuts through this data along the paths marked A and B in Fig. 3(a). Path B is chosen so that no intensity from the excitations of the ordered AFM is observed in a scan along path B. The location for path B is determined experimentally, by performing scans perpendicular to path A through the excitations from the AFM order. The cut in Fig. 3(b) along path A shows the diffuse scattering as a shoulder to the sharper spin-wave peak, whereas the cut shown in Fig. 3(c) along path B shows just the diffuse scattering peak, which is centred on [the coordinate measures the position along the scan projected perpendicularly onto line A, i.e. such that projects onto and projects onto ]. From these and similar cuts we find that the diffuse scattering at follows the same slightly-meandering path as does the diffuse scattering at — see Figs. 2(b) and 2(c). In Fig. 3(b) we also display the elastic scattering intensity along path A. This shows the magnetic Bragg peak from the AFM order but does not contain any elastic signal corresponding to the position of the diffuse inelastic signal.
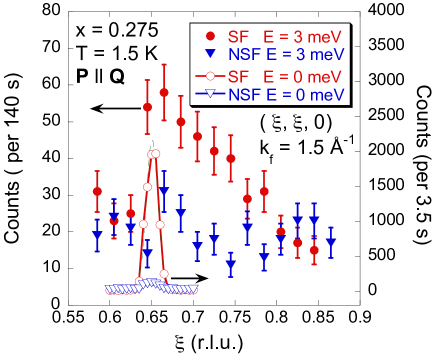
To confirm that the diffuse scattering signal is magnetic in origin we performed scattering measurements on IN20 employing neutron polarization analysis. For these measurements we constrained the neutron polarization to be parallel to the scattering vector . In this configuration scattering from electronic magnetic moments causes the neutron spin to flip, whereas scattering via non-magnetic processes does not.
Figure 4 displays the neutron spin-flip (SF) and non-spin-flip (NSF) scattering from the crystal along a line equivalent to path A. Plots of elastic scattering data and inelastic scattering data with meV are shown. The elastic scan contains a strong peak in the SF channel centred on , the AFM ordering wavevector for this composition. A small peak in the NSF channel at the same position is due to imperfect spin polarization, which has not been corrected for. At meV there is a broad peak centred on in the SF channel but not in the NSF channel. Due to their very steep dispersion, the spin-wave scattering from the AFM order only accounts for the delta-shaped left-side of the SF peak.Woo The remaining extent of the SF peak can be accounted for by the inelastic diffuse scattering.
The results of the unpolarized and polarized neutron scattering measurements presented here for are qualitatively very similar to our previous measurementsboothroyd-PRL-2003 on . This shows that the q-1D diffuse scattering is magnetic in origin and has the same character in both the and samples.
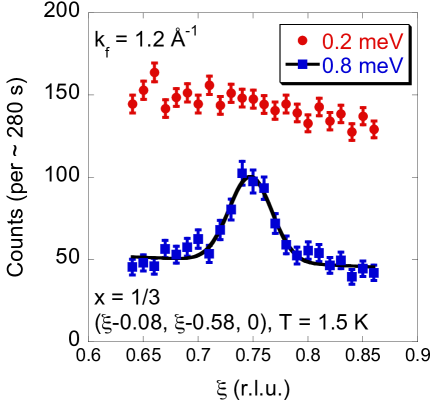
Next we turn to the question of whether the q-1D scattering is gapped or not. To answer this we performed inelastic neutron scattering measurements on IN14 on the crystal at energies meV. Figure 5 shows constant-energy scans at 0.2 meV and 0.8 meV along a direction equivalent to path B of Fig. 1(a). The scan at 0.8 meV reveals a peak centred on from the q-1D fluctuation, whereas the scan at 0.2 meV shows no peak at within the statistical precision of the data. The peak widths of both the q-1D diffuse scattering at 0.8 meV and the spin-wave scattering at 0.6 meV (not shown) are resolution-limitedrestrax .
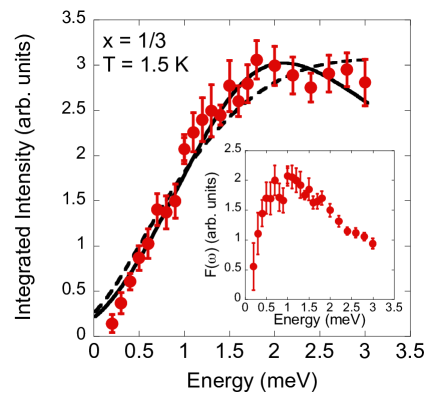
By performing a series of constant-energy scans like those of Fig. 5 and fitting these with gaussian peaks we determined the integrated intensity of the spin-wave and q-1D diffuse scattering peaks as a function of energy. We remind the reader that in scans along path B only the q-1D excitations are observed, while in scans along path A the excitations from the AFM order are clearly resolved from the q-1D.boothroyd-PRL-2003 Below 3 meV we observed no energy variation of the integrated intensity of the spin excitations from the AFM order along path A(not shown), placing an upper limit of 0.3 meV on the in-plane anisotropy gap. In figure 6 the energy variation of the integrated intensity of the diffuse scattering peak in is plotted. With increasing energy transfer the integrated intensity of the diffuse scattering increases monotonically up to meV, then remains almost constant up to 3 meV, the highest energy measured.
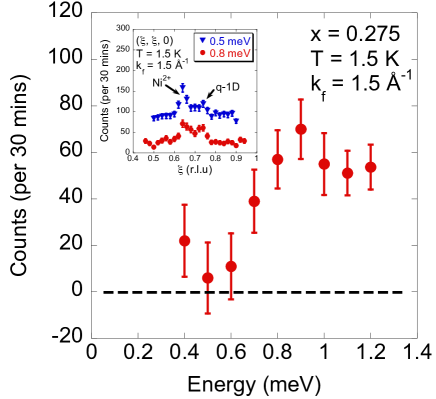
In a separate experiment we investigated the q-1D diffuse scattering from the sample, performed on the RITA-II spectrometer. In the inset of Figure 7 we show constant-energy scans at 0.8 meV and 0.5 meV along a direction equivalent to path A. For meV the q-1D scattering is clearly observed and centred on . At meV there is still a small excess of scattering above the background at . The centring is consistent with the meandering of the q-1D observed in Fig. 2, and the energy dependence is consistent with our observations of the q-1D in the sample, see Fig.5 and Fig.6. Figure 7 shows a constant- scan at of the background-corrected amplitude of the q-1D in the , off-centred to avoid the excitations from the AFM order. The background was estimated from measurements at nearby wavevectors. With decreasing energy transfer the signal remains roughly constant down to 0.8 meV, then drops to a level close to zero at around 0.5 meV. Within the limitations of low counting statistics, this is consistent with the costant energy scans on the , and our observations of the q-1D in the sample, see Fig.6.
IV Discussion
This work has been concerned with the nature of the low-energy q-1D diffuse scattering in La2-xSrxNiO4 first found for (Ref. boothroyd-PRL-2003, ). We have shown here that the diffuse scattering is also present at , and that it is the same for as for to within the experimental precision. This implies that the q-1D scattering is not dependent on the periodicity of the spin-charge stripe order, and neither is it a consequence of the special circumstance found at in which the spin and charge order have the same periodicity and are commensurate with the crystal lattice. Instead, the diffuse scattering appears to be an intrinsic property of individual charge stripes embedded in the AFM matrix formed by the Ni2+ spins, consistent with the interpretation in terms of q-1D correlations among spins in the charge stripes.boothroyd-PRL-2003
In this work we have also carefully measured the low-energy lineshape of the q-1D diffuse scattering. To model the lineshape we recall that the dynamical part of the scattering is proportional to the linear response function
| (1) |
where is the energy transferred to the system, is the imaginary part of the dynamical susceptibility, and
| (2) |
To describe the Q-integrated intensities we used the phenomenological Lorentzian lineshape constructed to satisfy Detailed Balance,
| (3) |
where is the Lorentzian width (half-width at half-maximum) and is the energy of the undamped mode. As the q-1D has a large intrinsic energy width, is the characteristic energy for the q-1D, not a gap energy.
The best fit to the data achieved by this lineshape is shown as the solid line in Fig. 6, and gives an energy meV and meV. The fact that the fitted is non-zero provides a clear indication that the q-1D diffuse scattering is inelastic rather than quasielastic. To assess how robust this result is we repeated the fit with fixed at zero, corresponding to a quasielastic lineshape. The best fit thus obtained is shown with a broken line in Fig. 6. The width of the quasielastic fit was meV. The fit to the inelastic lineshape has a goodness-of-fit parameter = 1.19 compared with a = 2.25 for the quasielastic lineshape. On the strength of this evidence we conclude that q-1D diffuse scattering corresponds to a gapped inelastic excitation.
For an alternative representation of the inelastic lineshape we show in the inset to Fig. 6 the spectral weight function , which is related to the imaginary part of the dynamical susceptibility by . The large energy width of the excitations indicates that the q-1D excitations are relatively short-lived, s.
In our original work on the q-1D spin correlations in LSNO with we analyzed the magnetic spectrum with respect to that of an antiferromagnetic spin chain.boothroyd-PRL-2003 Assuming the doped holes reside in localized Ni3+ states with low-spin this implies that the fundamental excitations are spinons with a gapless dispersion. In the present study, however, we have presented evidence that the spectrum has a gap of 1.4 meV. Further thought is needed, therefore, if we are to reconcile this information with our understanding of the q-1D magnetic diffuse scattering.
The model of an AFM spin chain to describe the spin correlations along the Ni3+ charge stripes is reasonable providing the coupling between the spin chain and the AFM order of the Ni2+ spins can be neglected. The justification for neglect of this coupling is that the net Heisenberg exchange acting on the Ni3+ sites from the AFM-ordered Ni2+ spins cancels at the mean-field level, so the coupling between the spin chain and the AFM order is frustrated. However, if the individual Ni3+–Ni2+ exchange interactions are strong enough then a weak ferromagnetic (FM) order could be induced on the Ni3+ stripes combined with a canting of the AFM order of the Ni2+ spins. Such a possibility has been proposed by Klingeler et al. based on magnetization data.Klingeler-PRB-2005 Weak FM order would be difficult to detect in diffraction experiments because the associated magnetic Bragg peaks would coincide with the Bragg peaks from the crystal lattice. Nevertheless, the competition between induced FM order and AFM correlations from an effective AFM exchange along the stripes could provide an explanation for the observed gapped dispersion. Such a model has been investigated recently with promising results.long
V Conclusion
This work has revealed that gapped, quasi-1D AFM spin correlations
are an intrinsic property of the charge-stripes in
La2-xSrxNiO4. The findings should inform theoretical
models for the magnetic interactions in LSNO, and hence contribute
to a broader understanding of the formation and stability of
spin–charge stripes in LSNO and related systems.
VI Acknowledgments
The authors would like to acknowledge the help of H. J. Woo in the MAPS experiment. This work was performed in part at the Swiss Spallation Neutron Source SINQ, at the Paul Scherrer Institute (PSI), Villigen, Switzerland. We are grateful for support from the Engineering and Physical Sciences Research Council of Great Britain, the European Commission under the 7th Framework Programme through the ‘Research Infrastructures’ action of the ‘Capacities’ Programme, Contract No: CP-CSA INFRA-2008-1.1.1 Number 226507-NMI3, and the support of a Grant-in-Aid for Scientific Research (No. 22244039) from the MEXT, Japan.
References
- (1) J. M. Tranquada, B. J. Sternleib, J. D. Axe, Y. Nakamura and S. Uchida, Nature (London) 375, 561 (1995).
- (2) H. J. Schulz, J. Phys. France 50, 2833 (1989); H. J. Schulz, Phys. Rev. Lett. 64, 1445 (1990); D. Poilblanc, and T. M. Rice , Phys. Rev. B 39, 9749 (1989); J. Zaanen, and O. Gunnarsson, Phys. Rev. B 40, 7391 (1989); V. J. Emery, and S. A. Kivelson, Physica C 209, 597 (1993); H. Johannesson and G. I. Japaridze Phys. Rev. B 68, 214507 (2003).
- (3) S. M. Hayden, G. H. Lander, J. Zarestky, P. J. Brown, C. Stassis, P. Metcalf, and J. M. Honig, Phys. Rev. Lett. 68, 1061 (1992); V. Sachan, D. J. Buttrey, J. M. Tranquada, J. E. Lorenzo, and G. Shirane, Phys. Rev. B 51, 12742 (1995); J. M. Tranquada, D. J. Buttrey, and V. Sachan, Phys. Rev. B 54, 12318 (1996);
- (4) E. D. Isaacs, G. Aeppli, P. Zschack, S-W. Cheong, H. Williams, and D. J. Buttrey, Phys. Rev. Lett. 72, 3421 (1994); A. Vigliante, M. von Zimmermann, J. R. Schneider, T. Frello, N. H. Andersen, J. Madsen, D. J. Buttrey, Doon Gibbs and J. M. Tranquada, Phys. Rev. B 56, 8248 (1997).
- (5) C. H. Chen, S-W. Cheong, and A. S. Cooper, Phys. Rev. Lett. 71, 2461 (1993).
- (6) K. Yamada, T. Omata, K. Nakajima, Y. Endoh, and S. Hosoya, Physica C 221, 355 (1994).
- (7) Yu. G. Pashkevich, V. A. Blinkin, V. P. Gnezdilov, V. V. Tsapenko, V. V. Eremenko, P. Lemmens, M. Fischer, M. Grove, G. Güntherodt, L. Degiorgi, P. Wachter, J. M. Tranquada, and D. J. Buttrey, Phys. Rev. Lett. 84, 3919 (2000).
- (8) Y. Yoshinari, P. C. Hammel, and S.-W. Cheong, Phys. Rev. Lett. 82, 3536 (1999).
- (9) H. Yoshizawa, T. Kakeshita, R. Kajimoto, T.Tanabe, T. Katsufuji and Y. Tokura, Phys. Rev. B 61, R854 (2000); H. Yoshizawa, T. Kakeshita, R. Kajimoto, T. Tanabe, T. Katsufuji and Y. Tokura, Physica B 241-243, 880 (1998).
- (10) P. D. Hatton, M. E. Ghazi, S. B. Wilkins, P. D. Spencer, D. Mannix , T. d’Almeida, D. Prabhakaran , A. T. Boothroyd, S.-W. Cheong, Physica B 318, 289 (2002).
- (11) A. P. Ramirez, P. L. Gammel, S-W. Cheong, D. J. Bishop, and P. Chandra, Phys. Rev. Lett. 76, 447 (1996).
- (12) R. Kajimoto, T. Kakeshita, H. Yoshizawa, T. Tanabe, T. Katsufuji, and Y. Tokura, Phys. Rev. B 64, 144432 (2001).
- (13) A. T. Boothroyd, D. Prabhakaran, P. G. Freeman, S. J. S. Lister, M. Enderle, A. Hiess, and J. Kulda, Phys. Rev. B 67, 100407(R) (2003).
- (14) P. Bourges, Y. Sidis, M. Braden, K. Nakajima, and J. M. Tranquada Phys. Rev. Lett. 90 147202 (2003).
- (15) H. Woo, A. T. Boothroyd, K. Nakajima, T.G. Perring, C. D. Frost, P. G. Freeman, D. Prabhakaran, K. Yamada and J. M. Tranquada, Phys. Rev. B 72, 064437 (2005).
- (16) A. T. Boothroyd, P. G. Freeman, D. Prabhakaran, M. Enderle, and J. Kulda, Physica B 345, 1-5 (2004).
- (17) A. T. Boothroyd, P. G. Freeman, D. Prabhakaran, A. Hiess, M. Enderle, J. Kulda, and F. Altorfer, Phys. Rev. Lett. 91, 257201 (2003).
- (18) P. G. Freeman, A. T. Boothroyd, D. Prabhakaran, C. D. Frost, M. Enderle, and A. Heiss, Phys. Rev. B 71, 174412 (2005).
- (19) D. Prabhakaran, P. Isla, and A. T. Boothroyd, J. Cryst. Growth 237-239, 815 (2002).
- (20) S-H. Lee, S.-W. Cheong, K. Yamada, and C. F. Majkrzak, Phys. Rev. B 63, 060405R (2001).
- (21) P. G. Freeman, A. T. Boothroyd, D. Prabhakaran, M. Enderle, and C. Niedermayer, Phys. Rev. B 70, 024413 (2004); P. G. Freeman, N. B. Christensen, D. Prabhakaran and A. T. Boothroyd J. Phys.: Conf. Ser. 200, 012037 (2010).
- (22) The resolution functions for IN14 were calculated using the RESTRAX programSaroun-PhysicaB-1997 . For Å-1 the resolution ellipsoid was typically of dimensions 0.06 meV in energy and 0.025 Å-1 parallel and perpendicular to the scan directions. For Å-1 the resolution ellipsoid was typically of dimensions 0.14 meV in energy, and 0.025 Å-1 and 0.035 Å-1 parallel and perpendicular to the scan direction, respectively.
- (23) J. Šaroun, J. Kulda, Physica B 234-236, 1102 (1997) .
- (24) R. Klingeler, B. Büchner, S.-W. Cheong, and M. Hücker, Phys. Rev. B 72, 104424 (2005).
- (25) M. W. Long and M. Hopper, unpublished.