First Spectroscopic Imaging Observations of the Sun at Low Radio Frequencies with the Murchison Widefield Array Prototype
Abstract
We present the first spectroscopic images of solar radio transients from the prototype for the Murchison Widefield Array (MWA), observed on 2010 March 27. Our observations span the instantaneous frequency band 170.9–201.6 MHz. Though our observing period is characterized as a period of ‘low’ to ‘medium’ activity, one broadband emission feature and numerous short-lived, narrowband, non-thermal emission features are evident. Our data represent a significant advance in low radio frequency solar imaging, enabling us to follow the spatial, spectral, and temporal evolution of events simultaneously and in unprecedented detail. The rich variety of features seen here reaffirms the coronal diagnostic capability of low radio frequency emission and provides an early glimpse of the nature of radio observations that will become available as the next generation of low frequency radio interferometers come on-line over the next few years.
1 Introduction
Low radio frequency ( MHz) emission provides powerful diagnostics of the solar corona. However, high fidelity solar imaging at low frequencies is challenging. Coronal emission features are complex and dynamic, evolving rapidly in space, time, and frequency. Consequently, the limited instantaneous spatial and frequency coverage provided by current radio interferometers have been inadequate to simultaneously resolve transient solar phenomena spatially, temporally, and spectrally.
This situation should change dramatically in the next few years as a new generation of low-frequency radio arrays becomes available, leveraging recent advances in digital signal processing hardware and computational capacity. The Murchison Widefield Array (MWA) (Lonsdale et al., 2009) will be one such array, with most of its 512 elements spread over 1.5 km and a few outliers out to 3 km. The resulting dense instantaneous monochromatic coverage will provide a radio imaging capability with unprecedented fidelity and flexibility. The MWA is currently under construction at the Murchison Radioastronomy Observatory, in the remote and radio-quiet Western Australian outback, and a prototype system comprising 32 interferometer elements (tiles) is operational on site. This system, hereafter referred to as the “32T”, serves as an engineering testbed and provides early science opportunities, in advance of the full MWA. We present here solar imaging observations obtained with the 32T. The quiescent solar emission in the MWA frequency range of 80–300 MHz is dominated by coronal emission from heights of 1–10 R⊙ above the photosphere. These are among the first high-fidelity, high dynamic-range, spectroscopic images of the Sun with a good temporal and spectral resolution at meter wavelengths.
2 Data
The 32T tiles are arranged along the arms of a randomized Reuleaux triangle (see Cohanim et al. 2004), providing a fairly uniformly sampled plane with baseline lengths up to 350 m (Fig. 1).

For solar observations, the correlated flux is dominated by the Sun, reducing the effective field-of-view (FoV) to 1∘, for which the uv sampling provided by the 32T exceeds the Nyquist criterion111, where is length scale in the uv plane beyond which visibilities are no longer correlated, and is the size of the FoV in radians. This, together with a high signal-to-noise ratio, permits robust, high fidelity imaging (Bracewell & Roberts, 1954).
In its usual interferometric mode of operation, the 32T provides auto- and cross-correlations (visibilities) for all 64 input signals (32 tiles2 linear polarizations). The entire RF band is directly sampled and filtered into 1.28 MHz wide coarse channels. Twenty four of these coarse channels are further processed by the correlator, which can currently provide a time resolution of 50 ms with a 50% duty cycle over a 30.72 MHz band and a spectral resolution of 40 kHz. The 32T design closely follows the MWA architecture described in Lonsdale et al. (2009).
The data presented here were obtained on 2010 March 27 from 04:24:53 to 04:34:03 UT and span the range 170.8–201.6 MHz. They were smoothed to a time resolution of 1 second before further processing. Data editing, calibration, and imaging were performed using the Astronomical Image Processing System. Self-calibration, to solve for frequency independent complex gains, was performed individually for each of the coarse channels using a 10-second interval where the Sun was in a relatively quiescent state. These gain solutions were then applied to the full time interval. No absolute flux calibration was possible, owing to the lack of observations of a suitable calibrator. The amplitude part of the bandpass was calibrated using the total power spectra from the same quiescent time interval as used for self-calibration. As will become evident later, the choice of a spectral index only impacts the underlying spectral slope. We assumed a spectral index =2.6 for the quiet Sun ( where is the flux density and is the observing frequency); this choice is based on 32T observations during the recent deep solar minimum (2008 November), which yielded 0.4, a value consistent with Erickson et al. (1977). All the data presented here correspond to the east-west (XX) polarization. The wide FoV MWA tiles are expected to have significant (but stable) cross-polarization leakage, and an absolute polarization calibration was not attempted.
Imaging and deconvolution were performed using the standard CLEAN algorithm with robust (=0) weighting, resulting in a synthesized beam at the band center of (FWHM). For the images presented here, the data were averaged over a single coarse channel during the gridding process and restored with a circular beam with FWHM . The edges of the coarse channels could not be calibrated satisfactorily, hence the first six and the last four spectral channels of each coarse channel were flagged during imaging.
3 Analysis and Results
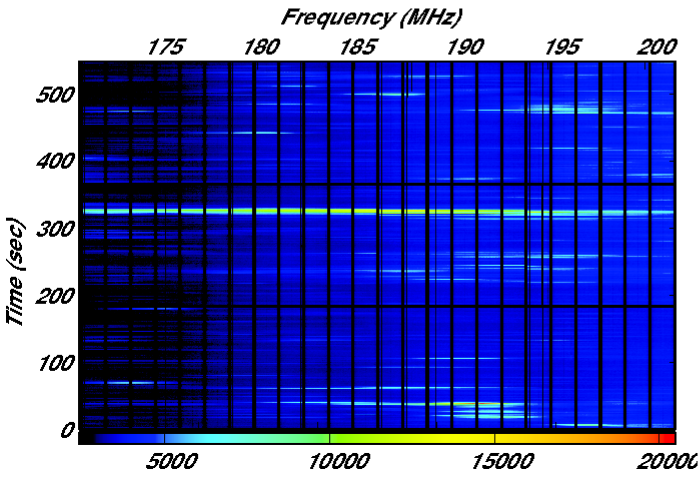
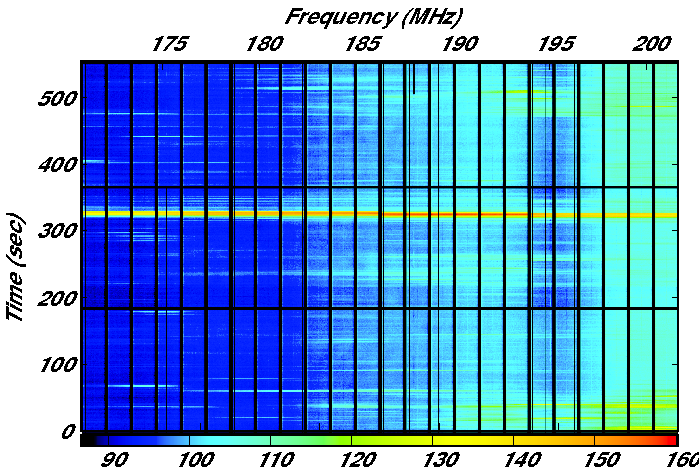
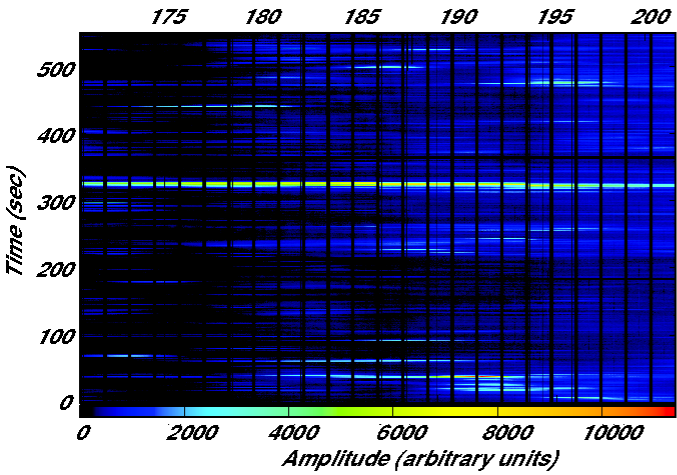
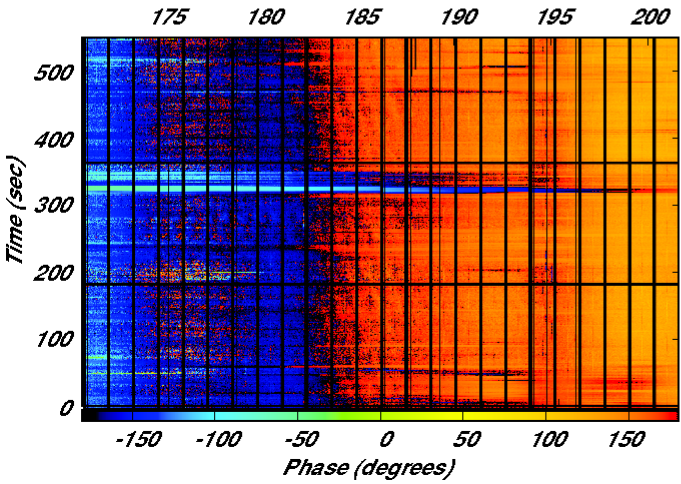
Amplitudes and phases observed on a representative short (64 m) and long (315 m) projected baseline are shown in Fig. 2. Baselines of different lengths and orientations measure independent Fourier components of the source structure. The examples shown here illustrate several key features of the data. Only one polarization is shown as both polarizations show very similar behavior. The most prominent feature in Fig. 2, visually obvious on all baselines in both amplitude and phase, spans the entire observing band around 04:30:10 UT. We hereafter refer to this as the “broadband” feature. Its properties are similar to a weak type III burst (Sec. 4). In addition, a large number of shorter-lived, narrowband features are evident in the visibility amplitudes. Many of these amplitude variations are accompanied by corresponding variations in phase, implying a change in the brightness temperature () distribution in the corona. These features become more numerous and prominent visually with increasing baseline length and are referred to as “narrowband” features hereafter. A dearth of truly “quiescent” periods is also evident, and the ubiquitous modest variations seen in the spectral structure are solar, not instrumental, in origin.
To further illustrate the diversity in the types of emission seen in the short span of data presented here, as well as its spectrally complex and highly time-variable behavior, Fig. 3 shows several series of autocorrelation (total power) spectra.
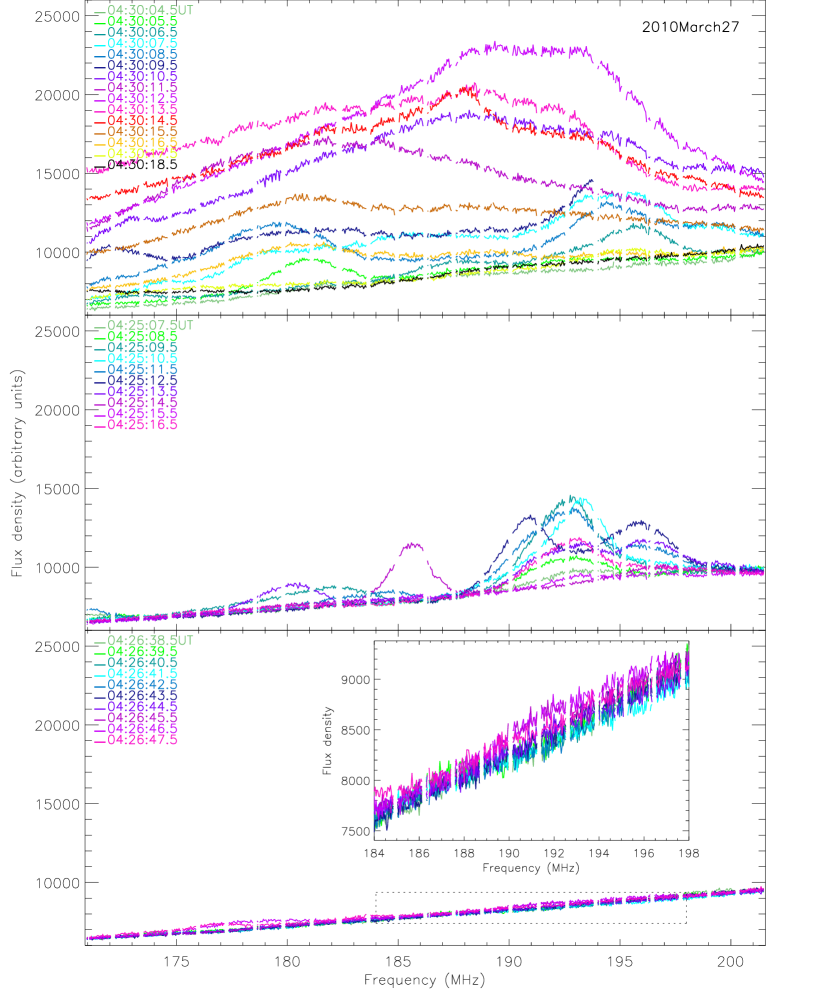
The bottom panel shows one of the few quiescent intervals; the baseline spectral slope seen here is due to the spectral index of the quiet Sun, dominated by thermal emission. An amplitude variation of 5% over a 10 s interval is seen even in “featureless” parts of the data. The middle panel shows a series of spectra illustrating one of the numerous “narrowband” features seen in Fig. 2. These features show remarkably rapid evolution in spectral shape and intensity. They typically span 5–10 MHz in bandwidth, outside of which the spectral flux density returns to that of the quiet Sun. Their peak flux density approaches 1.5 times the quiescent solar flux density at that frequency. Finally, the top panel of Fig. 3 shows the dynamic behavior of the “broadband” feature around 04:30:10 UT. Its bandwidth exceeds the 30 MHz observing bandwidth, and at its peak, its flux density is 2.5 times the quiescent solar flux density. The abrupt changes from one second to the next imply that the physical changes leading to the production of this emission are temporally undersampled.
The data presented here permit a high fidelity image of the Sun for every individual time and frequency slice (i.e. every pixel on the dynamic spectra shown in Fig. 2). Fig. 4 shows a collage of images that illustrates the rapid evolution of the appearance of the solar corona during our observations.
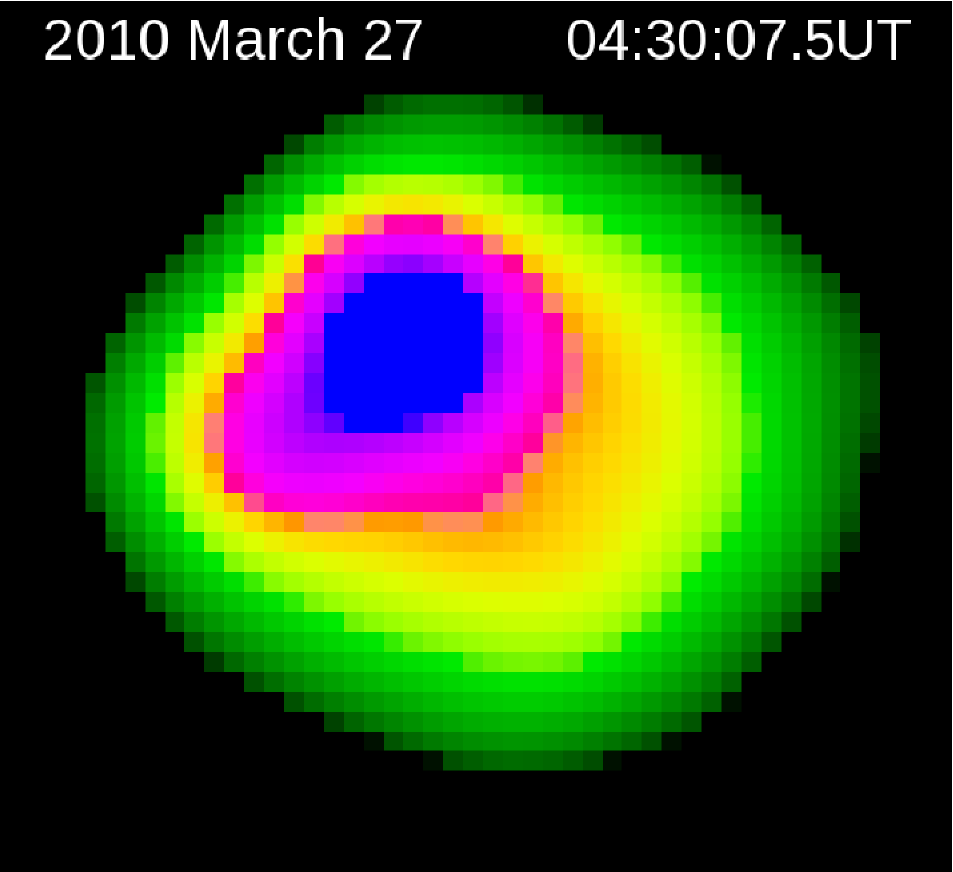
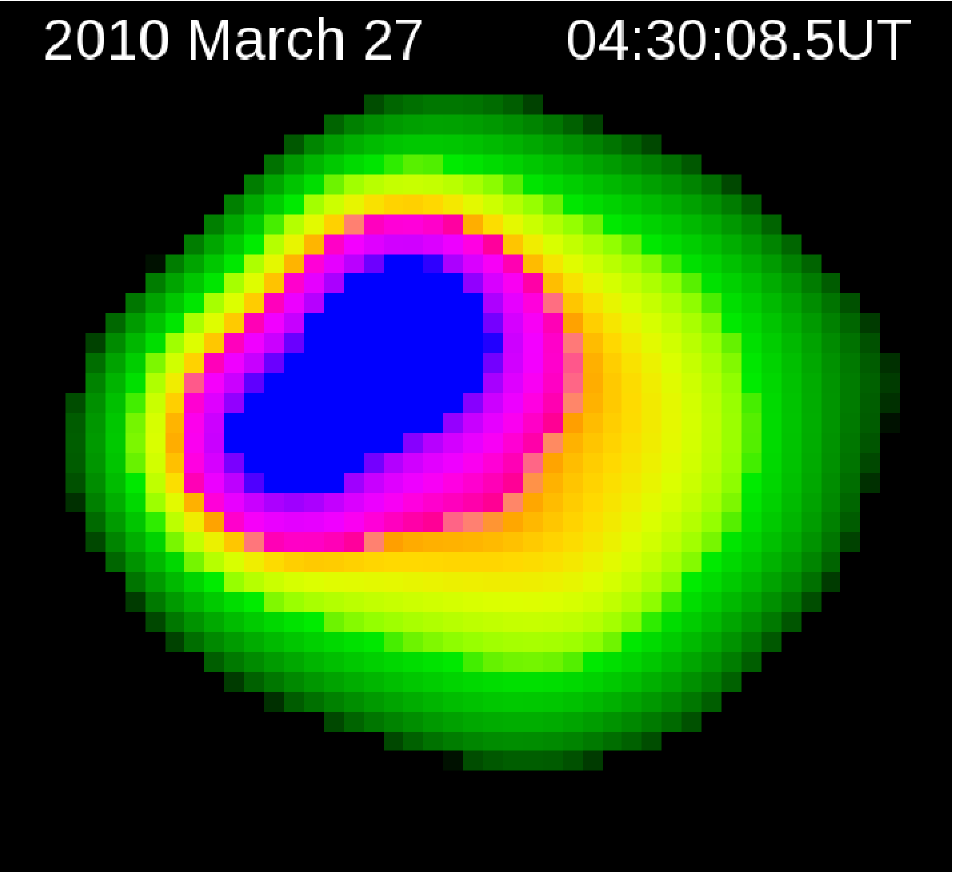
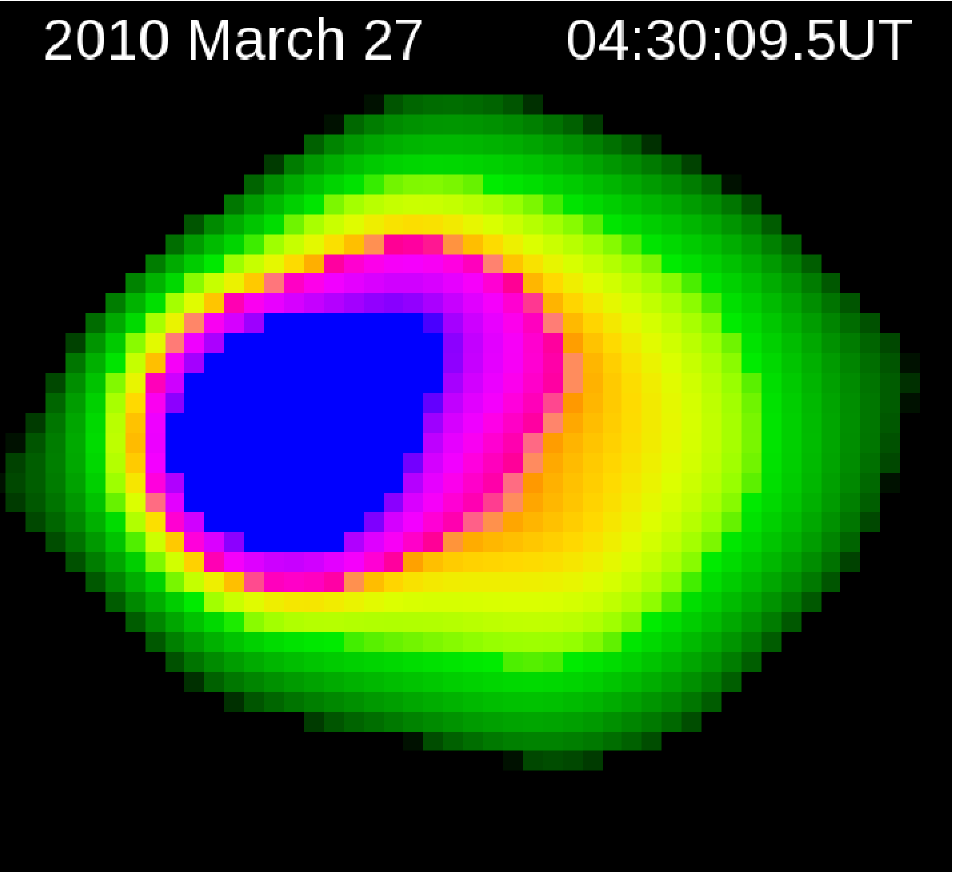
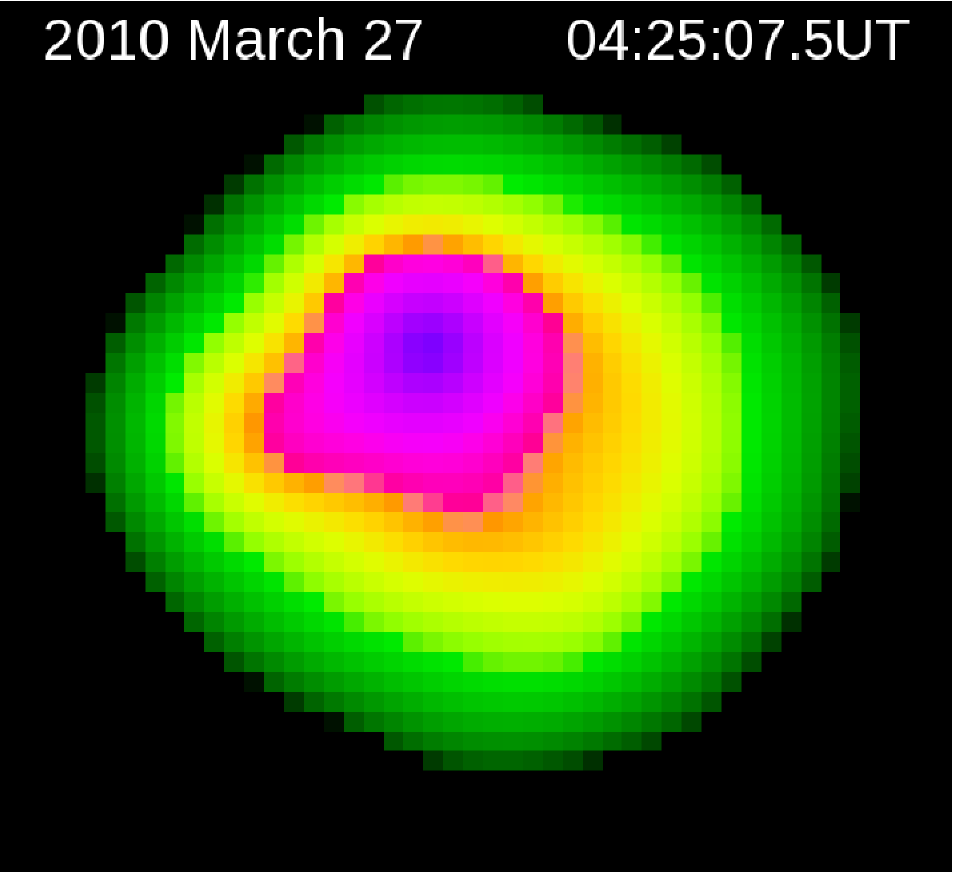
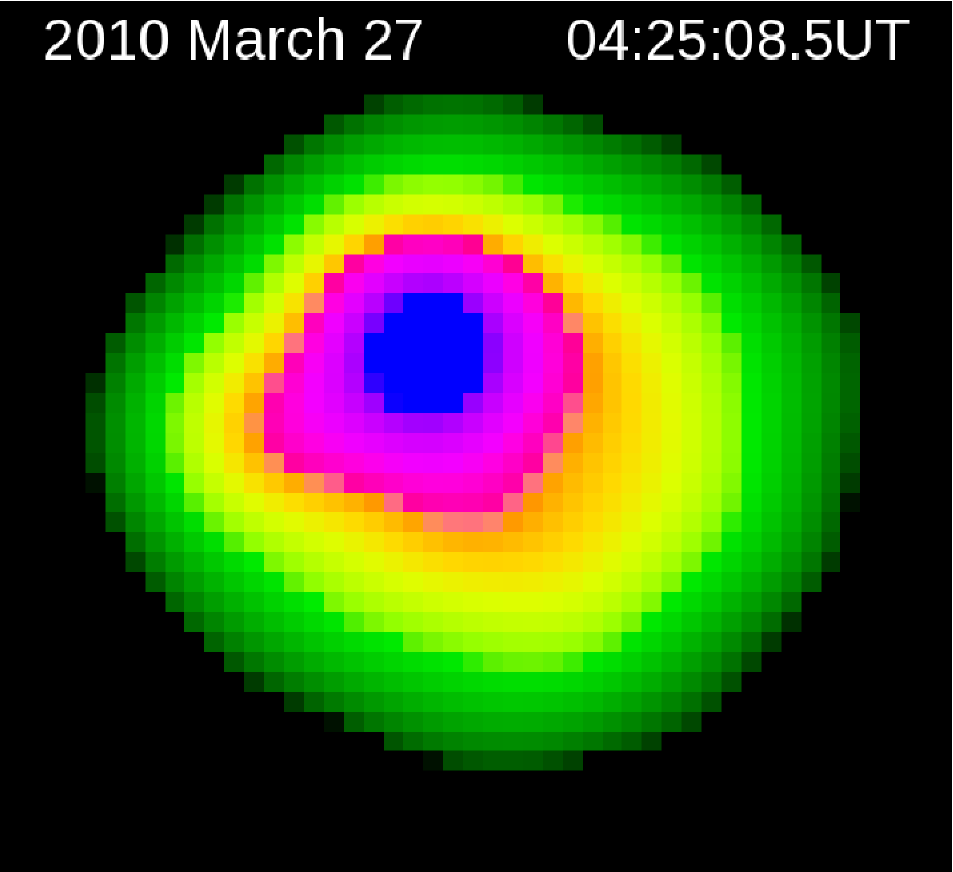
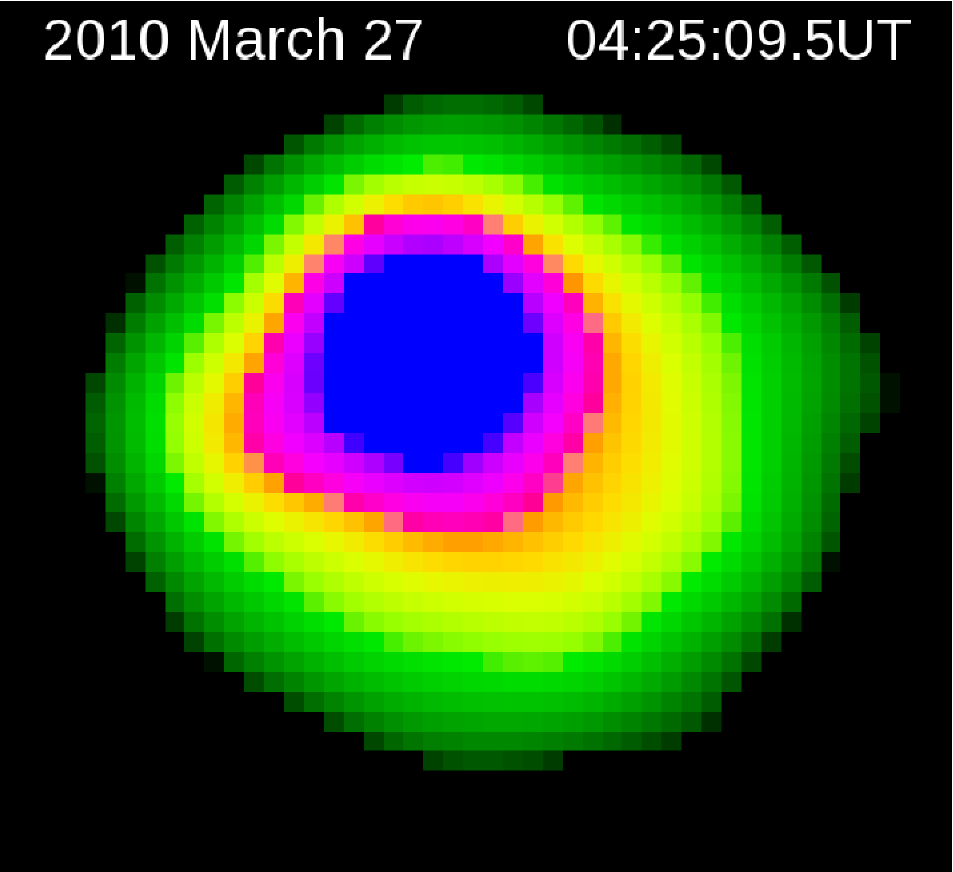
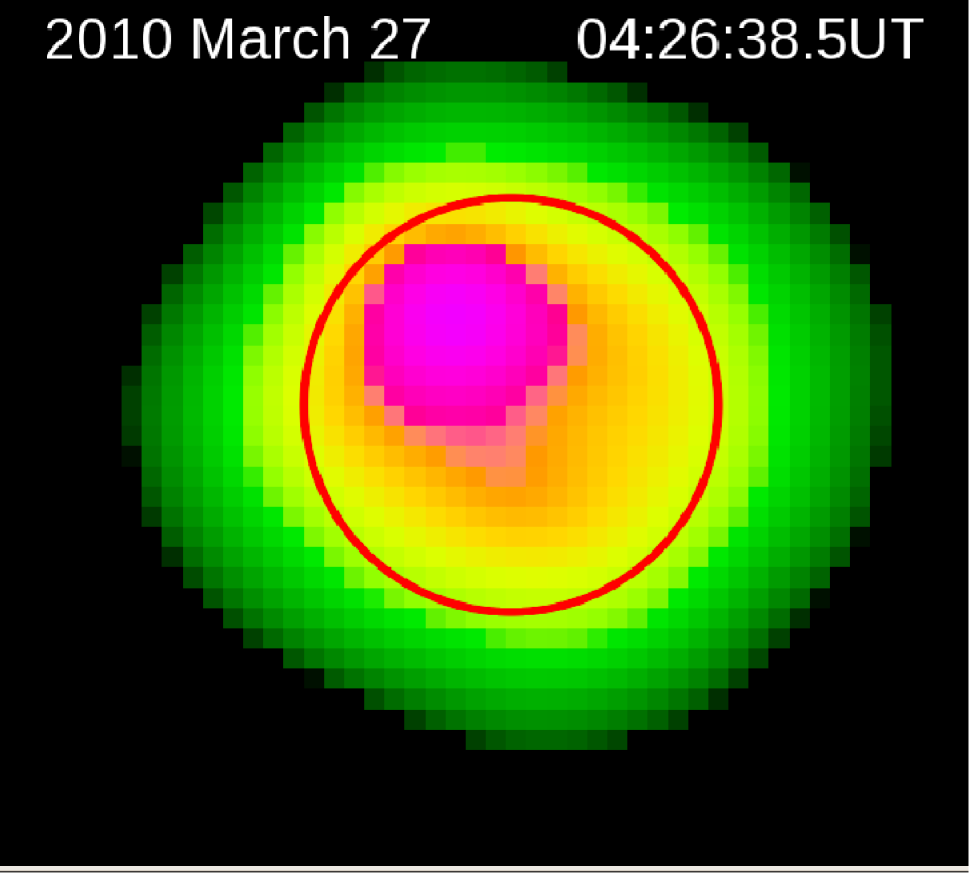
Although the spatial resolution of the 32T is limited, the fidelity and dynamic range of these images is unprecedented at these frequencies; the dynamic range of 2500 exceeds that of earlier images by about an order of magnitude (cf. Mercier et al., 2006; Mercier & Chambe, 2009). The higher fidelity and dynamic range enables us not only to image the quiescent solar emission in the presence of much brighter features, unlike most earlier observations (e.g., Kai, 1970; Kundu et al., 1986; Krucker et al., 1995; Vilmer et al., 2002; Ramesh et al., 2010), but also to track low level variations in the coronal emission. The bottom panels in Fig. 4 illustrate the morphological relationship between our 32T radio images and the extreme ultraviolet (EUV) images taken on the same day. A persistent feature coinciding with the location of the NOAA Space Weather Prediction Center (SWPC) region 11057 (hereafter region 11057), is seen in the solar radio images, even at quiescent times.
Rapid and significant changes in the radio morphology of the Sun on timescales of seconds are clearly visible in the images presented in Fig. 4 and are further highlighted in the two “movies” available in the on-line journal. A significant fraction of this variability maps back to the location of the region 11057. Subtle changes in as a function of time are also discernible at the locations of the active regions on the Eastern limb and close to the center of the disc.
Fig. 5 highlights the spectroscopic capability of the 32T by showing the spectra from representative pixels across the entire emitting region.
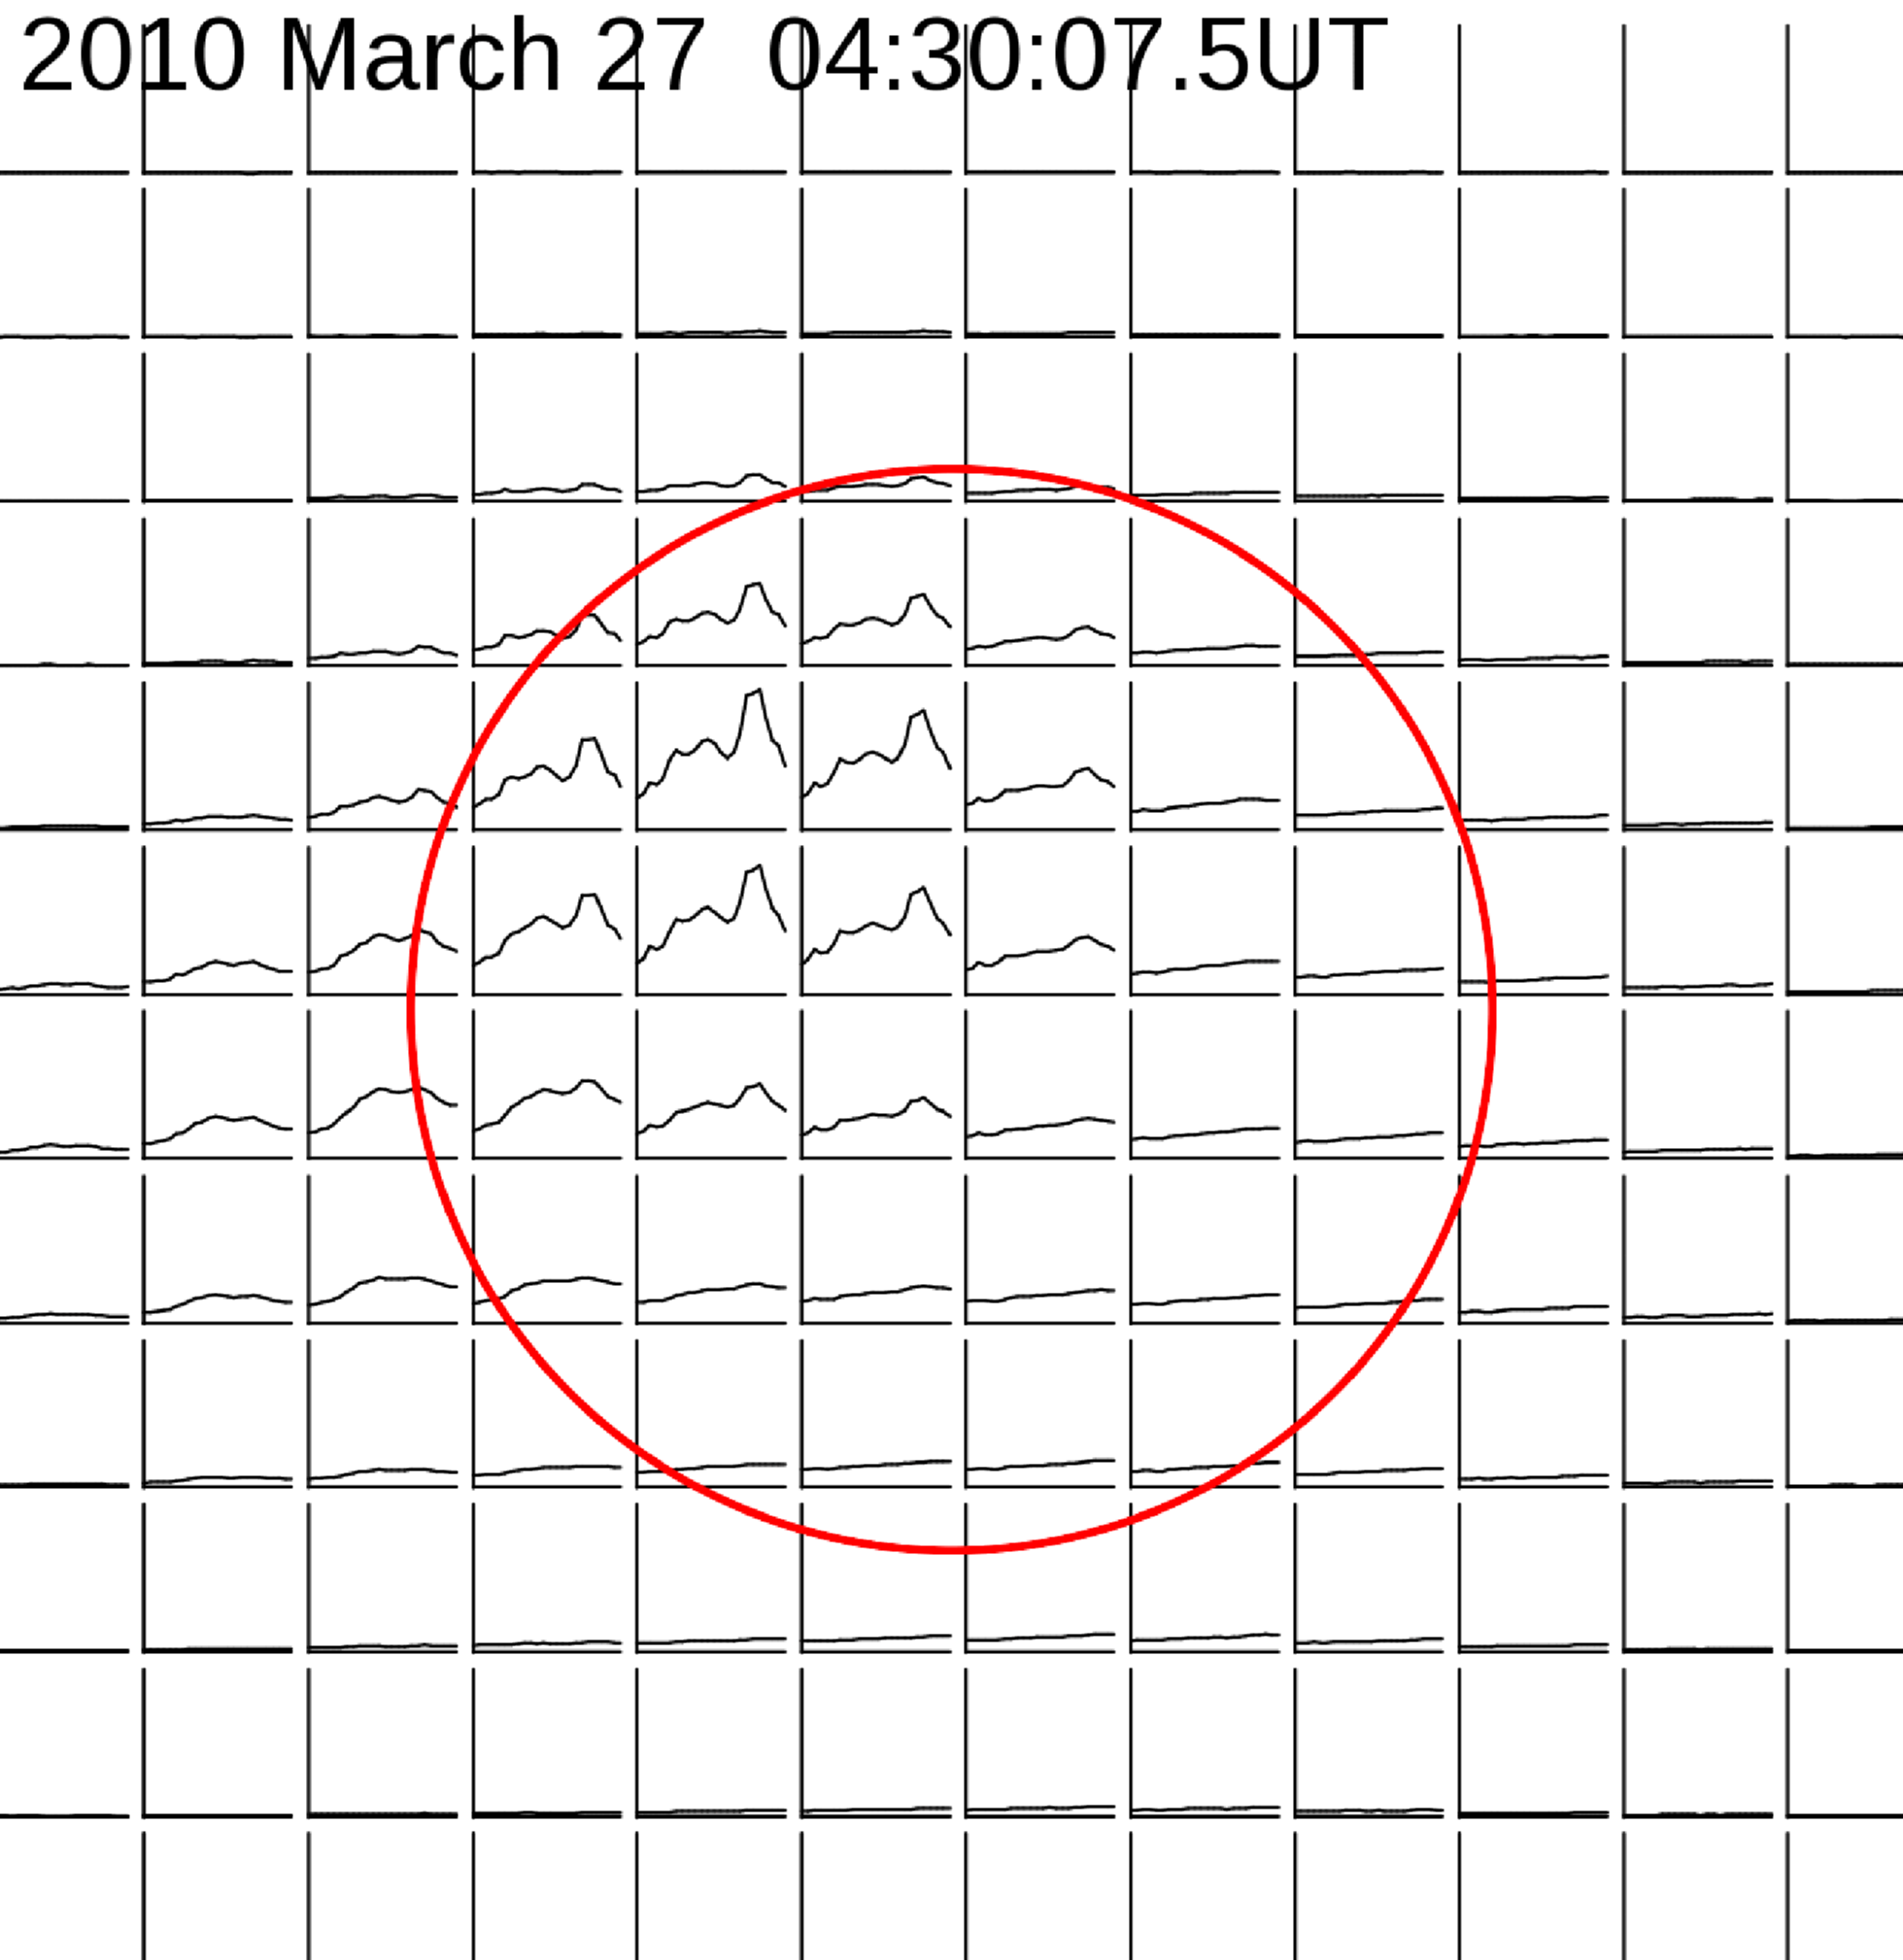
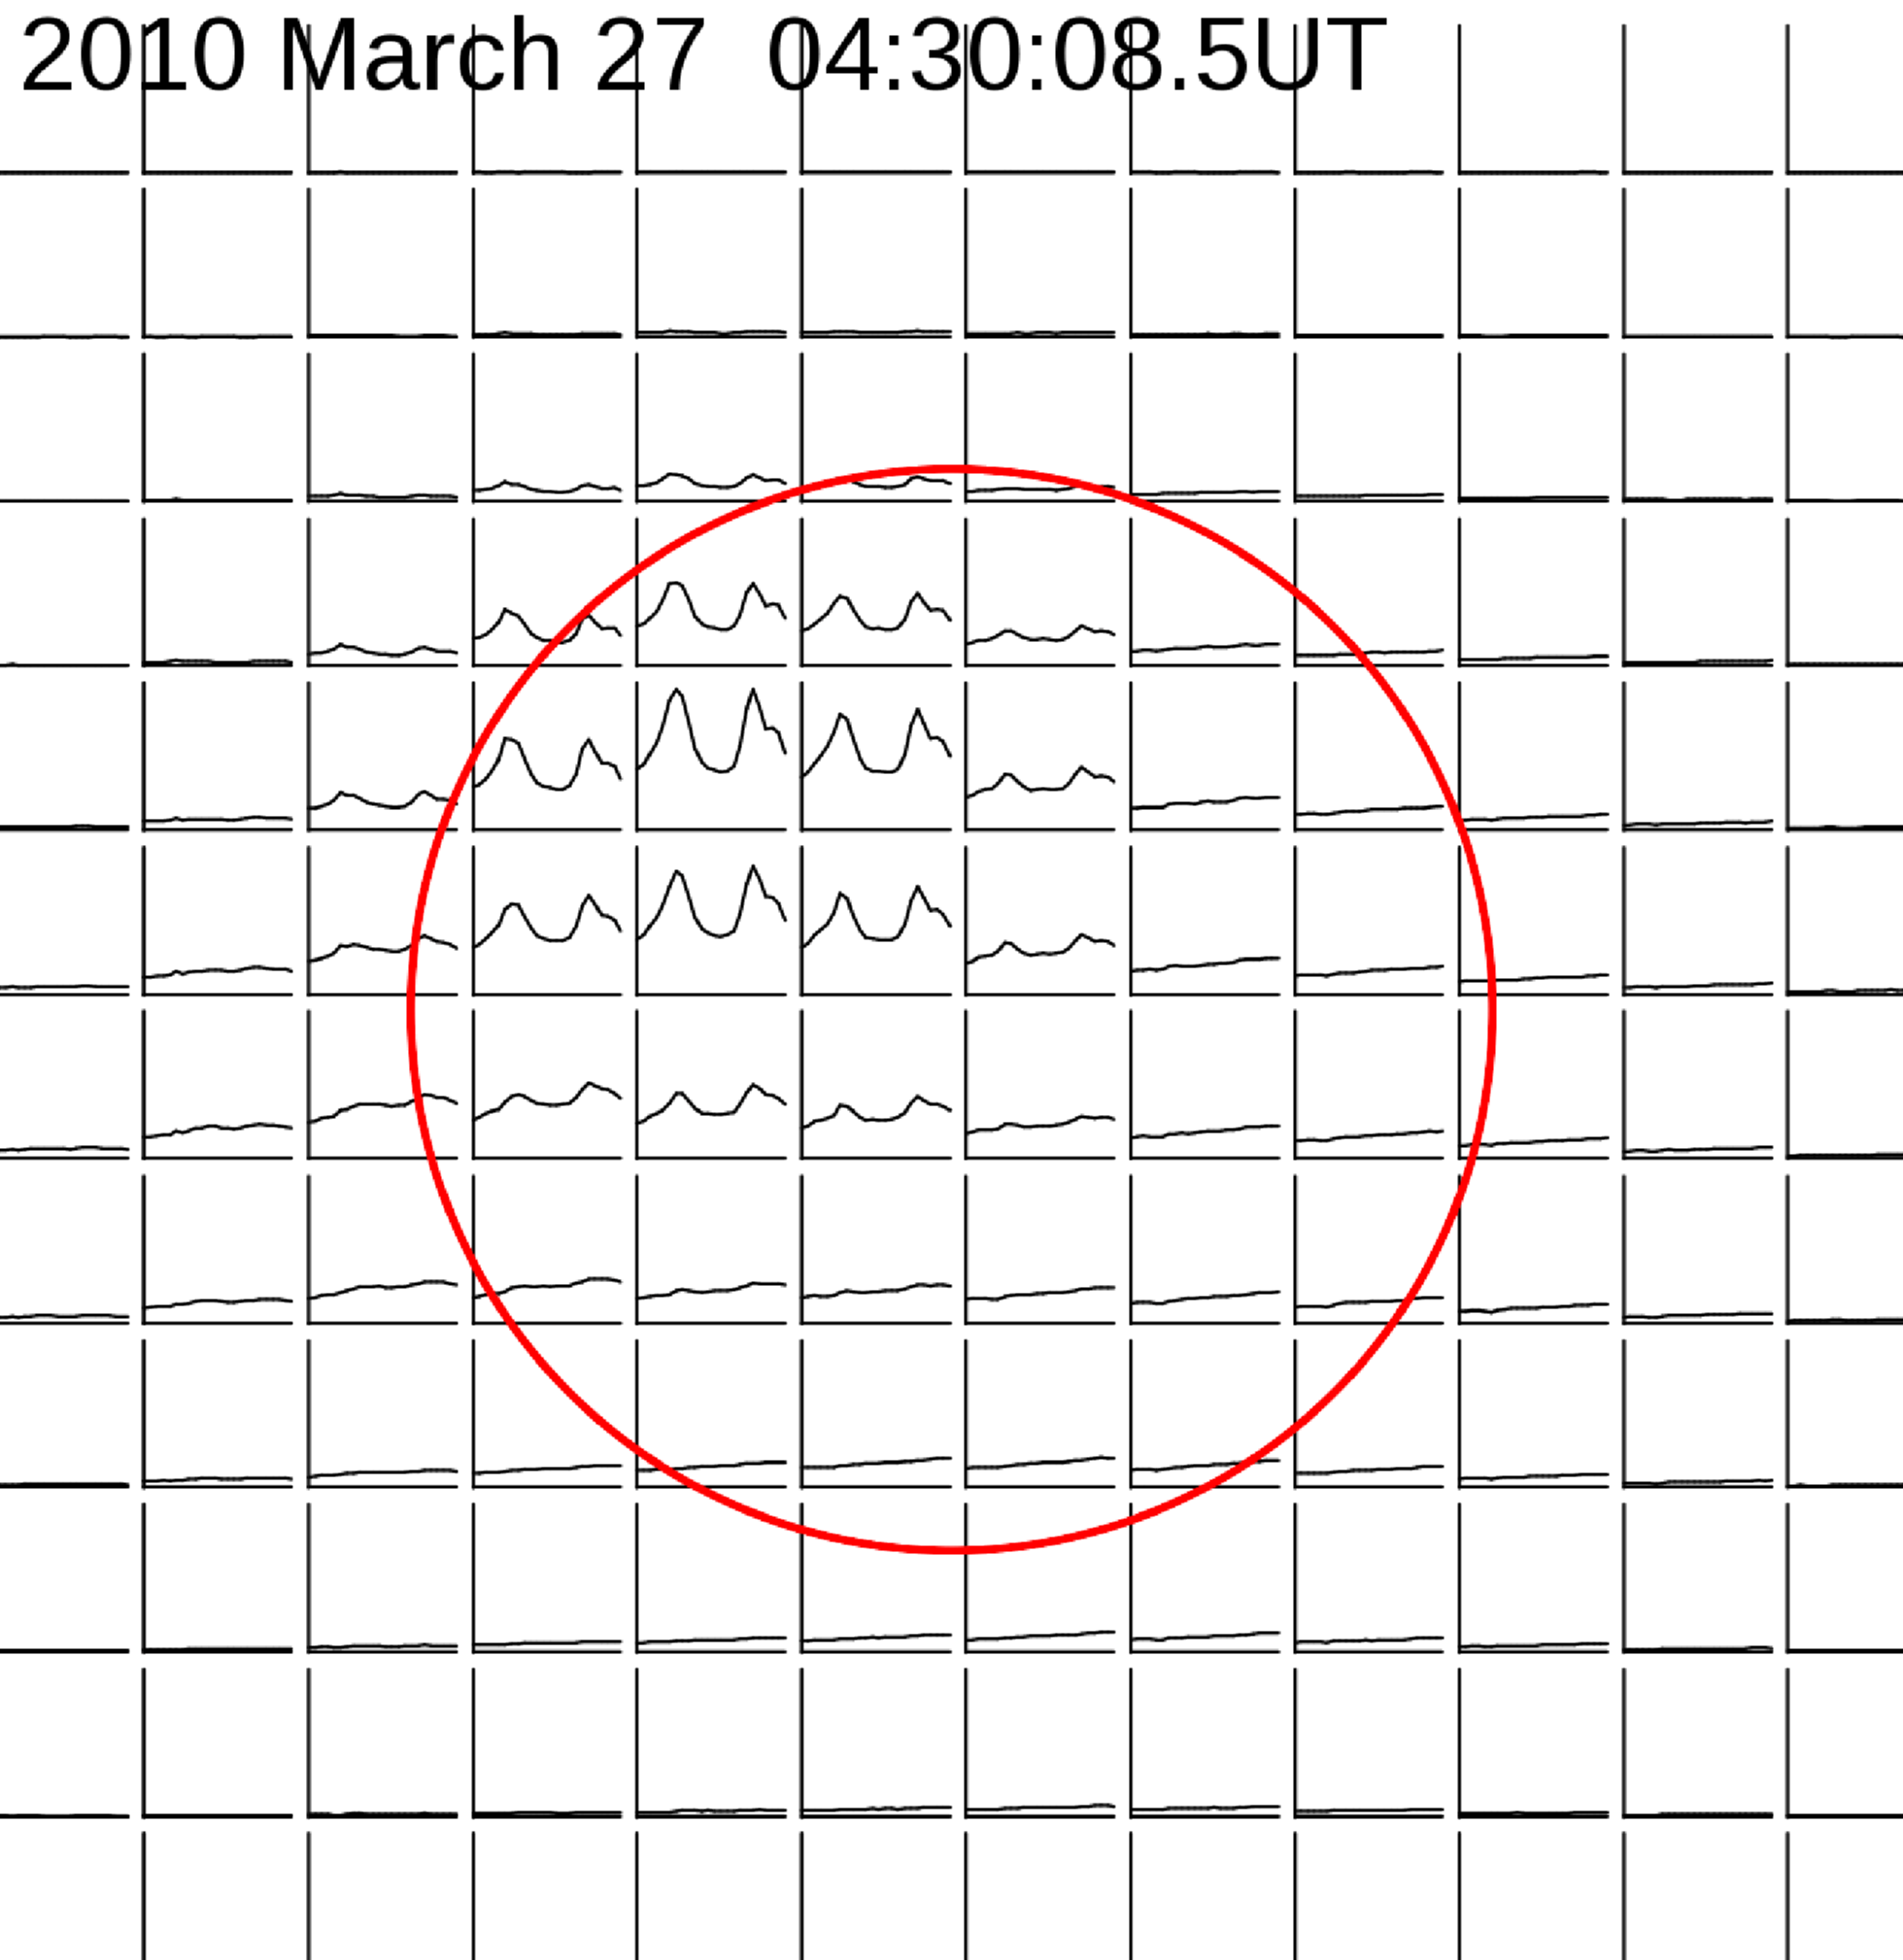


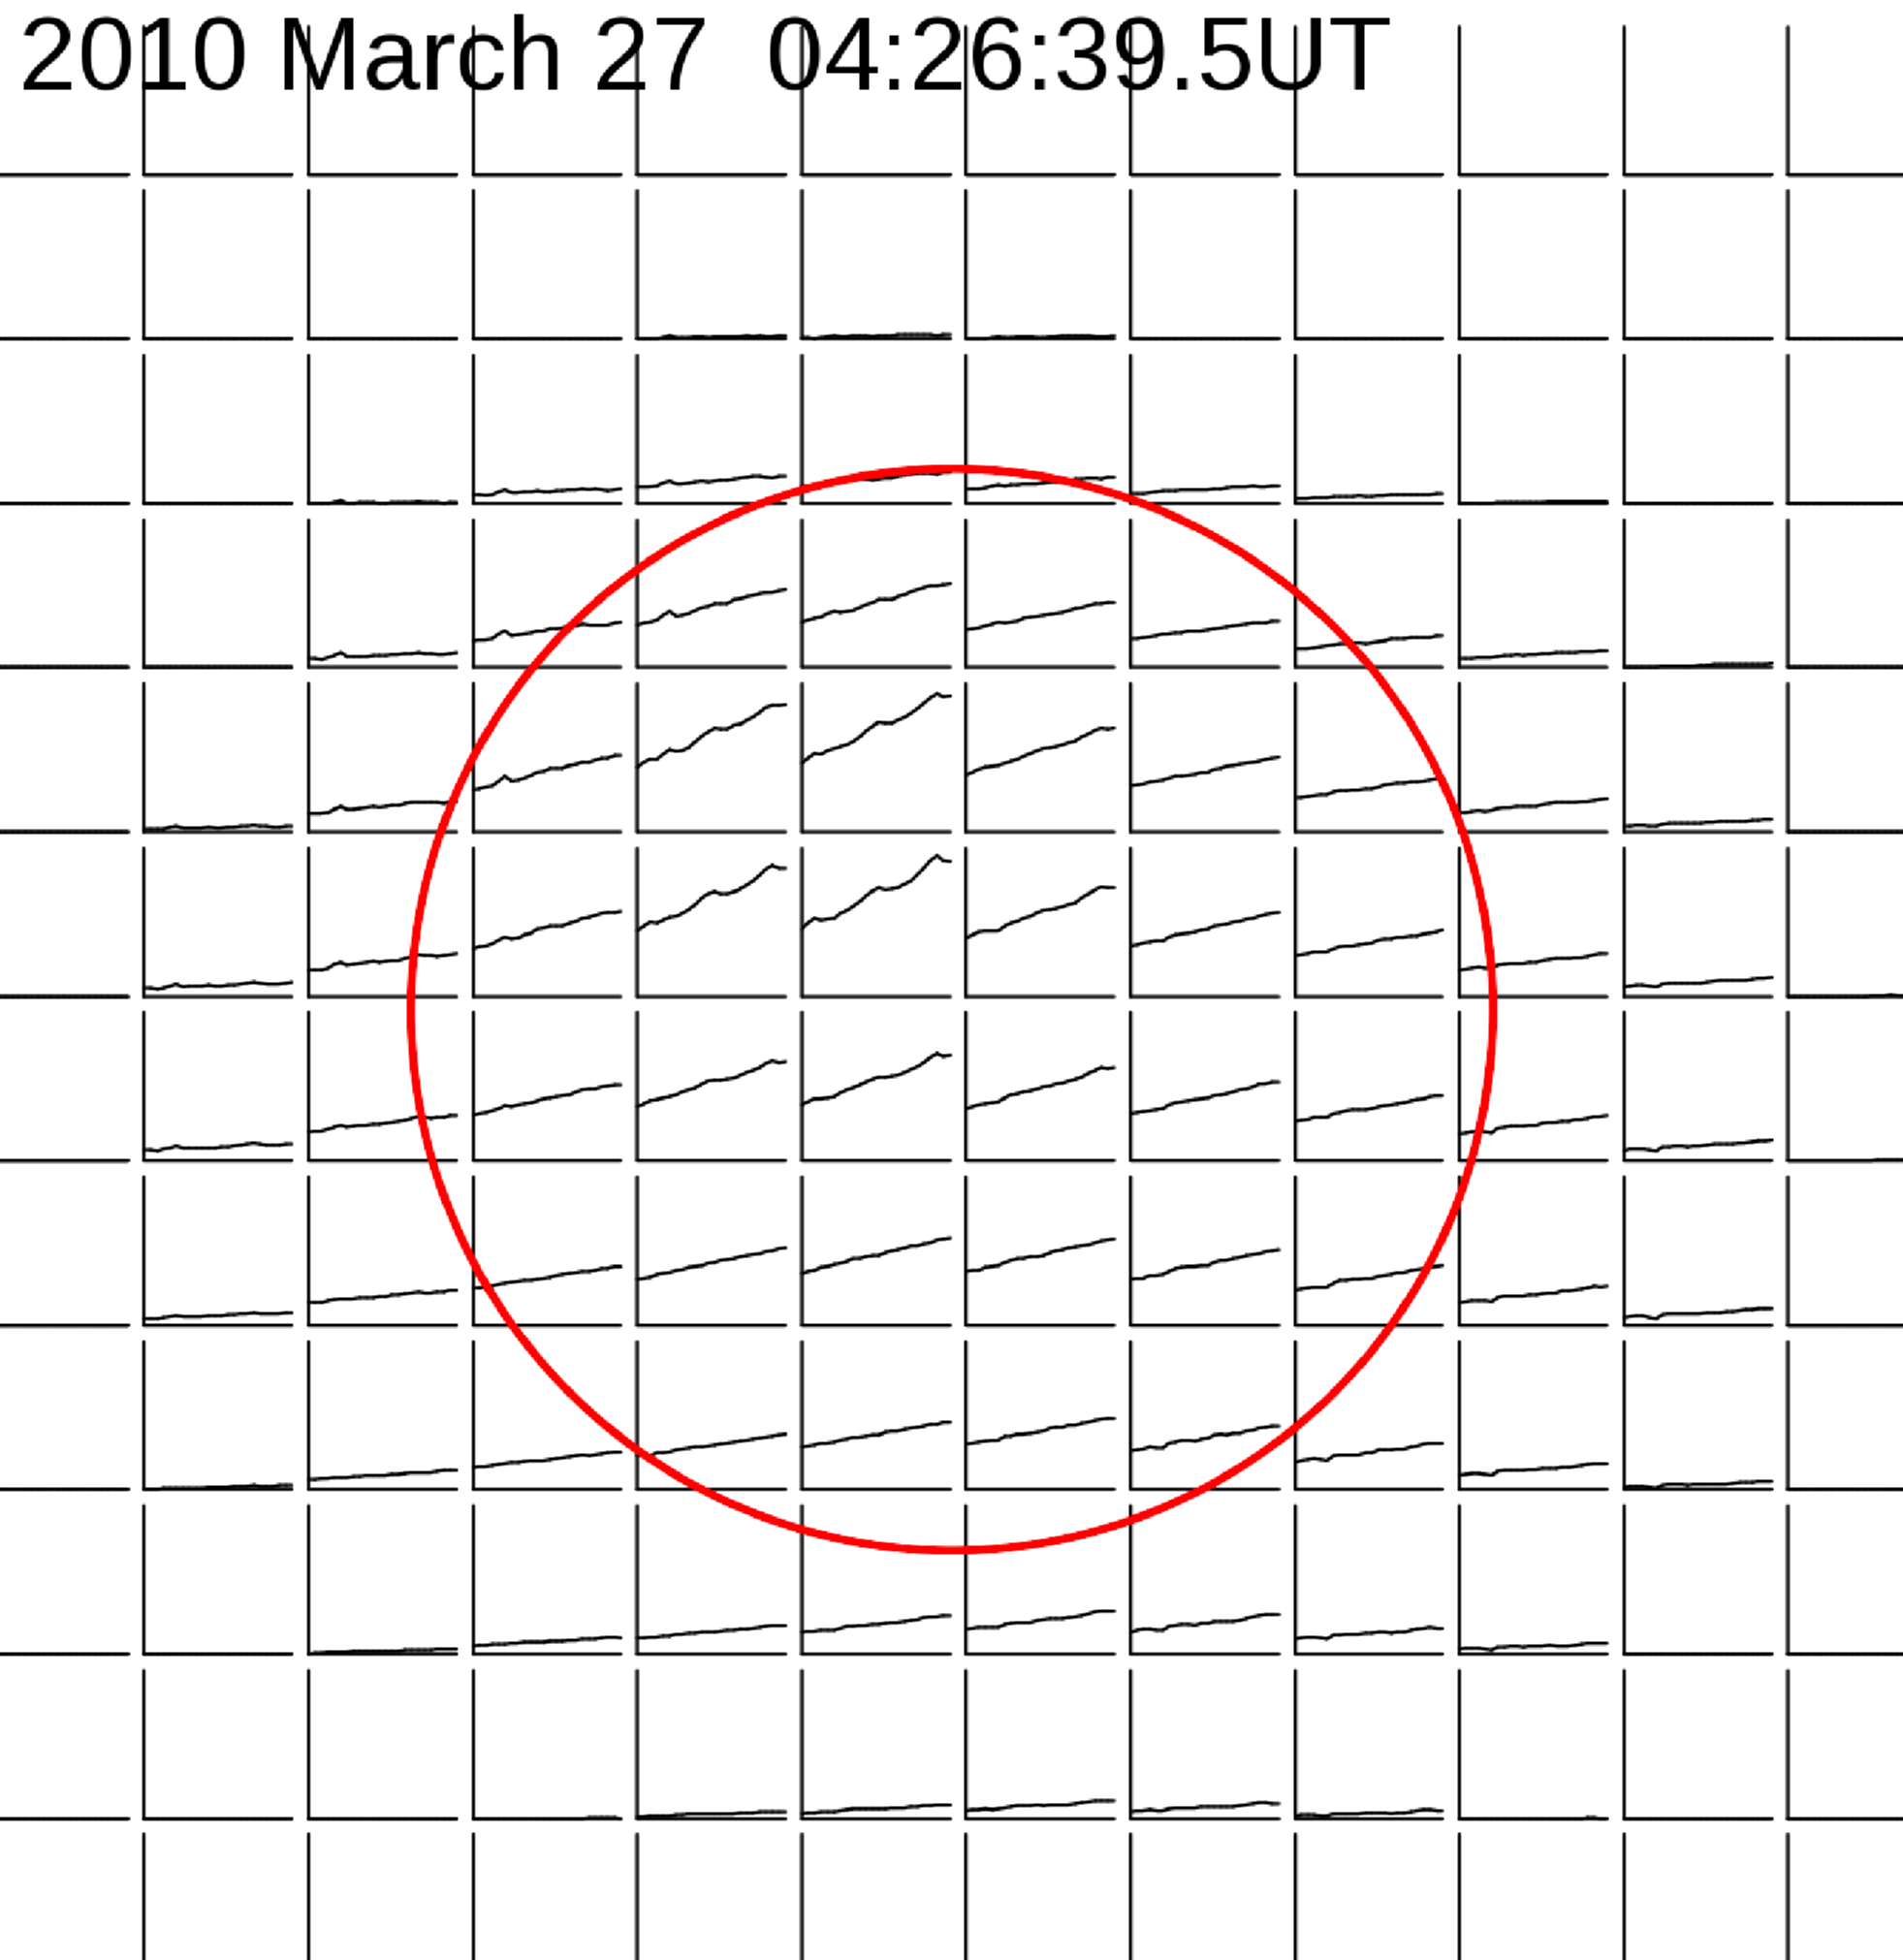
Various interesting features can be seen here. Even at quiescent times, there is a significant difference in the spectral slope of regions close to and away from region 11057. For both the “narrowband” and “broadband” features, the changes in spectral structure are confined to the vicinity of region 11057, and to a smaller extent to the locations of other active regions visible in the EUV image (Fig. 4). The “narrowband” features are consistent with spectral features superposed on the underlying quiescent spectrum. In contrast, the underlying quiescent spectrum is no longer visible in spectra of the “broadband” feature, and the changes in spectral characteristics are significantly larger, more dynamic, and complex.
4 Discussion and Conclusions
At low radio frequencies, a featureless continuum due to thermal bremsstrahlung from a corona with optical depth approaching unity constitutes the bulk of the “quiet” Sun emission and is expected to vary only slowly in time (e.g., Sheridan & McLean, 1985). In this regime, emission that exhibits rapid spectral variations is dominated by plasma emission, a resonant emission mechanism in which electrostatic Langmuir waves are converted to electromagnetic radiation at the local plasma frequency, , and its harmonic, 2 (e.g., Robinson & Cairns, 2000). This is the accepted emission mechanism for type II (e.g., Nelson & Melrose, 1985) and type III solar bursts (e.g., Suzuki & Dulk, 1985).
The ability of the 32T to image and track the temporal and spectral evolution of coronal emission with high dynamic range and fidelity over a broad spectral band represents a major advance in the quality, and consequently the utility, of radio measurements for understanding the dynamic solar corona. For example, we see numerous instances of transient, non-thermal emission in our short observations, many of which outshine the Sun by a factor of few and dramatically alter the distribution. Though there have been earlier imaging observations of solar radio tranisents, these investigations have been limited to a handful of well separated, non-contiguous frequencies due to the limited spectral sampling provided by previous radio interferometers.
The coherent emission mechanisms inherent at low radio frequencies have long been known to be a sensitive probe of electron acceleration in the the corona. Given our much improved observing capability, it is not a surprise that in spite of significant transient behavior seen in our data, the level of solar activity on the day of our observations has been characterized as low222USAF/NOAA Solar Geophysical ‘Weekly’ Data to medium333www.solarmonitor.org. The SWPC “events list” reports nine type III radio bursts on this day, none of them during the interval presented here. The SWPC also reports seven GOES B-class and four GOES C-class X-flares on this day (ten and five X-ray flares, respectively in a 24 hour period around our observations). All of the flares for which positional information is available (C-class) were associated with the region 11057. The start time for one of the B-class flares coincides with the stop time of our observations.
Based on its appearance in the frequency-time plane, the “broadband” feature present in our data (Fig. 2) resembles a weak type III burst and shares similarities with the “microbursts” reported by Kundu et al. (1986). A corresponding feature was seen at low signal-to-noise levels between 80 and 150 MHz by the Learmonth and Culgoora radiospectrographs, suggesting that this feature peaked in intensity within that spectral window. Though it appears to be a feature with a fast spectral drift rate, the signal-to-noise ratio and temporal sampling of the Learmonth and Culgoora data are not sufficient for a reliable estimate of the drift rate. Nançay Radioheliograph data spanning the wide 150–455 MHz frequency band show two persistent but time variable features separated by associated with region 11057 at nearby times. This suggests the presence of an underlying weak type IV emission. The non-thermal spectra of the region 11057 even at “quiescent” times, and the persistent feature seen at this location in our data are consistent with this.
Lacking an absolute flux calibration, we compute an approximate of the wideband burst at the center of our observing band by assigning the “quiet” Sun a of 7.510515% K, based on measurements of Lantos & Avignon (1975) at 169 MHz, and scaling it to the peak of the burst emission (04:30:12.5 UT). A measured receiver temperature of 50 K and an estimated Galactic background contribution of 150 K were used. We estimate an average 3.1106 K, significantly lower than the average value of 6.3107 K reported for type III bursts at 169 MHz (Suzuki & Dulk, 1985). The low value of measured highlights the ability of the 32T to make sensitive measurements. We note that since the angular size of the emitting region is expected to be much smaller than the 32T beam, the measured is expected to be considerably reduced due to beam-dilution. Assuming a plasma emission process and the Newkirk (10Newkirk) model (Newkirk, 1961) for coronal electron density leads to a coronal height of 1.7 R⊙ (2.8 R⊙) above the photosphere for the source region at our central observing frequency. A bandwidth of 30 MHz corresponds to a range of 0.09 R⊙ (0.25 R⊙) around this coronal height.
A particularly intriguing aspect of our data is the abundance of short-lived, “narrowband” emission features carpeting the frequency-time plane, which to our knowledge, have not been reported previously. Though smaller in spectral and temporal extent, these features have a similar , implying a coherent emission process, like plasma emission. The existence of these emission features provides evidence for impulsive non-thermal energy deposition into the corona at levels lower than previously known. Evaluating their contribution to the coronal heating budget will require building up a better understanding of the frequency of occurrence and energetics of such features. Existing radio observations have been shown to be a more sensitive probe for such phenomena than X-ray observations (e.g. Ramesh et al., 2010), and these observations extend the radio sensitivity advantage by another order of magnitude.
As seen in Fig. 4, much of the “narrowband” activity seen in Fig. 2 maps to the location of the region 11057. Even the low level fluctuations in the spectrum when the Sun is in a relatively quiescent state (e.g., Fig. 3, bottom panel; Fig. 5), manifest themselves in the image plane as flickering intensity at the location of this active region. The occurrence of many weak X-ray flares from region 11057 around our observing period suggests a persistent low-level activity during our observations. This raises the possibility that the “narrowband” features are the radio signatures of the same magnetic field rearrangement activity: numerous small reconnection events too faint to picked up by X-ray monitoring platforms like GOES, but with weak type III-like radio emission strong enough to be seen by the 32T. This hypothesis is strengthened by the observation that the “narrowband” features were absent on 2010 March 29 (not shown here), a day when no X-ray activity was reported. There have been attempts to investigate the possibility of using type III solar bursts as predictors for large solar flares in the past (Jackson & Sheridan, 1979; Kane, 1981). The ability to characterize type III-like activity in much greater detail and with much higher sensitivity, demonstrated here, enhances the prospects for investigating such a connection.
Compared to the 32T, the MWA will provide an order of magnitude improvement in angular resolution, 16 times as much collecting area and 162 times as many baselines. With its unprecedented high fidelity and dynamic range polarimetric spectroscopic imaging capability for every spectral and temporal slice, and a radio quiet site providing seamless access to the RF spectrum, the MWA will be an excellent match to the challenge of solar imaging. Every significant advance in our capability to observe the Sun has revealed that the Sun and corona are more dynamic and feature-rich than had been thought previously. HINODE and the Solar Dynamics Observatory (SDO) represent the latest in that progression. The 32T array is already demonstrating that we are beginning to see features at a level of detail not seen before, and we can justifiably expect the MWA to similarly add to our understanding of the solar corona and the heliosphere.
References
- Bracewell & Roberts (1954) Bracewell, R. N. & Roberts, J. A. 1954, Australian Journal of Physics, 7, 615
- Cohanim et al. (2004) Cohanim, B. E., Hewitt, J. N., & de Weck, O. 2004, ApJS, 154, 705
- Erickson et al. (1977) Erickson, W. C., Kundu, M. R., Mahoney, M. J., & Gergely, T. E. 1977, Sol. Phys., 54, 57
- Jackson & Sheridan (1979) Jackson, B. V. & Sheridan, K. V. 1979, Proceedings of the Astronomical Society of Australia, 3, 383
- Kai (1970) Kai, K. 1970, Sol. Phys., 11, 310
- Kane (1981) Kane, S. R. 1981, ApJ, 247, 1113
- Krucker et al. (1995) Krucker, S., Aschwanden, M. J., Bastian, T. S., & Benz, A. O. 1995, A&A, 302, 551
- Kundu et al. (1986) Kundu, M. R., Gergely, T. E., Szabo, A., Loiacono, R., & White, S. M. 1986, ApJ, 308, 436
- Lantos & Avignon (1975) Lantos, P. & Avignon, Y. 1975, A&A, 41, 137
- Lonsdale et al. (2009) Lonsdale, C. J. et al. 2009, IEEE Proceedings, 97, 1497
- Mercier & Chambe (2009) Mercier, C. & Chambe, G. 2009, ApJ, 700, L137
- Mercier et al. (2006) Mercier, C., Subramanian, P., Kerdraon, A., Pick, M., Ananthakrishnan, S., & Janardhan, P. 2006, A&A, 447, 1189
- Nelson & Melrose (1985) Nelson, G. J. & Melrose, D. B. 1985, Type II Bursts, ed. D. J. McLean & N. R. Labrum (Cambridge: Cambridge University Press), 333–359
- Newkirk (1961) Newkirk, G. Jr., 1961, ApJ, 133, 983
- Ramesh et al. (2010) Ramesh, R., Kathiravan, C., Barve, I. V., Beeharry, G. K., & Rajasekara, G. N. 2010, ApJ, 719, L41
- Robinson & Cairns (2000) Robinson, P. A. & Cairns, I. H. 2000, in Radio Astronomy at Long Wavelengths, ed. R. G. Stone, K. W. Weiler, M. L. Goldstein, & J.-L. Bougeret , 37–45
- Sheridan & McLean (1985) Sheridan, K. V. & McLean, D. J. 1985, The quiet sun at Meter Wavelengths, ed. D. J. McLean & N. R. Labrum (Cambridge: Cambridge University Press), 443–466
- Suzuki & Dulk (1985) Suzuki, S. & Dulk, G. A. 1985, Bursts of Type III and Type V, ed. D. J. McLean and N. R. Labrum (Cambridge: Cambridge University Press), 289–332
- Vilmer et al. (2002) Vilmer, N., Krucker, S., Lin, R. P., & The Rhessi Team. 2002, Sol. Phys., 210, 261