1\Yearpublication\Yearsubmission\Month\Volume\Issue
XXXX
{changed} Statistical Analysis for the Q-factor of twin kHz QPOs
Abstract
Using the recently published data of twin kHz quasi-period oscillations (QPOs) in neutron star low-mass X-ray binaries (LMXBs), we study the different profiles between bright Z sources and less luminous Atoll sources {changed} in a statistical way. We find the quality factors of upper kHz QPOs show a narrow distribution both for Z sources and Atoll sources, which concentrate at 7.98 and 9.75 respectively, the quality factors of lower kHz QPOs show a narrow distribution for Z sources and a broader distribution for Atoll sources, which concentrate at 5.25 and 86.22 respectively. In order to investigate the {changed} relation between {changed} the quality factor and {changed} the peak frequency of kHz QPOs, {changed} we fit the data with power-law, linear and exponential functions, respectively. There is an obvious trend that the quality factors increase with the peak frequencies both for upper and lower QPOs. The implications of our results are discussed.
keywords:
accretion: accretion disks–stars: neutron–binaries: close–X-rays: stars–pulsar.1 Introduction
A number of neutron stars in low mass X-ray binaries show the kilohertz quasi-periodic oscillations {changed} in their X-ray spectra (van der Klis 2000, 2006). These frequencies, in the range of Hz, are {changed} as the same order as the dynamical {changed} timescale of the innermost {changed} region of the accretion flow around the stellar mass compact objects (van der Klis 2006, 2008). Owing to the expected links with the orbital motion, most {changed} work about kHz QPOs focus on the explanation for the nature of these signals (e.g. Miller, Lamb & Psaltis 1998; Stella & Vietri 1998, 1999; Kluzniak & Abramowicz 2001; Abramowicz et al. 2003; Zhang 2004). The kHz QPOs often {changed} arise as simultaneous twin peaks (upper and lower frequency) with frequencies changing over time. These frequencies behave in a rather regular way and follow the tight correlations between their frequencies and other observed characteristic frequencies (see, e.g. Psaltis et al. 1998, 1999a; Psaltis, Belloni & van der Klis 1999b; Stella, Vietri & Morsink 1999; Belloni, Psaltis & van der Klis 2002; Titarchuk & Wood 2002; M endez & van der Klis 1999, 2000; Méndez et al. 2001; Yu, van der Klis, Jonker 2001; Yu, van der Klis 2002). Moreover, the correlation between the upper frequency and {changed} the lower frequency across different sources can be roughly fitted by a power-law function (see e.g. Psaltis et al. 1998, 1999a; Zhang et al. 2006), and also by a linear model (see Belloni, Méndez & Homan 2005, 2007).
The kHz QPOs in LMXBs are narrow features (peaks) in their power density spectra (PDS), whose profiles can be described by the Lorentzian function ( is the peak frequency, is the full width at half-maximum (FWHM), and is the amplitude of {changed} the signal). The ratio of peak frequency to FWHM is the quality factor,
| (1) |
Therefore, the kHz QPOs in neutron star LMXBs can be characterized by three characteristic quantities, i.e. centroid frequency (i.e., peak frequency ), quality factor (Q / FWHM) and fractional root-mean-squared (rms). The quality factor characterizes the coherence of the signal, while the rms represents a measure of the signal strength and {changed} it is proportional to the square root of the peak power contribution to the PDS. Each kHz QPO corresponds to its quality factor (lower and upper quality factor) and centroid frequency (upper and lower frequency).
In the past several years, the large Rossi X-ray Timing Explorer (RXTE) archive makes {changed} it possible {changed} to study this quantity systematically in several sources. Using {changed} the data from RXTE, Barret et al. (2005a) studied {changed} the source 4U 1608-52 and revealed a positive correlation between {changed} the lower frequency {changed} QPOs and its quality factors, up to a maximum of about . Motivated by this idea, Barret, Olive & Miller (2005b, 2006) studied the QPO properties and the dependency of {changed} its quality factor on {changed} the peak frequency in source 4U 1636-536. It shows that {changed} the quality factors for lower and upper kHz QPOs of 4U 1636-536 follow different tracks in a {changed} plot, i.e. {changed} the quality factors {changed} of lower kHz {changed} increase with {changed} its peak frequency up to 850 Hz (Q 200) and {changed} drop precipitously to the highest {changed} detectable frequency 920 Hz (Q 50), while {changed} the quality factors of upper kHz {changed} QPOs increase steadily all the way to the highest detectable frequency. Moreover, {changed} the quality factors of lower {changed} QPOs is higher than {changed} those of upper {changed} ones (Barret, Olive & Miller 2005b,c; 2006). The rough similarity {changed} was also extended to sources 4U 1735-44 {changed} and 4U 1728-34 (Barret, Olive & Miller 2006; Boutelier, Barret & Miller 2009; Mndez 2006; Trk 2009).
In this paper, we analyze the {changed} distributions of {changed} the quality factors for upper and lower kHz QPOs {changed} in ten sources — five Atoll sources (namely 4U 1608-52, 4U 1636-53, 4U 1728-34, 4U 1820-30 and 4U 1735-44) and five Z sources (namely Sco X-1, Cyg X-2, GX 17+2, GX 5-1 and GX 340+0). In order to investigate the {changed} relation between {changed} the quality factors and {changed} its centroid frequencies, we fit {changed} the data with the three {changed} functions , i.e. linear relation (), power-law relation () and exponential relation (), {changed} according to tracks. We benefit from the existing studies and use the published data from the collection by Méndez (2006, and reference therein). In section 2, we analyze the data for these sources and execute fitting for the different source categories. Conclusions and discussions are contained in section 3.
2 Statistical Analysis for the Coherence of kHz QPOs
In this part, we investigate the data statistically and choose linear (), power-law () and exponential relation () for fitting, where and are the undefined parameters. {changed} Firstly, we put {changed} the sources together and fit {changed} them with above three relations, then {changed} we divide them into Atoll and Z sources and {changed} execute the same fitting.
2.1 Statistically Analysis for the Data
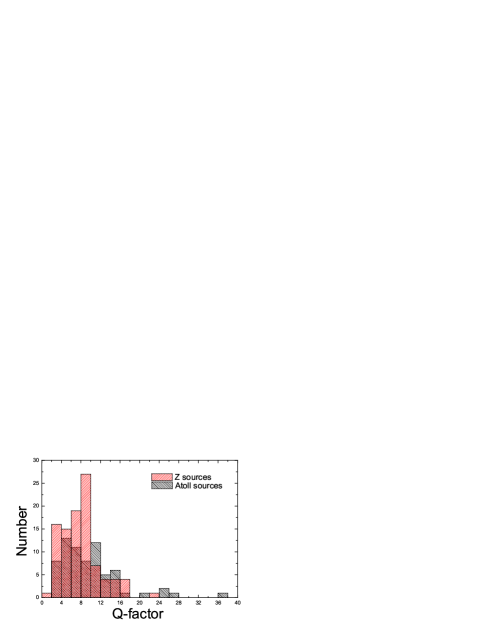
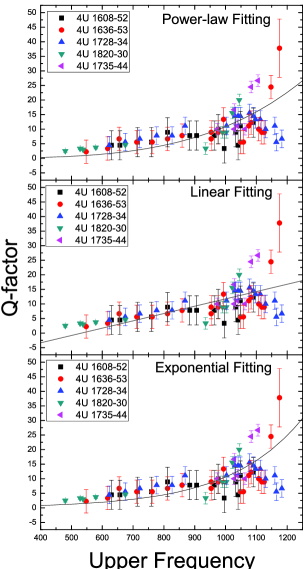
Firstly, we study the distributions of upper and lower quality factors for Z and Atoll sources. Fig. 1 presents the {changed} distributions of upper quality factors () for Z and Atoll sources. It is found that most {changed} of these two classes locate in the {changed} similar region (i.e. = 2 - 18) as a whole. For the exception, a few of Atoll sources present relatively {changed} larger values (up to 40, see Fig. 1 for detail). Most for Z sources gather in a range from 2 to 10 {changed} which is larger than {changed} those of Atoll sources. For a quantitative knowledge, we calculate the mean value of for Z and Atoll sources, i.e. and . The mean value of for Z sources is lower than that for Atoll sources.
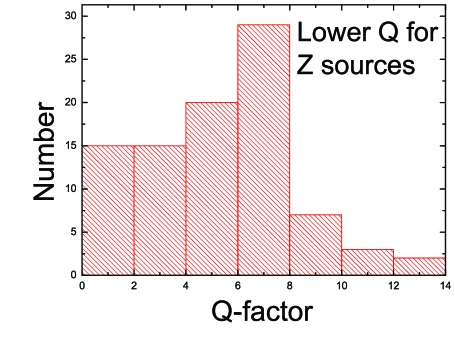
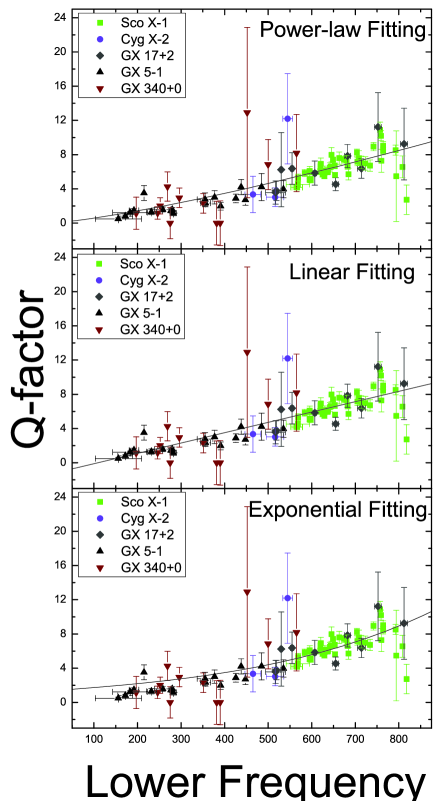
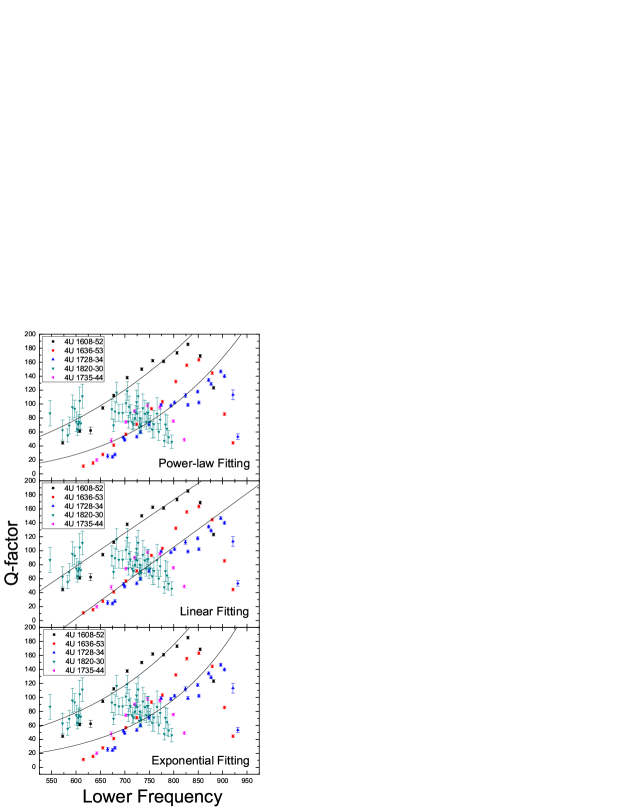
In Fig. 2, we plot the distributions of lower quality factors () for Z and Atoll sources, where we notice very big difference in the range of between {changed} these two sources. The for Z sources are {changed} small (), and {changed} those for Atoll sources are very {changed} large (up to ). The ranges from 2 to 14 for Z sources and from 2 to 200 for Atoll sources (see Fig. 2 for detail). Most data of for Z sources are distributed from 6 to 10, and that of Atoll sources gather in the region of . Some for Atoll sources are as high as 200. We also calculate the mean values of both for Z and Atoll sources, i.e. , .

On the whole, the quality factors for Z sources are {changed} smaller than those for Atoll sources. In addition, for Z sources cover a wider range than , while cover the narrower range than for Atoll sources. The mean values {changed} of and are and {changed} , respectively.
2.2 Fitting for the Relations
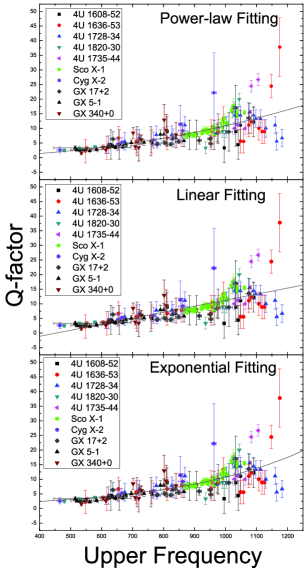
In order to study the {changed} relation , we {changed} use linear (), power-law () and exponential {changed} relations () to {changed} fit trajectories for ten sources. It is noticed that the values are similar for Z and Atoll sources, {changed} which increase with , so we fit the three relations to total ten sources, Z sources and Atoll sources, respectively (see Fig. 3). The values of {changed} fitting parameters ( and ) and the fitting results are listed in table 1.
From Fig. 3, it is seen that the data points are dispersive in the left and right panels, while the {changed} result in the middle panel is better, especially for power-law and exponential relations. From table 1, we notice that {changed} the fitting results are not good for these large . If we just forecast a roughly trend based on these results, it can be seen that the power-law and exponential relations fit mildly better than that of linear relation as a whole. Exponential relation fits better than power-law and linear relations both for Z sources and for Atoll sources. The fittings for of Z sources are better than that for Atoll sources, with relatively small reduced ( and for exponential, power-law and linear relations, respectively, see table 1 for detail). But for five Atoll sources, the reduced are relatively large ( and for exponential, power-law and linear relation, respectively), and the exponential fitting is also better than the other two relations. If we put all the sources together and {changed} fit three relations to them, we find that the power-law {changed} relation with a small (11.75) is better than the other two.
| Function | a | b | ||
|---|---|---|---|---|
| Total fitting | ||||
| 14.00 | 0.47 | |||
| 11.75 | 0.49 | |||
| 11.80 | 0.48 | |||
| Z source | ||||
| 5.76 | 0.64 | |||
| 5.01 | 0.69 | |||
| 4.73 | 0.71 | |||
| Atoll source | ||||
| 29.33 | 0.36 | |||
| 26.10 | 0.43 | |||
| 24.63 | 0.46 |
2.3 Fitting for the Relations
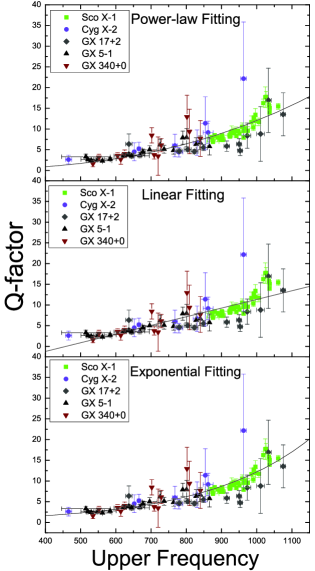
Following the same techniques, we {changed} investigate the relations for Z and Atoll sources (see Fig. 4).
The left panel of Fig. 4 {changed} show the results for Z sources, in which it can be seen that almost all points form the rising trend, and we fit power-law, linear and exponential relations to all the data points, respectively. The parameters and fitting results are listed in table 2. The reduced are 3.33, 3.30 and 3.62 for power-law, linear and exponential relation, respectively. It seems that the linear relation fits better than the other two.
The right panel of Fig. 4 show the results for Atoll sources, in which it can be seen that the {changed} distribution of five Atoll sources display two rising parts and two dropping parts (see {changed} the right panel of Fig. 4 for detail). {changed} We take the sources 4U 1608-52 and 4U 1820-30, which have large values, as a group. While the sources 4U 1636-53, 4U 1728-34 and 4U 1735-44, which have small values, as the other group. Then we fit the data of the two groups respectively, the fitting results are in table 2. Compared with the fitting result of , the reduced is very large (see table 2 for detail), but also with large . It is found that the linear relation fits better than the other two for the curve with relatively low values (formed by 4U 1636-53, 4U 1728-34 and 4U 1735-44), and the power-law relation fits better to the curve with high values (formed by 4U 1608-52 and 4U 1820-30).
So far, there is no appropriate model which can explain the mechanism of lower kHz QPOs, as well as that {changed} of the lower quality factors. However, it is {changed} claimed that the lower kHz QPOs arise in the innermost region of accretion disk (van der Klis 2006). The quality factors relate to the frequency drift in the inner disk (Barret, Olive & Miller 2006; Wang et al. 2011). So we claim that the diverge of the data points between different sources {changed} may result from {changed} different physical environment of inner disk {changed} in different sources. In addition, the occurrence of drops in plots for Atoll sources may arise from the existence of the inner boundary of accretion disk (Barret, Olive & Miller 2006). Due to the different mechanism of the drops of tracks for Atoll sources, we just fit the rising branches of the track and do not consider the dropping parts with {changed} the same techniques.
| Function | a | b | ||
|---|---|---|---|---|
| Z source | ||||
| 3.30 | 0.59 | |||
| 3.33 | 0.59 | |||
| 3.62 | 0.56 | |||
| Atoll source with lower | ||||
| 241.70 | 0.87 | |||
| 343.75 | 0.82 | |||
| 380.99 | 0.80 | |||
| Atoll source with higher | ||||
| 270.52 | 0.85 | |||
| 267.59 | 0.85 | |||
| 279.81 | 0.84 |
3 Discussions and Summary
In this work, we study the distribution of {changed} the quality factors and the relation between {changed} the quality {changed} factor and peak frequency of kHz QPOs . We notice that there are differences in the distribution of {changed} the quality factors between lower and upper kHz QPOs, as well as Z and Atoll sources. By fitting the power-law, linear and exponential relation to the tracks, we investigate the relations for upper and lower kHz QPOs.
(1). The values are low ( in general, with a few exceptions) for both Z and Atoll sources. The values for five Z sources are very low, . However, the values for five Atoll sources are very high, and the maximum is up to 200 (4U 1608-52).
(2). On the whole, the ranges of Q for five Atoll sources are wider than that for five Z sources both for upper and lower Q. According to the idea that the twin kHz QPOs come from the inner region of accretion disk, the instabilities which can lead to the radial drift and frequency drift in this region for Atoll sources are stronger than that for Z sources (Wang et al. 2011).
(3). From Fig. 2, it seems that the range of for Atoll sources is about 10 times wider than that for Z sources. In addition, the high luminosity Z sources exhibit luminosity close to critical Eddington luminosity , and the range of their luminosity is . But Atoll sources present low luminosity , 100 times lower than that for Z sources (Hasinger and van der Klis 1989; Hasingger 1990, see van der Klis 2006 for a review). Therefore, we expect a relation of between the luminosity and quality factors for lower kHz QPOs to be investigated and proven in future.
(4). {changed} The fitting results of can not confirm the actual relation between and because of the large . We consider that it may result from the small sample with the relative big errors. There is an obvious trend that increases with for both Z and Atoll sources, {changed} and the power-law and exponential relations fit better than the linear relation.
(5). {changed} The fitting results of also cannot be considered as perfect. Then, an obvious trend is that the increase with in the case of five Z sources, and the linear relation fits better than the other two.
(6). In the diagrams for Atoll sources, all five sources present drops at a maximum . {changed} It is considered as the results of innermost boundary (ISCO) of accretion disk, firstly proposed by Barret and coauthors (see, Barret et al. 2005b, 2005c, 2006, 2007) . The special mechanism of the drops are expected to be investigated further. Here, we just fit the three relations to the rising parts.)
(7). {changed} As for the relation between and in Atoll sources, it can be seen in the right panel of Fig. 4 that, if only the rising part of plot is considered, the five Atoll sources form two curve-like tracks, but it is not enough obvious to indicate a clear correlation. We claim that this phenomenon arises from the special physics in the inner disk region for each source, where stellar mass, magnetic field and accretion rate may be the roles of producing them. For the fitting, we fit the three relations to each rising curve. This tentative fitting is not good enough to show a clear correlation although the of linear {changed} fitting is better than the other two for the curve with relatively low values (formed by 4U 1636-53, 4U 1728-34 and 4U 1735-44), and {changed} the of the power-law {changed} fitting is better to the curve with high values (formed by 4U 1608-52 and 4U 1820-30).
Acknowledgements.
We acknowledge M. Méndez and D. Barret for providing the data. This work is supported by the National Natural Science Foundation of China (NSFC 10773017, NSFC 10773034, NSFC 10778716, NSFC 11173024), the National Basic Research Program of China (2009CB824800, 2012CB821800), NSC 99-2112-M-007-017-MY3, and the Fundamental Research Funds for the Central Universities. We are very grateful for the anonymous referee for critic comments, which has changed the quality of the paper.References
- [1] Abramowicz, M. A., Karas, V., Kluzniak, W., Lee, W. H., Rebusco, P.: 2003, PASJ 55, 467
- [Barret et al.(2008)] Barret, D., Boutelier, M., & Miller, M. C.: 2008, MNRAS 384, 1519
- [Barret (2005a)] Barret, D., Kluniak, W., Olive, J. F., Paltani, S., Skinner, G. K.: 2005a, MNRAS 357, 1288
- [Barret (2005b)] Barret, D., Olive, J. F., Miller, M. C.: 2005b, MNRAS 361, 855
- [Barret (2005c)] Barret, D., Olive, J. F., Miller, M. C.: 2005c, Astron. Nachr. 326, 808
- [Barret (2006)] Barret, D., Olive, J. F., Miller, M. C.: 2006, MNRAS 370, 1140
- [Barret et al.(2007)] Barret, D., Olive, J. F., Miller, M. C.: 2007, MNRAS 376, 1139
- [2] Belloni, T., Mendez, M., Homan, J.: 2005, A&A 437, 209
- [3] Belloni, T., Méndez, M. & Homan, J.: 2007, MNRAS 376, 1133
- [4] Belloni, T., Psaltis, D., van der Klis, M.: 2002, ApJ 572, 392
- [Boutelier et al.(2009)] Boutelier, M., Barret, D., & Miller, M. C.: 2009, MNRAS 399, 1901
- [Boutelier et al.(2010)] Boutelier, M., Barret, D., Lin, Y., Török, G.: 2010, MNRAS 401, 1290
- [5] Hasinger, G., & van der Klis, M.: 1989, A&A 225, 79
- [6] Hasinger, G.: 1990, RvMA 3, 60
- [7] Kluzniak, W., Abramowicz, M. A.: 2001, Acta Physica Polonica B 32, 3605
- [mendez (2006)] Mndez, M.: 2006, MNRAS 371, 1925
- [8] Mndez, M., van der Klis, M.: 1999, ApJ 517, L51
- [9] Méndez, M., & van der Klis, M. 2000, MNRAS 318, 938
- [10] Méndez, M., van der Klis, M., & Ford, E.C. 2001, ApJ 561, 1016
- [Miller (1998)] Miller, M. C., Lamb ,F. K., Psaltis, D.: 1998, ApJ 508, 791
- [11] Psaltis, D. et al. 1998, ApJ 501, L95
- [12] Psaltis, D. et al. 1999a, ApJ 520, 763
- [13] Psaltis, D., Belloni, T., van der Klis, M.: 1999b, ApJ 520, 262
- [14] Stella, L. & Vietri, M.: 1998, ApJ 492, L59
- [15] Stella, L. & Vietri, M.: 1999, PRL 82, 17
- [16] Stella, L., Vietri, M., Morsink, S. M.: 1999, ApJ 524, L63
- [17] Titarchuk, L. & Wood, K.: 2002, APJ 577, L23
- [Torok (2009)] Trk, G.: 2009, A&A 497, 661
- [van der Klis (2000)] van der Klis, M.: 2000, ARA&A 38, 717
- [van der Klis (2006)] van der Klis, M.: 2006, A review of rapid X-ray variability in X-ray binaries in Compact stellar X-ray sources, W.H.G. Lewin & M. van der Klis (eds. ), Cambridge University Press, p. 39; (astro-ph/0410551).
- [18] van der Klis, M.: 2008, AIPC. 1068, 163
- [19] Wang, J., Zhang C. M., Zhao Y. H., Lin Y. F., Yin H. X., Song L. M.: 2011, A&A 528, 126
- [20] Yu W. F., van der Klis M. 2002, ApJ 567, 67
- [21] Yu W. F., van der Klis M., Jonker P. G. 2001, ApJ 559, 29
- [zhang (2004)] Zhang, C. M.: 2004, A&A 423, 401
- [22] Zhang, C. M., Yin, H. X., Zhao, Y. H., Zhang, F. & Song, L. M.: 2006, MNRAS 366, 1373