Evolution of Chinese airport network
Abstract
With the rapid development of economy and the accelerated globalization process, the aviation industry plays more and more critical role in today’s world, in both developed and developing countries. As the infrastructure of aviation industry, the airport network is one of the most important indicators of economic growth. In this paper, we investigate the evolution of Chinese airport network (CAN) via complex network theory. It is found that although the topology of CAN remains steady during the past several years, there are many dynamic switchings inside the network, which changes the relative relevance of airports and airlines. Moreover, we investigate the evolution of traffic flow (passengers and cargoes) on CAN. It is found that the traffic keeps growing in an exponential form and it has evident seasonal fluctuations. We also found that cargo traffic and passenger traffic are positively related but the correlations are quite different for different kinds of cities.
keywords:
Complex network , Chinese Airport network , Transportation , EvolutionPACS:
89.75.-k , 89.75.Fb , 89.40.Da , 89.40.Dd1 Introduction
Ranging from biological systems to economic and social systems, many real-world complex systems can be represented by networks, including chemical-reaction networks, neuronal networks, food webs, telephone network, the World Wide Web, railroad and airline routes, social networks and scientific-collaboration networks [1, 2, 3]. Obviously, the real networks are neither regular lattices nor simple random networks. Since the small-world network model [4] and the scale-free network model [5] were brought forward at the end of the last century, people find that many real complex networks are actually associated with small-world property and a scale-free, power-law degree distribution. In the past ten years, the theory of complex networks has drawn continuous attention from different scientific communities, such as network modelling [6, 7, 8], synchronization [9, 10], information traffic [11, 12, 13, 14], epidemic spreading [15, 16], cascading failures [17, 18, 19, 20], evolutionary games [21, 22, 23, 24, 25] and social dynamics [26] etc.. One interesting and important research direction is understanding the transportation infrastructures in the framework of complex network theory [27, 28, 29, 30, 31, 32, 33, 34].
With the acceleration of globalization process, the aviation industry plays a more and more critical role in the economy and many scientists pay special attention to the airway transportation infrastructure. Complex network theory is naturally a useful tool since the airports can be denoted by vertex and the flights can be denoted with edges. In the past few years, some interesting researches have been reported to study the airport networks from the view of network theory. For example, Amaral et al. comprehensively investigated the worldwide airport network (WAN). They found that WAN is a typical scale-free small-world network and the most connected nodes in WAN are not necessarily the most central nodes, which means critical locations might not coincide with highly-connected hubs in the infrastructures. This interesting phenomenon inspired them to propose a geographical-political-constrained network model [35, 36]. Vespignani et al. further investigated the intensity of WAN’s connections via the view of weighted networks and they found the correlations between weighted quantities and the topology. They proposed a weighted evolving network model to expand our understanding of weighted features of real systems. Besides, they also proposed a global epidemic model to study the role of WAN in the prediction and predictability of global epidemics [37, 38]. Besides, several empirical works on Chinese Airport Network [39, 40, 41] and Indian Airport Network [42] reveal that the scale of national airport networks can exhibit different properties from the global scale of WAN, i.e., the two-regime power-law degree distribution and the disassortative mixing property.
As the aviation industry is an important indicator of economic growth, it is necessary and more meaningful to investigate the evolution of airport network. Recently, Gautreau et al. studied the US airport network in the time period . They found that most statistical indicators are stationary and an intense activity takes place at the microscopic level, with many disappearing/appearing links between airports [43]. Rocha studied the Brazilian airport network (BAN) in the time period . He also found the network structure is dynamic with changes in the relevance of airports and airlines, and the traffic on BAN is doubled during the period while the topology of BAN shrinks [44]. Inspired by their interesting works, we investigate evolution of Chinese Airport Network (CAN) from the year to ( to for detailed traffic information and to for detailed topology information). It is found that the airway traffic volume increases in an exponential form while the topology has no significant change.
The paper is organized as follows. In the next section, the description of CAN data is presented. The statistical analysis of CAN topology is given in Section 3. In Section 4, we analyze evolution of traffic flow on CAN. The paper is concluded by the last section.
2 Development of CAN with Chinese GDP
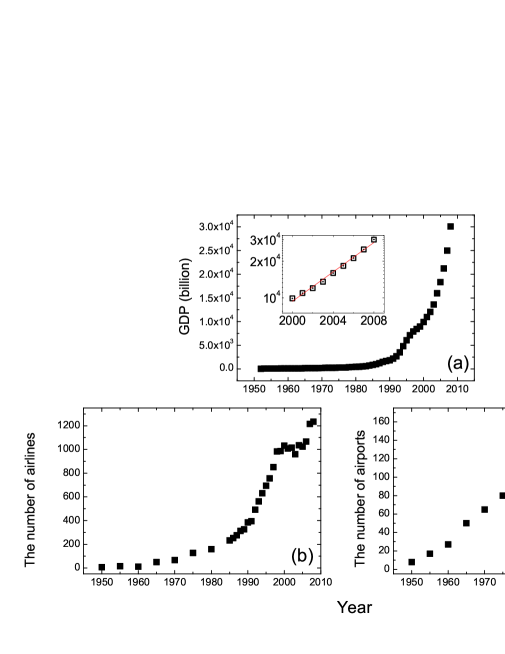
Airport network is the backbone of aviation industry. It includes airports and direct flights linking airport pairs. Since aviation industry is closely related to economy development and China has made a great economic miracle in the past decades, we firstly investigate the development of Chinese economy, airports and flights. Figure 1(a) shows the development of Chinese GDP from to . One can see that it has great increment in the years. Especially, the historic Third Plenary Session of the Eleventh Central Committee was held in , ushering in China’s new historical period of reform and opening up. Since then, Chinese GDP increases faster and boosts in the beginning of century (GDP increases as an exponential form since year , see the inset of Fig.1(a)). However, the development of airlines (Fig.1(b)) and airports (Fig.1(c)) is not in consistent with that of GDP. For the development of airports (Fig.1(c)), one can see that the number of airports grows in , and , but keeps constant in and . The first increasing () mainly makes large prefecture-level cities connected, and the second increasing () mainly makes medium prefecture-level cities connected. The third increasing () is due to the rapid development of Chinese economy and China plans to build more airports by . From Fig.1(b), one can also see that the number of airlines remains constant since and rises again in year and . The steadiness is mainly due to efficiency reason. Opening new airlines means more operating expenses and commercial airline companies prefer to have a small number of hubs where all airlines connect. They would not like to add uneconomical airlines once a mature transportation network is constructed. Thus the number of airlines does not increase continuously. In year and , as many new airports are put into service, many new airlines are naturally launched.
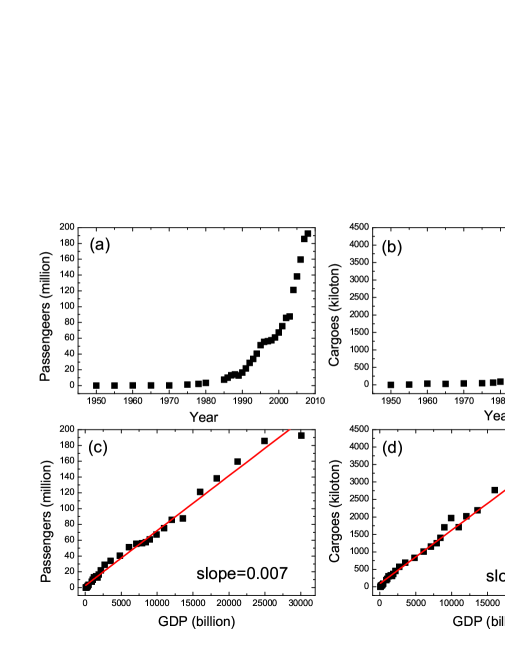
Although the airline infrastructure (e.g., airports and airlines) does not keep growing due to various constraints, the traffic on CAN keeps growing with the GDP. As shown in Figure 2, the traffic (passengers and cargoes) grows almost linearly with GDP. By calculation, one can see that million RMB of GDP can support about passengers and kg cargoes. Moreover, the Chinese aviation industry is also shocked by the global financial crisis. The top Chinese airline companies have reported their operating information of and most important indicators are declining. This has been demonstrated by the annual report of Civil Aviation Administration of China (CAAC) and we can find in Fig.2 that the traffic of is almost the same as that of .
3 Topological properties of CAN
The topology data of CAN are obtained from timetables provided by Civil Aviation Administration of China (CAAC) from to ( timetables for years , and timetable for the second half of and the first half of ). It should be noted that:
-
•
The timetable contains both domestic and international airlines. As we only focus on the domestic information, the international airlines are excluded.
- •
-
•
Airports in one city are view as one airport. For instance, there are airports in Shanghai and Chengdu, and airports in Beijing.
-
•
The timetables are not perfectly in consistent with real flights due to weather or emergencies.
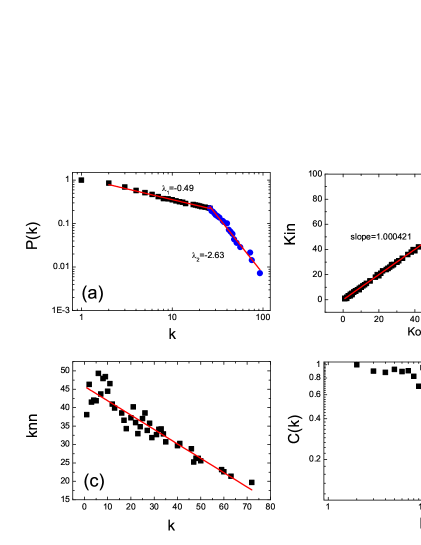
Figure 3 shows some basic topological characteristics of CAN in the first half year of . Fig.3(a) shows the degree distribution of CAN, which follows a two-regime power-law distribution with two different exponents ( and ). We also investigated the directed CAN and it is found that and are almost the same as , where is the ingoing degree and is the outgoing degree. Fig.1(b) shows the correlation between and . One can see that the in-out degree correlation is very strong: the slope is . This means that one can fly from one airport to another and return using the same airline. Another important topological property is the degree-degree correlation. It is defined as the mean degree of the neighbors () of a given airport as a function of the degree of the given airport. Fig.3(c) shows the results of degree-degree correlation of undirected CAN and we can find that the degrees of adjacent airports have significant linear anti-correlation. Fig.3(d) exhibits the relationship of clustering coefficient and degree . As it shows, CAN has a power-law decay of as a function of degree (), which means that CAN is a hierarchical network and lower degree nodes have larger clustering coefficient. All the results above are well in accordance with the results reported by Liu et.al. and Li et.al [39, 40, 41].
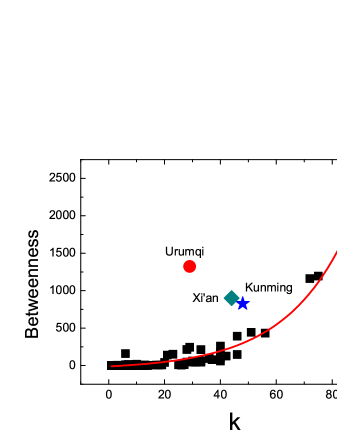
In networks, a node participating more shortest paths is usually more important. Thus the betweenness is proposed to quantify node’s importance in traffic [46]. Figure 4 shows the relation between degree and betweenness. One can see that betweenness generally obeys an exponential function of degree but there exist three nodes whose betweenness is obviously much larger: , and . The three nodes are all located in west China: is the central city of southwest, is the central city of northwest and is the central city of far northwest. The western population needs to be connected to the political centers (e.g., Beijing) and economical centers (e.g. Shanghai and Shenzhen) in the east. However, due to the long distance from western China to eastern China (over kilometers), it is costly and unnecessary to make all western airports directly link to the eastern airports. Thus some transit airports are naturally formed as the bridge between east and west China.
Now we study evolution of topological properties of CAN. It can be seen from Table 1 that topological properties of CAN do not significantly change from to . Similarly, topological properties of Brazilian airport network also do not significantly change during a long period of time [44]. Next we make a comparison between the two networks.
| Year | |||||||||
|---|---|---|---|---|---|---|---|---|---|
| 2002(2) | 13.90 | -0.42 | -2.66 | 13.78 | 13.78 | 0.990 | 0.75 | 2.21 | 5 |
| 2003(1) | 12.85 | -0.44 | -2.79 | 12.71 | 12.71 | 0.988 | 0.70 | 2.24 | 5 |
| 2003(2) | 11.81 | -0.41 | -2.63 | 11.69 | 11.69 | 0.989 | 0.71 | 2.26 | 5 |
| 2004(1) | 12.78 | -0.43 | -2.58 | 12.68 | 12.68 | 0.991 | 0.75 | 2.22 | 4 |
| 2004(2) | 11.70 | -0.45 | -2.53 | 11.61 | 11.61 | 0.991 | 0.77 | 2.23 | 4 |
| 2005(1) | 11.55 | -0.45 | -2.67 | 11.24 | 11.24 | 0.970 | 0.79 | 2.27 | 4 |
| 2005(2) | 12.03 | -0.45 | -2.52 | 11.90 | 11.90 | 0.988 | 0.79 | 2.25 | 4 |
| 2006(1) | 11.71 | -0.47 | -2.77 | 11.66 | 11.66 | 0.995 | 0.77 | 2.28 | 4 |
| 2006(2) | 12.55 | -0.46 | -2.81 | 11.94 | 11.94 | 0.944 | 0.81 | 2.22 | 4 |
| 2007(1) | 12.33 | -0.45 | -2.52 | 12.23 | 12.23 | 0.991 | 0.79 | 2.28 | 4 |
| 2007(2) | 12.85 | -0.47 | -2.96 | 12.88 | 12.88 | 0.994 | 0.79 | 2.25 | 4 |
| 2008(1) | 13.22 | -0.47 | -2.64 | 13.38 | 11.37 | 0.990 | 0.78 | 2.23 | 4 |
| 2008(2) | 12.06 | -0.46 | -2.70 | 11.96 | 11.96 | 0.991 | 0.76 | 2.29 | 4 |
| 2009(1) | 13.07 | -0.49 | -2.63 | 12.97 | 12.97 | 0.991 | 0.79 | 2.27 | 4 |
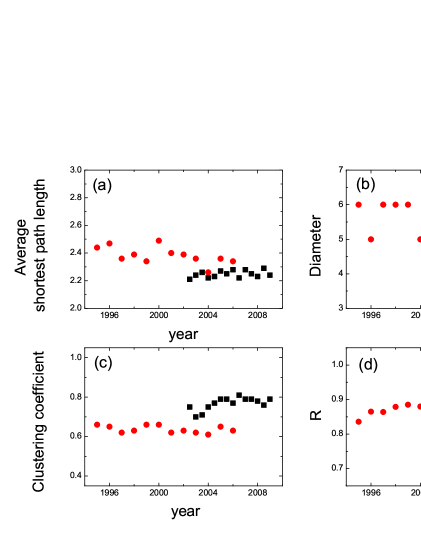
Fig.5(a) compares average shortest path length of CAN and BAN. One can see that of CAN is around and is slightly smaller than that of BAN. Fig.5(b) shows the diameter , which is also slightly smaller in CAN. This means that CAN is more convenient for passengers. Table gives detailed results of shortest paths of CAN in the first half year of . About paths are direct connections and over paths consist of no more than flights. Fig.5(c) shows that average clustering coefficient of CAN is apparently larger than that of BAN and Fig.5(d) shows that CAN is more reciprocal than BAN.
| Shortest Path | Number of Paths | Percentage of Paths | Number of Flights to be changed |
| 1 | 902 | 9.54 | 0 |
| 2 | 5561 | 58.83 | 1 |
| 3 | 2853 | 30.18 | 2 |
| 4 | 137 | 1.45 | 3 |
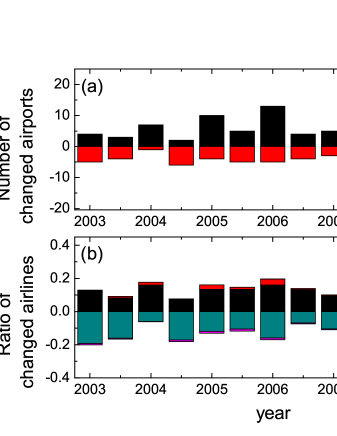
From discussions above, we know that CAN is an asymmetric small-world network with a two-regime power-law degree distribution, a high clustering coefficient, a short average path length, a negative degree-degree correlation, a negative clustering-degree correlation and an exponential betweenness-degree correlation. Although the topology characteristics of CAN is quite steady from year to , a dynamic switching process underlies the evolution of CAN. Figure 6 shows the measured fluctuation of CAN from year to . Fig.6(a) shows the fluctuation of airports and we can see that the fluctuation (including the added airports and removed airports) is usually between and . But for the second half year of and the first half year of , the fluctuation is evidently more vigorous. Fig.6(b) shows that the percentage of changed airlines is usually smaller than and the majority of changes is mainly induced by and . But for the second half year of and the first year of , when many airports were added and removed, and becomes the majority of changes.
4 The traffic of CAN
This section investigates evolution of traffic on CAN.
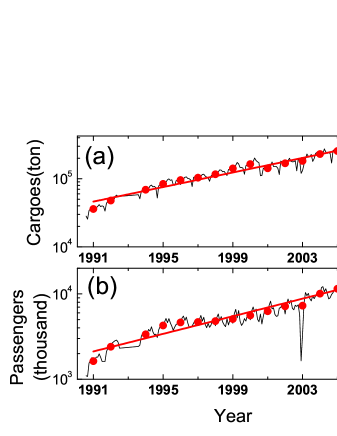
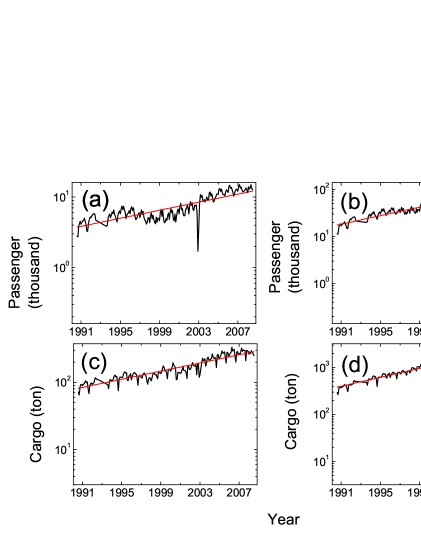
As shown in Figure 7, the traffic (including cargoes and passengers) has evident seasonal fluctuations as in the United States. If the seasonal fluctuations are averaged out, one finds that the traffic of CAN increases exponentially, much faster than that of the United States (as shown in Ref.[43], the passenger data of the U.S. can be linearly fitted). We can also observe similar growth (Figure 8) of the average traffic per-link and per-node. It is found that the average traffic of CAN has increased about during the years while the average passenger traffic of the U.S. has only increased about during the years ( to ). It is worth noting that there exists a sudden drop of passenger traffic in year (see Fig.7(b), Fig.8(a) and Fig.8(b)). This is mainly induced by the Severe Acute Respiratory Syndrome (SARS). However, the cargo traffic was not knocked by SARS (see Fig.7(a), Fig.8(c) and Fig.8(d)).
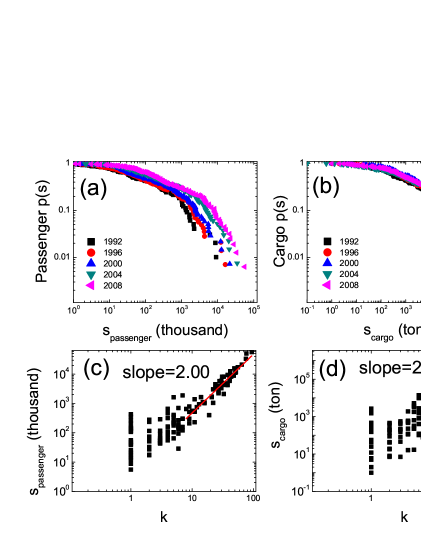
Figure 9 displays the cumulative distribution of nodes’ strength , namely the throughput of each airport including passengers (, see Fig.9(a)) and cargoes (, see Fig.9(b)). The distributions are quite broad: orders of magnitude for passengers and for cargoes. The correlations of and are also presented. Fig.9(c) shows the dependence of on , and Fig.9(d) shows the dependence of on in year . One can find that there exists a clear non-linear behavior denoting a strong correlation between strength and topology: and . We also examined the data from year to and the results are similar.
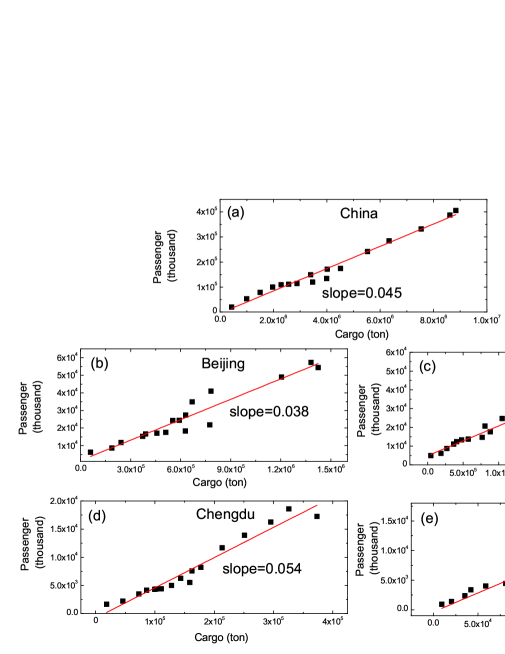
Figure 10 shows the correlations of cargo traffic and passenger traffic from year to . One can find a strong linear correlation between cargo traffic and passenger traffic for both the total traffic of CAN and the traffic of a single airport/city. However, the ratios of cargo traffic and passenger traffic are quite different. As shown in Fig.10(a), the slope is for the total traffic of CAN. For municipalities Beijing (Fig.10(b)) and Shanghai (Fig.10 (c)), the slopes are obviously smaller. Because Beijing and Shanghai are the most important central cities of politics and economy and culture of China, they are aggregating centers and distributing centers for over of Chinese goods flow (only of Chinese passenger flow). For tourism cities Chengdu (Fig.10(d)) and Kunming (Fig.10(e)), the slopes are obviously larger, indicating that the passenger traffic is more active in these two cities.
5 Conclusion
In summery, we investigate the evolution of Chinese airport network (CAN), including the topology, the traffic and the interplay between them. We find that, though the main topological indicators are quite stationary, there exists a dynamic switching process inside the network (airports added and removed, airlines added and removed). Moreover, the traffic flow (including passengers and cargoes) on CAN is studied. The traffic grows at an exponential rate with seasonal fluctuations, and the traffic throughput of an airport has a nonlinear correlation with its degree. Moreover, our comparative studies show that cargo traffic and passenger traffic are positively related, but with different ratioes for different kinds of cities. Our work provides insights in understanding the evolution of national airport network.
Acknowledgement
We thank Gang Yan, Rui Jiang and Mao-Bin Hu for their useful discussions. This work is supported by the National Science Foundation for Distinguished Young Scholars of China (No.60625102) and the Foundation for Innovative Research Groups of the National Natural Science Foundation of China (No.60921001).
References
- [1] R. Albert and A.-L. Barabási, Rev. Mode. Phys. 74 (2002) 47.
- [2] S. Boccaletti, V. Latora, Y. Moreno, M. Chavez and D.-U. Hwang, Phys. Rep. 424 (2006) 175.
- [3] M.E.J. Newman, SIAM Review 45 (2003) 167.
- [4] D.J. Watts and S.H. Strogatz, Nature 393 (1998) 440.
- [5] A.-L. Barabási and R. Albert, Science 286 (1999) 509.
- [6] A. Barrat, M. Barthélemy, and A. Vespignani, Phys. Rev. Lett. 92(2004) 228701 .
- [7] W.-X. Wang, B.-H. Wang, B. Hu, G. Yan, and Q. Ou, Phys. Rev. Lett. 94 (2005) 118702.
- [8] T. Zhou, G. Yan and B.-H. Wang, Phys. Rev. E 71 (2005) 046141.
- [9] A. Arenas, A. Diaz-Guilera, J. Kurths, Y. Moreno and C.-S. Zhou, Phys. Rep. 469 (2008) 93.
- [10] G. Yan, Z.-Q. Fu, J. Ren and W.-X. Wang, Phys. Rev. E 75 (2007) 016108.
- [11] G. Yan, T. Zhou, B. Hu, Z.-Q. Fu and B.-H. Wang, Phys. Rev. E 73 (2006) 046108.
- [12] W.-X. Wang, C.-Y. Yin, G. Yan and B.-H. Wang, Phys. Rev. E 74 (2006) 016101.
- [13] A. Arenas, A. Díz-Guilera and R. Guimerà, Phys. Rev. Lett. 86 (2001) 3196.
- [14] Z.-X. Wu, W.-X. Wang and K.H. Yeung, New J. Phys. 10 (2008) 023025.
- [15] G. Yan, T. Zhou, J. Wang, Z.-Q. Fu and B.-H. Wang, Chin. Phys. Lett. 22 (2005) 510.
- [16] R. Pastor-Satorras and A. Vespignani, Phys. Rev. Lett. 86 (2001) 3200.
- [17] W.-X. Wang and G. Chen, Phys. Rev. E 77 (2008) 026101.
- [18] L. Huang, K. Park, Y.-C. Lai, L. Yang and K.-Q. Yang, Phys. Rev. Lett. 97 (2006) 164101.
- [19] D. J. Watts, Proc. Natl. Acad. Sci. U.S.A. 99 (2002) 5766.
- [20] J.-W. Wang and L.-L. Rong, Physica A 388 (2009) 1731.
- [21] G. Szabó and G. Fáth, Phys. Rep. 446 (2007) 97.
- [22] A. Szolnoki and M. Perc, New J. Phys. 10 (2008) 043036.
- [23] A. Szolnoki, M. Perc and Z. Danku, Europhys. Lett. 84 (2008) 50007.
- [24] Z.-H. Rong, X. Li and X.-F. Wang, Phys. Rev. E 76 (2007) 027101.
- [25] Z.-X. Wu, J.-Y. Guan, X.-J. Xu and Y.-H. Wang, Physica A 379 (2007) 672.
- [26] C. Castellano, S. Fortunato and V. Loreto, Rev. Mod. Phys. 81 (2009) 591.
- [27] W.-S. Jung, F.-Z. Wang and H.E. Stanley, Europhys. Lett. 81 (2008) 48005.
- [28] V. Latora and M. Marchiori, Physica A 314 (2002) 109.
- [29] K.A. Seaton and L.M. Hackett, Physica A 339 (2004) 635.
- [30] J. Sienkiewicz and J.A. Holyst, Phys. Rev. E 72 (2005) 046127.
- [31] D. Brockmann, L. Hufnagel and T. Geisel, Nature 439 (2006) 462.
- [32] Y.-Z. Chen, N. Li and D.-R. He, Physica A 376 (2007) 747.
- [33] L.-P. Chi and X. Cai, Int. J. Mod. Phys. B 18 (2004) 2394.
- [34] W. Li and X. Cai, Physica A 382 (2007) 693.
- [35] L.A.N. Amaral, A. Scala, M. Barthélemy and H.E. Stanley, Proc. Natl. Acad. Sci. USA 97 (2003) 11149.
- [36] R. Guimerà, S. Mossa, A. Turtschi and L. A. N. Amaral, Proc. Natl. Acad. Sci. USA 102 (2005) 7794.
- [37] A. Barrat, M. Barthélemy, R. Pastor-Satorras and A. Vespignani, Proc. Natl. Acad. Sci. USA 101 (2004) 3747.
- [38] V. Colizza, A. Barrat, M. Barthélemy and A. Vespignani, Proc. Natl. Acad. Sci. USA 103 (2006) 2015.
- [39] W. Li and X. Cai, Phys. Rev. E 69 (2004) 046106.
- [40] H.-K. Liu and T. Zhou, Acta Phys. Sin. 56 (2007) 106.
- [41] H.-K. Liu, X.-L. Zhang, L. Cao, B.-H. Wang and T. Zhou, Sci. Chi. Ser. G 39 (2009) 935.
- [42] G. Bagler, Physica A 387 (2008) 2972.
- [43] A. Gautreau, A. Barrat and M. Barthélemy, Proc. Natl. Acad. Sci. USA 106 (2009) 8847.
- [44] L.E.C. da Rocha, J. Stat. Mech. (2009) P04020.
- [45] Statistical Data on Civil Aviation of China 1992-2009 (Chinese Civil Aviation Press). This book of year is out of print.
- [46] L.C. Freeman, Social Networks 1 (1979) 215.