2009 Vol. 9 No. XX, 000–000
\vs\noReceived [year] [month] [day]; accepted [year] [month] [day]
Metallicity calibration for solar type stars based on red spectra
Abstract
Based on high resolution and high signal-to-noise ratio (S/N) spectra analysis of 90 solar type stars, we have established several new metallicity calibrations in range [5600, 6500] K based on red spectra with the wavelength range of 560-880 nm. The new metallicity calibrations are applied to determine the metallicity of solar analogs selected from SDSS spectra. There is a good consistent result with the adopted value presented in SDSS-DR7 and a small scatter of 0.26 dex for stars with S/N 50 is obtained. This study provides a new reliable way to derive the metallicity for solar-like stars with low resolution spectra. In particular, our calibrations are useful for finding metal-rich stars, which are missing in SSPP.
keywords:
techniques: radial velocities - stars: temperatures - stars: abundances1 Introduction
The stellar spectroscopic survey with the Large Area sky Multi-Object fiber Spectroscopic Telescope (LAMOST) will provide a huge amount of data, which can be used for the study of chemical and kinematical evolution of our Galaxy. In this respect, stellar metallicity and radial velocity, being two main parameters, can be derived from spectra. The determination of radial velocity is generally easier mainly by using either cross-correlation of the template spectra or Doppler shift through line calibration. The consistency is usually quite good depending on the quality of the spectra. The metallicity estimation from stellar spectra is based on various methods as shown in Lee et al. (2008a) (hereafter Lee08). However, for solar type stars, these values can be underestimated by up to 0.5 dex in the previous version of SSPP (SEGUE Stellar Parameter Pipeline; Lee et al. 2008a). The current version of SSPP has made great improvement, reaching about 0.1 dex in the underestimation (Lee et al. 2008b). From Fig A1 in Bond et al. (2009), the largest difference between the SDSS (Sloan Digital Sky Survey; York et al. 2001) spectroscopic metallicity values with DR6 (Data Release 6; Adelman-McCarthy et al. 2008) and DR7 (Data Release 7; Abazajian et al. 2009) is shown for solar type stars, so it is worth the effort to do more research about deriving the metallicty of those stars.
In this work, we attempt to establish a new metallicity calibration for low resolution solar type stars based on the result from high resolution and high signal-to-noise ratio spectral analysis performed by Chen et al. (2000, hereafter Chen00). In comparison with the methods presented in Lee08, this work has some advantages. Firstly, the calibration is based on the real stellar (empirical) spectra and their metallicity is derived from fine analysis of high resolution and high S/N spectra. Secondly, we have used the red spectral coverage of 560-880 nm but most of the methods in Lee08 are based on blue spectra with nm. As is well known, the advantage of the red spectra is easier to define continuum, which is not possible for blue spectra due to the heavy line blanketing at low resolution observations. In view of this advantage, we adopted the equivalent widths (EW) of individual lines in the calibration instead of the line index. As for line index, there might be different definition for different authors while EW is a fixed value. For example, CaII K line, there are K6, K12 and K18 among its definition. If we can define the continuum well, the EW is better than line index. Thirdly, we have adopted only Fe lines for metallicity calibration and avoid contributions from other elements, which do not exactly trace iron evolution at different times and different nucleosynthesis sites. In Lee08, the wavelength ranges of templates match include all lines from different elements. The KP line index is also an indicator of [Ca/H]. Although these weak Fe lines are undetectable in metal-poor stars because of the noise, we can recognize them in solar type stars where the S/N is higher than 20. Moreover, the EW of weak lines is more sensitive to abundance than that of strong lines. For high resolution spectra analysis, strong lines, e.g. Na 5895 and Na 5890 are saturated and in the growth curve the increasing EWs do not give higher abundance. In general, the EW of strong lines does not change a lot with the degradation of resolution. In view of this, it is not optimal to establish relation between abundance and EW in combination with colors using very strong line. Finally, the calibration is internally consistent, while Lee08 adopted the average of different values from various methods.
In Section 2, a description of the data for the calibration is presented. The template matching analysis is described in Section 3. The detailed analysis procedure to get the calibration formula is given in Section 4. The application of the calibration to SDSS spectra is illustrated in Section 5. Finally, the conclusion is given in Section 6.
2 Data
The real spectra are taken from Chen00 which has a resolving power of 37 000 and S/N of 150-300 obtained with the Coud Echelle Spectrograph mounted on the 2.16 m telescope of the National Astronomical Observatories (Zhao Li 2001). The sample has , log and [Fe/H] distributions as shown in Fig. 1. It is clear that ranges between [5600, 6500], log is in [3.98, 4.43] and [Fe/H] is in [-1.04, 0.06]. Moreover, the range of b-y is within [0.28, 0.43], B-V is within [0.40, 0.67], V-I is within [0.46, 0.73] and V-K is within [0.9, 1.65]. We convolved the normalized spectra to low resolution of 2000 with a Gaussian Function. In addition, the spectra were rebinned to 1.5 after smoothed to R2000.

| wavelength range(nm) | mean deviation | scatter |
|---|---|---|
| 570-653 | 0.448 | 0.175 |
| 570-684 | 0.226 | 0.275 |
| 570-700 | 0.016 | 0.230 |
| 640-670 | 0.470 | 0.280 |
| 651-662 | 0.599 | 0.390 |
| 690-713 | -0.07 | 0.590 |
| 735-756 | 0.350 | 0.290 |
| 772-810 | -0.100 | 0.260 |
3 The template match analysis
Following one method of Lee08, we have performed the template spectra match (also see Allende et al 2006, Re Fiorentin et al 2007, Zwitter et al. 2005) for the normalized low resolution spectra of 90 stars and derived the stellar temperature, gravity and metallicity. In this method, we generate a library of low resolution theoretical spectra by using the SYNTH program based on Kurucz New ODF (Castelli Kurucz 2003) atmospheric models. The atmosphere models are under the assumption of local thermodynamic equilibrium (LTE). The mixing-length is adopted to be lHp = 1.25 and microturbulence is 1.5 km s-1. The line list, including the atoms and molecules, are all from Kurucz (1993). The molecular species include CH, CN, OH, and TiO. Solar abundances are from Asplund (2005). As for those grids, covers the range [3500-9750]K with 250K interval; log is within [1.0, 5.0] dex with 0.5 dex interval; [Fe/H] is within [-4.0, -3.0] dex with 0.25 dex interval and 0.1 dex interval in [-3.0,+0.5] dex. The minimum distance method is applied to obtain the parameters by interpolation among several of the closest theoretical spectra with the observed one.

We have adopted different wavelength ranges in the matching procedure and obtained different results as shown in Table 1. As compared with the ‘standard’ values presented in Chen00 paper, we have found that the spectral range of 570-700 nm is the best choice with a mean deviation of 0.016 dex and scatter of 0.23 dex in [Fe/H]. The comparison of temperature and metallicity of the 570-700 nm spectral range is shown in Fig. 2. It is clear that the temperature estimation has systematical deviation with a lower value in the present work. Since the high resolution spectra in Chen00 are obtained with echelle spectrograph. The order is not wide enough to include the whole H alpha line region and the normalization is implemented order by order. Thus, the continuum is not very reliable in H alpha region, which might be the reason of systematical deviation in temperature estimation. The metallicity is quite consistent with an rms of 0.23 dex.
4 [Fe/H] vs. EW of the FeI line - An empirical calibration
Although the template match method can be used to obtain accurate stellar parameters, it may give different results with different wavelength ranges. Hence, we will determine stellar metallicity based on the strength of some FeI lines.

| Left | Right | Center | Element |
|---|---|---|---|
| 6060.917 | 6069.954 | 6065.492 | FeI |
| 6217.769 | 6221.788 | 6219.292 | FeI |
| 6391.147 | 6395.953 | 6393.605 | FeI |
| 6398.256 | 6402.209 | 6400.232 | FeI |
| 6675.000 | 6682.326 | 6678.256 | FeI |
4.1 The spectral lines selection
What we want is to choose some Fe lines that are not heavily blended and have better profiles in the low resolution (R2000) spectra. At the beginning, we draw the original spectrum, then overplot the low resolution spectrum on it. After checking the lines one by one, we select five FeI lines as our indices of metallicity. The spectral lines for three stars with different metallicity values are given in Fig. 3: HD94280 has [Fe/H] of 0.06; HD100446 has -0.48; HD184601 has -0.81. In Fig. 3, the solid line is the high resolution spectrum while the thick dotted line is that of the low resolution one. In this segment of the spectrum, only two FeI lines meet our requirements since they are detectable; they have good shapes and are not seriously blended in the spectra with a resolution of R2000. From the top to the bottom of Fig. 3, it is obvious that the strength of FeI lines decreases. Also, for stars with [Fe/H] -0.8, the two lines can be identified. Table 2 presents the definition of five FeI line indices used for our metallicity calibration. There are three parts for each line including red, center and blue spectra. The EW of each line can be measured by using a direct integration method.

| Lines | a | b | |
|---|---|---|---|
| FeI1 | -0.922 | 5.063 | 0.170 |
| FeI2 | -0.866 | 6.559 | 0.143 |
| FeI3 | -1.010 | 5.960 | 0.167 |
| FeI4 | -0.970 | 4.958 | 0.163 |
| FeI5 | -1.026 | 6.056 | 0.204 |
| Lines | a | b | c | |
|---|---|---|---|---|
| FeI1 | 1.731 | 5.929 | -3.281 | 0.150 |
| FeI2 | 2.138 | 7.726 | -3.692 | 0.112 |
| FeI3 | 2.282 | 7.386 | -4.116 | 0.136 |
| FeI4 | 2.793 | 6.381 | -4.702 | 0.122 |
| FeI5 | 0.974 | 6.949 | -2.505 | 0.194 |
4.2 The metallicity calibration based on EWs
Since our spectra are normalized and there are no spectra with flux calibration, it is difficult to derive reliable temperature measurements. In order to improve the metallicity determination, we resort to using the strengths of iron lines and establish a calibration between metallicity and EWs of iron lines. The EWs are derived with Equation 1.
| (1) |
In Equation1, the fλ represents the flux of wavelength , while fc means the continuum of wavelength . It is shown in Fig. 4 that there is a good correlation between [Fe/H] and EWs for the five FeI lines for stars whose [Fe/H] -0.8. The calibration (Equation 2) for each line is shown in Table 3.
| (2) |
As seen in Fig. 4, FeI2 and FeI4 show the best result with the lowest scatter in the relation. To show the temperature effect of EW, we divide the temperature range into three parts. The first part is the range of [5265, 5900]; the second part is [5900, 6200] and the last part is [6200, 6496]. In Fig. 5, the stars in first part are given with the sign of the dot and asterisks represent the stars in second part, while the stars in last part are plotted with diamonds. From Fig. 5, it is clear that the relation between EW and [Fe/H] changes with temperature. FeI2 and FeI4 have lower scatter than other FeI lines and this may be due to the lower sensitivity of line strength with temperature. In order to understand this issue, we added the temperature term in the calibration in Fig. 6. The coefficients and scatter of each line are given in Table 4. It is obvious that the becomes small for the calibration of each line after considering the effect of temperature. Since the temperature is usually unknown in the spectra analysis, it may be good to replace the temperature term with the color index. Thus, we collected (b-y), (B-V), (V-I) and (V-K) and performed a similar calibration (Equation 3). log also will bring more or less uncertainty on metallicity determination. However, the gravity range considered in the calibration sample is narrow, hence its effect is very little and could be ignored.
Table 5 is the coefficients and scatter of the calibration of [Fe/H] through EW and B-V.
| Lines | a | b | c | EW range | |
|---|---|---|---|---|---|
| FeI1 | -0.790 | 5.351 | -0.315 | 0.169 | 0.0250.225 |
| FeI2 | -0.290 | 8.144 | -1.342 | 0.132 | 0.0060.158 |
| FeI3 | -0.555 | 7.352 | -1.167 | 0.160 | 0.0440.185 |
| FeI4 | -0.321 | 6.622 | -1.643 | 0.151 | 0.0290.224 |
| FeI5 | -1.200 | 5.497 | 0.453 | 0.202 | 0.0460.193 |
| (3) |


4.3 Calibration in Miles spectra library
To make an external calibration, we selected 107 spectra from the Miles spectral library (Sánchez-Blázquez et al. 2006; Cenarro et al. 2007) which meet the following conditions: -0.8 [Fe/H] 0.5; 4.0 log 4.5; 5600 6500. Thus, it is available to estimate the metallicity of these 107 spectra using above calibrations. The resolution of Miles spectra is about 2.3 and the wavelength has already been calibrated with radial velocity. First, we do normalization for these 107 spectra. The continuum is determined by iteratively smoothing with a Gaussian profile, and then clipping off points that lie beyond 1 or 4 above the smooth curve. Second, the EWs of five FeI lines are measured. B-V of those 107 stars are taken from the literature identified by the Simbad Astronomical Database (Genova 2006). Finally, the metallicities are derived by EW of FeI4 line using equation 3 (the coefficients is shown in Table 5). Fig. 7 is [Fe/H] comparison between our results and those from Miles library. The mean error is about 0.08 dex, and the scatter is about 0.21 dex. [Fe/H] of Miles library is obtained by the compilation from the literature. This suggests that our metallicity is basically consistent with that of other work.
5 Application of these calibrations
In order to check the accuracy of [Fe/H] calibration from the EW of five FeI lines, we implement this calibration to determine [Fe/H] for solar-like stars with SDSS spectra. The selection limitation is as follows: , , , and . The above color ranges come from the color of the Sun and its error bars. Based on this limitation, 4356 stars are extracted from the SDSS DR7 archive. Fig. 8 presents the information of this sample, from which we can see the peak of S/N is 20; the effective temperature of most stars is located in the range of [5500, 6000]K; log is in [4.0, 4.5]. By transforming equation of Bilir et al. (2005), the g-r range of Chen00 is [0.197, 0.501], so it is available to estimate the metallicity of these solar-like stars using Equation 2 and Equation 3.
5.1 Preprocess
Our first preprocessing procedures mainly include radial velocity correction and normalization. The value of radial velocity comes from the FIT head of each spectra. The pseudocontinuum is determined with the same method illustrated in Sec. 4.3. Although the method of pseudocontinuum determination is different with that in Chen00, it is good enough for solar type stars in the red spectral region. Since the SDSS spectra are relative flux calibrated, the pseudocontinuum in red region is easier represented by a lower order polynomial. Thus, iteratively smoothing with a Gaussian profile to original spectrum will get a good continuum shape. After normalization, then the EW of the lines can be measured by the direct integration method. Fig. 9 is an example of the SDSS spectrum. ‘a’ is the original spectrum while ‘b’ is the normalized spectrum. ‘c’, ‘d’, ‘e’ and ‘f’ present the FeI lines in our calibration. It is clear that these FeI lines are detectable and show a good profile in the SDSS spectra.

5.2 Calibration
After obtaining the EW of five FeI lines, [Fe/H] can be determined by our calibration formula. We do some comparison between [Fe/H] from our calibration and those from SSPP. Equation 4 is the calibration formula based on the FeI4 line. B-V can be obtained from g-r transformation (Bilir et al. 2005). Fig. 10 is [Fe/H] comparison between those from SSPP and the results from Equation 4. The comparison of stars with S/N 50 is shown in the top panel and the difference distribution is given in bottom panel. It is clear that our calibration from Equation 4 is very consistent with [Fe/H] of SSPP for those with S/N 50. The mean difference is about 0.018 dex and the scatter is around 0.26 dex.
| (4) |
Moreover, we extract 51 stars which meet these conditions: [Fe/H]0 from our result; [Fe/H] from SSPP; S/N. So these 51 stars are metal rich stars if our result is right. As for these 51 stars, the temperature range is about [5650, 5865]K and the gravity range is in [4.3, 4.5] dex. To check the reliability of our result, we make a comparison between the strength of some spectral lines in these stars and those in the Sun since and log of these stars are very close to those of the Sun. If the strength is stronger than that of the Sun then this star can be regarded as a metal rich star and its [Fe/H] is larger than 0. Since the NaI and CaII line are strong in the red band, these lines, as well as two FeI lines, are selected for comparison. There are three cases: one is that the strengths of these lines are all stronger than those of the Sun (see Fig. 11); one is that the strengths of these lines are all close to those of the Sun (See Fig. 12); the others are taken as the third case (See Fig. 13). After comparison, there are 33 stars in first case, 10 stars in second case and 8 stars in third case. In view of this, the metal rich stars account for 84% of these 51 stars. So our calibration also provides a reliable way to identify metal rich stars.


5.3 The effect of S/N
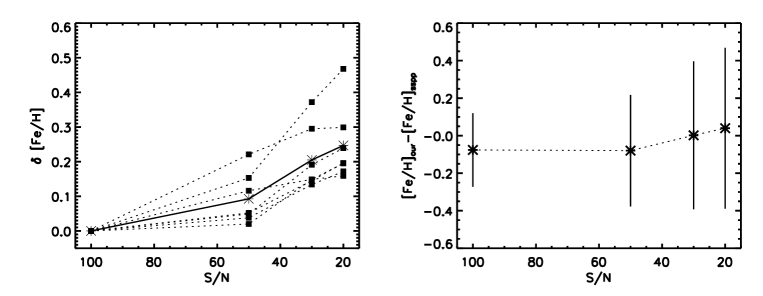
To investigate the S/N effect on our calibration, we selected seven spectra from DR7 with S/N (r band) 100. By introducing Gaussian noise in these spectra, we degraded them to S/N of 50, 30, and 20, respectively. Then, normalization and EW measurement were carried out to all spectra. Finally, the metallicity were derived with our above calibration. The left panel of Fig. 14 presents the S/N effect on metallicity change. Filled squares represent [Fe/H] changes for these seven stars with different S/N. Asterisks represent the average [Fe/H] changes for the given S/N. It can be seen that [Fe/H] changes about 0.22 dex from S/N = 100 to 20. [Fe/H] differences between our calibration results and those of SSPP vs. S/N are shown in right panel of Fig. 14. Asterisks are average differences and vertical lines represent scatters for the given S/N for these seven stars. Average [Fe/H] differences nearly keep the same while the scatter will be smaller than 0.4 dex when S/N is higher than 30. To sum up, our metallicity determination is quite robust to reductions in S/N.
6 Conclusions
For solar type stars, although template matching can derive reliable results with a suitable wavelength range, it is very difficult to determine the most appropriate wavelength range for matching.
We selected five FeI lines from the red part of the R2000 resolution spectra. These lines, which have a good profile, are not seriously blended and could be detectable with [Fe/H] -0.8. At the beginning, the metallicity calibrations are set up only through the EW and the scatters are from 0.14 to 0.20 dex. The dispersion becomes small after adding the temperature into the calibrations. Since the temperature is usually unknown in the spectra analysis, it may be good to replace the temperature term with the color index. In view of this, several metallicity calibrations are constructed by the EW of FeI lines and colors based on the 90 solar type stars. The dispersion of all the calibrations is smaller than 0.21 dex. Among the five FeI lines, FeI2 and FeI4 have contributed the better calibrations (Equation 5-6) which have smaller scatters (0.13 dex, 0.15 dex).
| (5) |
| (6) |
Moreover, we use the calibration from the EW of FeI4 and the B-V to estimate [Fe/H] of the solar type stars in DR7. After comparing with the value from SSPP, our method gives a good consistency for S/N larger than 50. In addition, we analyze the stars for which [Fe/H] by the spectral lines comparison and found that 84% of them are reliable. Usually, [Na/Fe]=0 [Ca/Fe]=0 for most stars with [Fe/H] -0.4 in the solar neighborhood. In view of this, Na and Ca lines are stronger in Fe-rich stars. So this provides a new formula to estimate [Fe/H] with the red band and presents a reliable way to identify metal rich stars.
Acknowledgements.
This work is supported by the National Natural Science Foundation of China under grant Nos. 10673015, 10821061, 10973021, 11078019 and 11073026, the National Basic Research Program of China (973 program) No. 2007CB815103/815403, the Academy program No. 2006AA01A120 and the Youth Foundation of the National Astronomical Observatories of China. Many thanks to James Wicker for his help revising English grama of this paper.References
- Abazajian (2009) Abazajian K., et al. 2009, ApJS, 182, 543
- Ademan-McCarthy (2008) Adelman-McCarthy J. K., et al., 2008, ApJS, 175, 297
- Allende (2006) Allende P. C., Beers T. C., Wilhelm R., Newberg H. J., Rockosi C. M., Yanny B., Lee Y. S., 2006, ApJ, 636,804
- Allende (2008) Allende P. C., Sivarani T., Beers T. C., Lee Y. S., Koesterke L., Shetrone M., Sneden C., Lambert D. L., Wilhelm R., Rockosi C. M., Lai D. K., Yanny B., Ivans I. I., Johnson J. A., Aoki W., Bailer-Jones C. A. L., Re Fiorentin P., 2008, AJ ,136, 2070
- Asplund (2005) Asplund M., 2005, AR, 43, 481
- Bilir (2005) Bilir S., Karaali S., Tuncel S., 2005, AN, 326, 321
- Bond (2009) Bond N. A., Ivezic Z., Sesar B., Juric M., Munn J., 2009, arXiv:0909.0013
- Castelli (2003) Castelli F., Kurucz, R. L. 2003, Modelling of Stellar Atmospheres (IAU Symp. 210), ed. N. Piskunov, W. W. Weiss, D. F. Gray (San Francisco, CA: ASP), 20P
- Cenarro (2007) Cenarro A. J., Peletier R. F., Sánchez-Blázquez P., Selam S. O., Toloba E., Cardiel N., Falcón-Barroso J., Gorgas J., Jiménez-Vicente J., Vazdekis, A., 2007, MNRAS, 374, 664
- Chen (2000) Chen Y. Q., Nissen P. E., Zhao G., Zhang H. W., Benoni T., 2000, A&AS, 141, 491
- Genova (2006) Genova F., 2006, Centre de Donnes astronomiques de Strasbourg http://simbad.ustrasbg.fr
- Lee (2008a) Lee Y. S., Beers T. C., Sivarani T., Allende P.C., Koesterke L., Wilhelm R., Re Fiorentin P., Bailer-Jones C. A. L., Norris J. E., Rockosi C. M., Yanny B., Newberg H. J., Covey K. R.,Zhang H. T., Luo A. L., 2008, AJ, 136, 2022
- Lee (2008b) Lee Y. S., Beers T. C., Sivarani T., Johnson J. A., An D., Wilhelm R., Allende P. C., Koesterke L., Re Fiorentin P., Bailer-Jones C. A. L., Norris J. E., Yanny B., Rockosi C., Newberg H. J., Cudworth K. M., Pan K., 2008, AJ, 136, 2050
- Re Fiorentin (2007) Re Fiorentin P., Bailer-Jones C. A. L., Lee Y. S., Beers, T. C., Sivarani T., Wilhelm R., Allende P. C., Norris J. E., 2007, A&A, 467, 1373
- York (2000) York D. G., et al., AJ, 2000, 120, 1579
- Sánchez-Blázquez (2003) Sánchez-Blázquez P., Peletier R. F., Jiménez-Vicente J., Cardiel N., Cenarro A. J., Falcón-Barroso J., Gorgas J., Selam S., Vazdekis A, 2006, MNRAS, 371, 703
- Zwitter (2005) Zwitter T., Munari U., Siebert A., 2005, ESASP, 576, 623
- Zhao (2001) Zhao G., & Li H. B., 2001, Chinese J. Astron. Astrophys., 1, 555