Shock-induced star cluster formation in colliding galaxies
Abstract
We studied the formation process of star clusters using high-resolution -body/smoothed particle hydrodynamcs simulations of colliding galaxies. The total number of particles is for our high resolution run. The gravitational softening is and we allow gas to cool down to . During the first encounter of the collision, a giant filament consists of cold and dense gas found between the progenitors by shock compression. A vigorous starburst took place in the filament, resulting in the formation of star clusters. The mass of these star clusters ranges from . These star clusters formed hierarchically: at first small star clusters formed, and then they merged via gravity, resulting in larger star clusters.
keywords:
galaxies: star clusters — galaxies: starburst — galaxies: evolution — ISM: evolution — methods: numerical1 Introduction
Merging galaxies contain many young star clusters (e.g., [Whitmore(2003), Whitmore 2003]). These star clusters could potentially evolve into the present day metal-rich globular clusters and so they are widely accepted to be a good candidate for globular cluster progenitors. Galaxy-galaxy merger is therefore considered as one of the formation channels of globular clusters ([Schweizer(1987), Schweizer 1987]).
There have been a number of numerical studies of merging galaxies. There have been, however, only a few numerical studies of star cluster formation in merging galaxies even though it has been shown that resolving a cloudy/multiphase interstellar medium (ISM) and/or clustered star formation can have important consequences for the formation history of early-type galaxies ([Bois et al.(2010), e.g. Bois et al. 2010]). Some of the existing studies adopted sub-grid models of star cluster formation ([Bekki & Couch(2001), Li et al.(2004)Li, Mac Low, & Klessen, e.g., Bekki & Couch 2001; Li et al. 2004]), while more recently their formation has been captured directly (e.g. using the sticky particle method in [Baurnaud+2008, Baurnaud et al. 2008]). Here we report the result of merger simulations that capture the multiphase nature of the ISM and include realistic models of star formation and feedback.
2 Method
We prepared two identical progenitor galaxies and then let them merge from a parabolic and coplanar configuration. The mass of components in one progenitor galaxy is for the dark matter halo, for the stellar disk and for the gas disk. The galaxies are modeled using both -body and smoothed particle hydrodynamics (SPH) particles. We employed particles for the two progenitor galaxies for the finest runs where the corresponding mass of each particle is for both -body and SPH particles.
Numerical simulations were performed by our -body/SPH code, ASURA. We adopted the FAST scheme ([Saitoh & Makino(2010), Saitoh & Makino 2010]) that accelerates the time integration of a self-gravitating fluid by asynchronously integrating gravity and hydrodynamical interactions. In addition, we used a time-step limiter for the time-integration of SPH particles with individual time-steps which enforces the differences of time steps in neighboring SPH particles to be small enough so that the SPH particles can correctly evolve under strong shocks ([Saitoh & Makino(2009), Saitoh & Makino 2009]).
The high mass resolution allows us to adopt the ISM model with the wide temperature range down to and realistic conditions of star formation (, and , where and indicate density, temperature and velocity, respectively). The feedback from type II supernovae (SNe) was also taken into account. These models are the same as those in [Saitoh et al.(2008)Saitoh, Daisaka, Kokubo, Makino, Okamoto, Tomisaka, Wada, & Yoshida, Saitoh et al.(2009)Saitoh, Daisaka, Kokubo, Makino, Okamoto, Tomisaka, Wada, & Yoshida, Saitoh et al. (2008; 2009)].
3 Results
At the first encounter (after from the beginning of the simulations), strong shocks took place. These shocks induced the formation of a large filament of cold and dense gas between the two galaxies. This filament quickly cooled and fragmented to a number of small, high-density clumps, and a large-scale starburst took place in the filament (see [Saitoh et al.(2009)Saitoh, Daisaka, Kokubo, Makino, Okamoto, Tomisaka, Wada, & Yoshida, Saitoh et al. 2009]). This starburst did not take place in previous studies in which gas cooling was inhibited below . This starburst continued for several and was then quenched by the SN feedback. A number of star clusters formed during this starburst.

Figure 1 shows the snapshots of the early phase of the star cluster formation where we can see that a number of small star clusters formed along the gas filament. The late phase of the star cluster formation () was mainly driven by mergers of star clusters without gas, since gas in the filament was blown out by SNe. Hence star clusters grew hierarchically through gravitational mergers of smaller star clusters. There is no star cluster with the mass which forms from an instantaneous collapse of a single large cloud. At the final phase (after from the start of the starburst), we found several tens of star clusters between two progenitor galaxies (see figure 2). This is because they were formed only from the gas in the shock-induced filament.
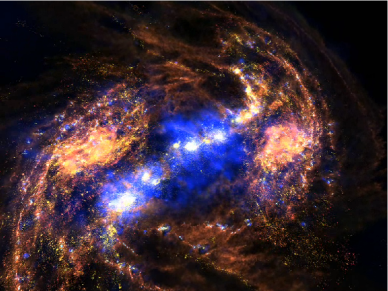
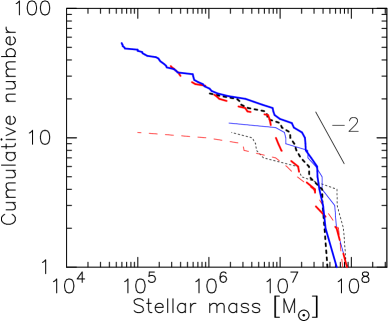
Figure 3 shows cumulative mass functions of star cluster systems. The mass of star clusters ranges from . The mass function for masses larger than is almost independent of mass and spatial resolutions. The slope of this high mass region is close to a power law function with an index of -2, which is consistent with observations (e.g., [Whitmore et al.(1999)Whitmore, Zhang, Leitherer, Fall, Schweizer, & Miller, Whitmore et al. 1999]). Since the formation of star clusters is driven by mergers, the shape of the mass function becomes a power law reflecting the scale free nature of gravity ([Elmegreen(2006), Elmegreen 2006]).
4 Summary
We performed high resolution simulations of merging galaxies that capture the multiphase ISM and the realistic modelings of star formation and of SN feedback. In the simulations, we found that a number of star clusters formed during the starburst at the first encounter. These star clusters grew via hierarchical mergers.
Acknowledgements.
Numerical simulations were carried out on Cray XT4 at CfCA of NAOJ. TRS is financially supported by a Research Fellowship from the JSPS for Young Scientists.
References
- [Bekki & Couch(2001)] Bekki, K., & Couch, W. J. 2001, ApJL, 557, L19
- [Bois et al.(2010)] Bois, M., et al. 2010, MNRAS, 406, 2405
- [Bournaud et al.(2008)Bournaud, Duc, & Emsellem] Bournaud, F., Duc, P.-A., & Emsellem, E. 2008, MNRAS, 389, L8
- [Elmegreen(2006)] Elmegreen, B. G. 2006, ArXiv Astrophysics e-prints:astro-ph/0605519
- [Li et al.(2004)Li, Mac Low, & Klessen] Li, Y., Mac Low, M.-M., & Klessen, R. S. 2004, ApJL, 614, L29
- [Saitoh et al.(2008)Saitoh, Daisaka, Kokubo, Makino, Okamoto, Tomisaka, Wada, & Yoshida] Saitoh, T. R., Daisaka, H., Kokubo, E., Makino, J., Okamoto, T., Tomisaka, K., Wada, K., & Yoshida, N. 2008, PASJ, 60, 667
- [Saitoh et al.(2009)Saitoh, Daisaka, Kokubo, Makino, Okamoto, Tomisaka, Wada, & Yoshida] Saitoh, T. R., Daisaka, H., Kokubo, E., Makino, J., Okamoto, T., Tomisaka, K., Wada, K., & Yoshida, N. 2009, PASJ, 61, 481
- [Saitoh & Makino(2009)] Saitoh, T. R., & Makino, J. 2009, ApJ (Letters), 697, L99
- [Saitoh & Makino(2010)] Saitoh, T. R., & Makino, J. 2010, PASJ, 62, 301
- [Schweizer(1987)] Schweizer, F. 1987, in Nearly Normal Galaxies. From the Planck Time to the Present, ed. S. M. Faber, 18–25
- [Whitmore(2003)] Whitmore, B. C. 2003, in A Decade of Hubble Space Telescope Science, ed. M. Livio, K. Noll, & M. Stiavelli, 153–178
- [Whitmore et al.(1999)Whitmore, Zhang, Leitherer, Fall, Schweizer, & Miller] Whitmore, B. C., Zhang, Q., Leitherer, C., Fall, S. M., Schweizer, F., & Miller, B. W. 1999, AJ, 118, 1551