Pietro Biassoni
representing the BaBar Collaboration
Università degli Studi and INFN Milano, via Celoria 16,
I-20133 Milano, Italy.
pietro.biassoni@mi.infn.it
Abstract
In the present paper we review recent experimental results from the
BABAR experiment concerning the measurement of the CKM angles.
A particular highlight is given to the novel independent determination of
the angle from and to the
recent full-luminosity updates of several angle measurements.
I Introduction
The measurement of violation () in meson decays provides
crucial tests of the Standard Model and of the
Cabibbo-Kobayashi-Maskawa (CKM) matrix CKM .
The angle is experimentally measured with a precision of
in ccKs and is not covered
in this paper.
The determination of angles and still
suffers from larger experimental uncertainties.
We review results from BABAR, including
the measurement of in and in the novel
decay mode , and
full-luminosity updates of several angle
measurements.
II Experimental techniques
The results are based on data collected with the BABAR detector BABARNIM
at the PEP-II asymmetric-energy collider,
at a center-of-mass energy near the resonance.
The meson is kinematically characterized by the variables
and , where is the four-momentum vector
expressed in rest frame. The total integrated luminosity
corresponds to about pairs.
Background arises primarily from random combinations of particles in
events (), and
is discriminated against events by using event shape
variables, combined into multivariate “shape” classifiers, that are indicated
with in the following.
III Measuring
The CKM angle is measured in transition, exploiting
the interference between the decay of mixed and unmixed mesons.
The signal meson () is reconstructed into its decay to a
-eigenstate, accessible from both and .
From the remaining particles in the
event, we reconstruct the decay vertex of the other meson () and identify its flavor, through the analysis of its
decay products Tagging .
The distribution of the difference
of the proper decay times
of mesons into -eigenstates, such as ,
is given by
(1)
where is the mean lifetime,
the
mixing frequency,
and () if the decays as a ().
The parameters and describe mixing-induced and direct
, respectively.
Considering just tree level contributions to the process,
and .
However, non negligible penguin (loop) amplitudes may contribute to
transitions. The different strong and weak phase of
the penguin amplitudes may give rise to direct
(), and modify into
,
where , with .
However, may be extracted via an
isospin SU(2) or a flavor SU(3) analysis of the decay.
IV from
IV.1 Experimental Inputs
An isospin SU(2) analysis is used to extract in decays.
The decays are transitions, where () denotes a
pseudoscalar (vector) meson. Hence, the decay is described
by three different amplitudes, one for each helicity state, with
different transformation properties KAGAN .
The analysis of the angular distributions of the meson decay
products allows to extract the fraction of longitudinal
polarization. In the helicity formalism, the differential decay rate is
(2)
where is the helicity angle between the daughter
and the recoil direction in the first (second) rest frame.
Since experimental measurements have shown the decay to be dominated
by the longitudinal, -even polarization, a full angular analysis,
that allows to separate the definite- contributions of the
transverse polarization, is not needed.
Several inputs are needed to perform the SU(2) analysis of the
decay. They are: the time-dependent (TD) parameters and
branching fraction (BF) of
chconj ; BTORHOPRHOM , BF and
direct -asymmetry () of BTORHORHO ,
and TD parameters and BF of BTORHO0RHO0 . In
Table 1 we summarize the results of the different
analyses, and the number of pairs used in
each measurement.
Mode
()
()
383
–
465
465
Table 1: Results (BF, , , , and ) for
analyses. The number of pairs
used in each analysis is also reported.
The analysis has been updated using the
final BABAR dataset. Signal yields, and are
extracted using a maximum likelihood (ML) fit to , ,
, and the masses and helicity angles
of the mesons. Multidimensional probability density functions
are used to
properly account for variables correlations in the background.
IV.2 Determination of
Under the isospin SU(2) symmetry, the following relations
hold ISOSPINPIPI :
(3)
where () is the amplitude of
process.
Neglecting possible electroweak penguins (EWP) amplitudes,
which do not obey SU(2) isospin symmetry, receives only
tree amplitude contributions.
The small value measured in decay
indicates that the contribution from EWPs is negligible, and the
isospin analysis holds
within an uncertainty of ISOBREAKING .
Other possible isospin violation effects due to finite
width FALK are tested by varying the mass window. Such
effects are below the current sensitivity.
If and are aligned with a suitable choice of
phases, the relations in Eq. (3)
can be represented in the complex plane by two triangles,
and the phase difference between and
is .
Isospin relations similar to Eq. (3)
hold separately for each polarization state. However, since
, only the analysis of -even longitudinal decay is
performed.
Constraints on the CKM angle and on the penguin contribution
are obtained from a confidence level (CL) scan.
Assuming the isospin-triangle relations of Eq. (3), a
for the five amplitudes is calculated from the
measurements summarized in Table 1, and minimized
with respect to the parameters that don’t enter the scan.
The values are then calculated from the probability of
the minimized .
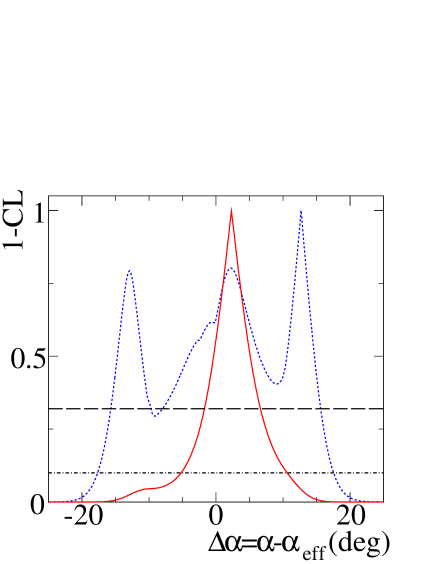
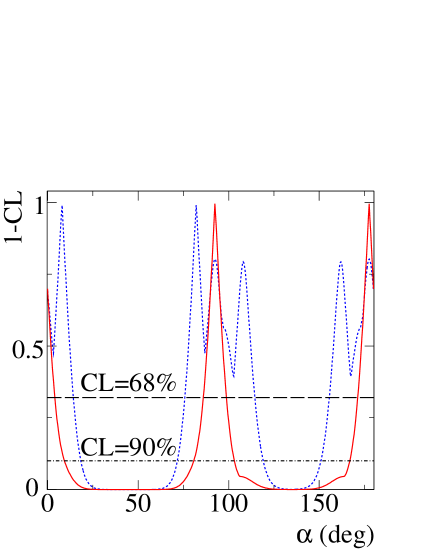
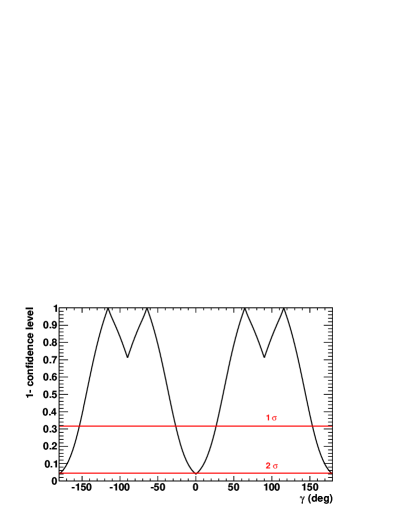
Results of such a scan are reported in Fig. 1
Figure 1:
Projection of the scan on (left) and (right)
for the
system BTORHORHO . The red solid (blue dotted) line represents
the result found using the latest BTORHORHO
(previous BTORHORHOOLD ) BF measurement.
Since the measured BFs of the several reactions satisfy
, the isospin triangles do not
close, i.e.
. This results in a degeneracy of the
eight-fold ambiguity on into a four-fold ambiguity, corresponding
to peaks in the vicinity of , (two degenerate
peaks), and .
BABAR obtains a 68% CL limit .
Taking only the solution consistent with the global CKM
fits globalFits , is equal to .
V from
A novel independent measurement of is performed by BABAR in
the decay.
The TD decay rate of the meson into the non- eigenstate is a1decayrate
and enters this equation via
where is the strong phase between the tree amplitudes
of decays to and .
V.1 Experimental Inputs
Since an isospin SU(2) analysis of the
decay is not feasible Pentagon , a flavor-SU(3)
based approach is used to extract the information on
.
The experimental inputs needed for the SU(3) analysis are: TD
parameters and BF of , BFs of , and BF of .
The BFs and TD parameters of and decays have been measured in the last few years BTOA1PI ; A1TD .
The BF can be extracted using the combined
branching fraction of decays to and ,
and the relative magnitude and phase of
and amplitudes.
and are both axial vector mesons, they have
overlapping mass distributions and both decays to , hence
they undergo not-negligible interference effects.
In order to include interference effects in the fit, in a recent analysis
by BABARk1pi the system
is parameterized in terms of a two-resonance, six-channel -matrix
model ACCMOR in the -vector approach Aitchison .
A partial wave analysis of the diffractively produced
system performed by the ACCMOR collaboration ACCMOR is used to
determine the decay couplings and the mass poles of the K-matrix. Signal yields are extracted using a ML fit to
, , and .
The invariant mass of the resonant system is sensitive to
the production parameters of the system.
The
combined signal branching fractions are and
, where the error
includes both statistical and systematic contributions. The information about the fraction and phase of the two resonances
is used to calculate the contribution of the meson which
belongs to the same SU(3) octet as the meson.
The results are and , where
the latter upper limit is evaluated at the 90% confidence
level k1pi .
V.2 Determination of
Using a a flavor-SU(3)
based approach, the size of penguin amplitudes contributing to the
decay is related to the branching fractions of the
partners of
the decays: and a1decayrate ; Gronau . Nonfactorizable contributions
to transition amplitudes
from exchange and weak annihilation diagrams are
neglected a1decayrate ; Gronau . is assumed to be negligible.
and form factors, that are needed in the analysis, are
obtained from the study of decays Decay .
A Monte Carlo method is used to derive the 68% and 90% CL upper
limits for k1pi .
The result is
at the 68% (90%) CL.
Combining this bound with the results from TD analysis A1TD , the final result
is for the solution
compatible with the CKM global fits,
where the first error is statistical and systematic combined and the
second is due to penguin pollution.
VI Measuring
The CKM angle is measured by exploiting the interference
between the and tree amplitudes in
-violating decays. Such amplitudes also depend
on the magnitude ratio , and the relative strong phase
between the CKM favored and suppressed amplitudes. These
hadronic parameters depend on the decay and are extracted from data.
In the following we report the results of full-luminosity updates of
three different
analysis bib:babar_DALITZ ; bib:babar_ADS_dk ; bib:babar_GLW_d0k ,
based on the GGSZ bib:GGSZ ,
ADS bib:ADS , and GLW bib:GLW methods, respectively.
VI.1 GGSZ method:
,
In the GGSZ method bib:GGSZ , the information on is
extracted from the Dalitz-plot distribution of the daughters.
The variables sensitive to violation are and
.
, ( and
), and () decays are
studied, with () bib:babar_DALITZ .
Signal yields are extracted using a ML fit
to , , and .
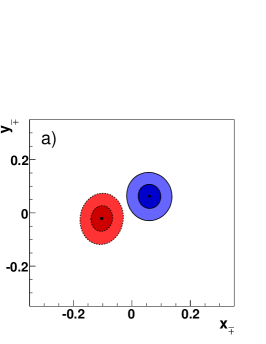
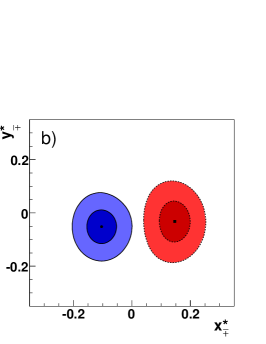
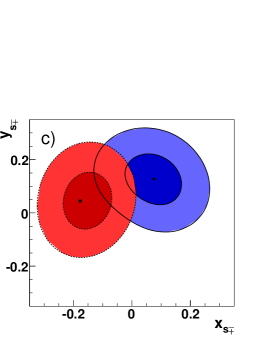
A fit to the Dalitz-plot distribution of the daughters is used to
determine 2D confidence regions for and , which are
shown in Fig. 2.
The Dalitz plot model for and decay is
studied using the large () and very
pure control sample bib:Dmixing .
The Dalitz model includes a non-resonant part and several intermediate
or quasi-two-body decays.
The fitted signal yields are about 1000, 500 and 200 events for , , and , respectively. The fitted
values are reported in Table 2.
Figure 2: and contours in the
planes for (a) , (b) and (c) ,
for (solid lines) and (dotted lines)
decays. and denote
in and decay, respectively.
Table 2:
GGSZ analysis results: , , , and
. For and the errors are statistical,
systematic and Dalitz-model, respectively. For and
the error is statistical and systematic combined.
For decay we report the value of , where
takes into account the finite width.
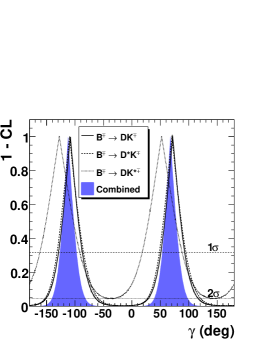
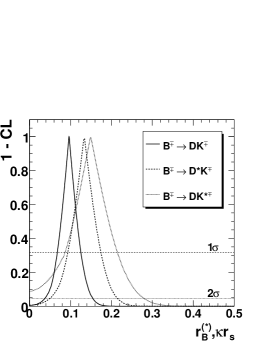
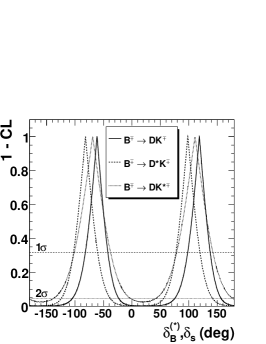
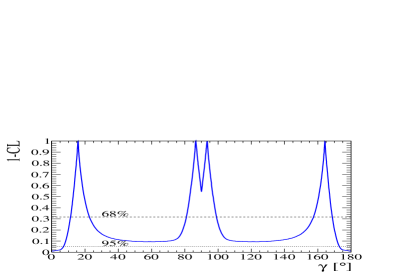
A frequentist approach is used to obtain , , and
for each decay mode. Results of this analysis are reported in
Fig. 3.
The values of and for each decay mode are
reported in Table 2. is found to be ,
as expected by the theory.
CKM angle is found to be equal to
(mod ), where the three uncertainties are statistical,
systematic and Dalitz-model, respectively.
The distance between and is sensitive to
direct -violation ( in case of no ).
Results of the analysis indicate a evidence of direct
.
Figure 3: 1-CL as a function of (left), (center) and
(right) from the Dalitz-plot
analysis.
VI.2 ADS method: ,
The and
( and ) decays are studied, where
decays to the final state bib:babar_ADS_dk .
Events that have same (right) sign kaons are produced in CKM favored
decays.
Events that have opposite (wrong) sign kaons are produced through a CKM
favored (suppressed) decay, followed by a CKM suppressed
(favored) decay.
The ADS method bib:ADS exploit the interference between these
decay chains.
Since the total suppression factor is equal for the two decay chains,
interfering amplitudes have similar magnitude, thus large
interference effects are expected. On the other side, the large
suppression implies a .
Defining the wrong-to-right sign decay amplitude ratio
,
the following definitions hold
(4)
(5)
where and are the ratio and the relative phase
between the CKM suppressed and the CKM favored amplitude for
decay, and the () sign in Eq. (4) is used for
and () decays.
To enhance signal purity, a tight cut is applied. Specialized
selection criteria are applied to suppress misidentification
and decays, that are the main sources of
-peaking background.
The signal yields, , and are determined from fits
to and .
In Table 3 we report the measured values for the signal
yield, ,
, and the signal statistical significance (including
systematic uncertainties), for each decay mode.
Wrong-sign Signal Yield
Stat. Sign. ()
2.1
2.2
–
()
Table 3: Results for ADS analysis.
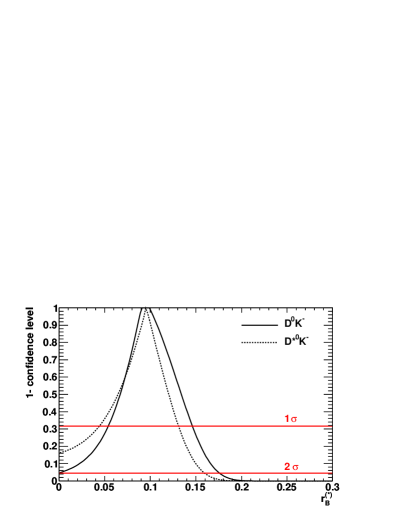
A frequentist approach is used to extract the unknowns of
Eq. (4)–(5) from the measured observables.
The values of and are fixed to those reported
in hfag . Results are reported in Fig. 4.
Despite a poor sensitivity to , which is bound to be
, a good determination of is
obtained: ,
.
Figure 4: 1-CL as a function of (left) and (right) from
the ADS study.
VI.3 GLW method: ,
In the GLW method bib:GLW , the and amplitude
interference is studied via meson decays into eigenstates.
The decay amplitudes are used to build the following quantities
(6)
(7)
where () indicates a decay into a (flavor)
eigenstate, and the -eigenvalue of the final
state.
decays are reconstructed, with mesons
decaying to -even (, ),
-odd (, , ),
and flavor () eigenstates bib:babar_GLW_d0k .
The signal yields are measured, and the partial decay rates determined
with a ML fit to , and . The fitted signal yield is
about 500 events
for both -even and -odd final states.
() and () are extracted from
data and are equal to
()
and
(), respectively.
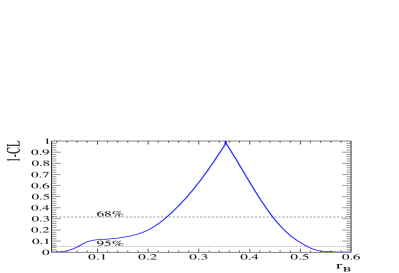
The four observables of Eq. (6)–(7) are used
to obtain , and , using a frequentist
approach. The results are
() and, modulo ,
or
or
()
at the 68% (95%) CL, and are shown in
Fig. 5.
In order to compare these results with those from GGSZ
method bib:babar_DALITZ ,
is computed:
and
.
Data from the decay are not used to
determine , since they are already used in the GGSZ
analysis bib:babar_DALITZ .
Figure 5: 1-CL as a function of mod (left) and (right) from the GLW study.
VII Conclusion
We have reported results for and measurement at
BABAR.
is measured in decay at level. A novel
independent measurement of in decay is
performed.
The measurement of angle using the full BABAR dataset is
performed using three different techniques. Results of the different
techniques are consistent inside the experimental uncertainties.
The angle is measured with a precision of about .
The hadronic parameter is found to be , as expected
by the theory.
Finally, evidences of direct at level are reported
in decays.
Acknowledgments
I would like to thank all my BABAR collaborators and especially
F. Palombo, A. Gaz, and V. Poireau for their help in preparing this paper.
References
(1)
N. Cabibbo, Phys. Rev. Lett. 10, 531 (1963);
M. Kobayashi and T. Maskawa, Prog. Theor. Phys. 49, 652 (1973).
(2)
K.-F. Chen et al. (Belle Colalboration), Phys. Rev. Lett. 98, 031802 (2007);
B. Aubert et al. (BABAR Collaboration), Phys. Rev. D 79, 072009 (2009).
(3)
B. Aubert et al. (BABAR Collaboration), Nucl. Instrum. Methods Phys. Res., Sect. A 479, 1 (2002).
(4)
B. Aubert et al. (BABAR Collaboration), Phys. Rev. Lett. 94, 161803 (2005).
(5)
A. L. Kagan, Phys. Lett. B 601, 151 (2004).
(6)
Charge conjugation is implied through the paper, unless otherwise
specified.
(7)
B. Aubert et al. (BABAR Collaboration), Phys. Rev. D 76,
052007 (2007).
(8)
B. Aubert et al. (BABAR Collaboration), Phys. Rev. Lett. 102, 141802 (2009).
(9)
B. Aubert et al. (BABAR Collaboration), Phys. Rev. D 78, 071104R
(2008).
(10)
M. Gronau and D. London, Phys. Rev. Lett. 65, 3381 (1990).
(11)
M. Gronau and J. Zupan, Phys. Rev. D 71, 074017 (2005).
(12)
A. F. Falk, Z. Ligeti, Y. Nir, and H. Quinn, Phys. Rev. D 69,
011502 (2004).
(13)
B. Aubert et al. (BABAR Collaboration), Phys. Rev. Lett. 97, 261801 (2006).
(14)
J. Charles et al. (CKMfitter Group), Eur. Phys. J. C 41, 1-131
(2005), updated results and plots available at
http://ckmfitter.in2p3.fr;
M. Ciuchini et al. (UTFIT Group), JHEP 107, 13 (2001), updated
results and plots available at http://www.utfit.org.
(15)
M. Gronau and J. Zupan, Phys. Rev. D 73, 057502 (2006);
(16)
M. Gronau, Phys. Lett. B 265, 389 (1991).
(17)
B. Aubert et al. (BABAR Collaboration), Phys. Rev. Lett. 97, 051802 (2006);
Phys. Rev. Lett. 100, 051803 (2008).
(18)
B. Aubert et al. (BABAR Collaboration), Phys. Rev. Lett. 98, 181803 (2007).
(19)
B. Aubert et al. (BABAR Collaboration), Phys. Rev. D 81, 052009 (2010).
(20)
C. Daum et al. (ACCMOR Collaboration), Nucl. Phys. B187, 1 (1981).
(21)
I. J. R. Aitchison, Nucl. Phys. A 189, 417 (1972).
(22)
M. Gronau and J. Zupan, Phys. Rev. D 70, 074031 (2004).
(23)
J. C. R. Bloch et al., Phys. Rev. D 60, 111502(R) (1999);
H.-Y. Cheng and K.-C. Yang, Phys. Rev. D 76, 114020 (2007).
(24)
P. del Amo Sanchez et al. (BABAR Collaboration),
Phys. Rev. Lett. 105, 121801 (2010).
(25)
P. del Amo Sanchez et al. (BABAR Collaboration),
Phys. Rev. D 82, 072006 (2010).
(26)
P. del Amo Sanchez et al. (BABAR Collaboration),
Phys. Rev. D 82, 072004 (2010).
(27) A. Giri, Y. Grossman, A. Soffer and J. Zupan,
Phys. Rev. D 68, 054018 (2003).
(28)
D. Atwood, I. Dunietz and A. Soni, Phys. Rev. Lett. 78,
3257 (1997).
(29)
M. Gronau and D. Wyler, Phys. Lett. B265, 172; M. Gronau
and D. London, Phys. Lett. B253, 483 (1991).
(30)
P. del Amo Sanchez et al. (BABAR Collaboration),
Phys. Rev. Lett. 105, 081803 (2010).
(31)
E. Barbiero et al. (HFAG Group), “Avergages of b-hadron and c-hadron
Properties at the end of 2007”, arXiv:0808.1297v3.