Orthorhombic to tetragonal transition of SrRuO3 layers in Pr0.7Ca0.3MnO3/SrRuO3 superlattices
Abstract
High-quality Pr0.7Ca0.3MnO3/SrRuO3 superlattices with ultrathin layers were fabricated by pulsed laser deposition on SrTiO3 substrates. The superlattices were studied by atomically resolved scanning transmission electron microscopy, high-resolution transmission electron microscopy, resistivity and magnetoresistance measurements. The superlattices grew coherently without growth defects. Viewed along the growth direction, SrRuO3 and Pr0.7Ca0.3MnO3 layers were terminated by RuO2 and MnO2, respectively, which imposes a unique structure to their interfaces. Superlattices with a constant thickness of the SrRuO3 layers, but varying thickness of the Pr0.7Ca0.3MnO3 layers showed a change of crystalline symmetry of the SrRuO3 layers. At a low Pr0.7Ca0.3MnO3 layer thickness of 1.5 nm transmission electron microscopy proved the SrRuO3 layers to be orthorhombic, whereas these were non-orthorhombic for a Pr0.7Ca0.3MnO3 layer thickness of 4.0 nm. Angular magnetoresistance measurements showed orthorhombic (with small monoclinic distortion) symmetry in the first case and tetragonal symmetry of the SrRuO3 layers in the second case. Mechanisms driving this orthorhombic to tetragonal transition are briefly discussed.
pacs:
75.70.Cn, 75.47.-m, 75.47.Lx, 75.30.Gw, 68.37.-dI Introduction
Heterostructures and superlattices (SLs) of oxide perovskites open an exciting field of research, since it is possible by present epitaxy techniques to grow samples with clearly defined interfaces allowing for the realization of new functionalities. Some examples are the two-dimensional electron gas at the SrTiO3-LaAlO3 interface,Reyren et al. (2007) electron tunnelling in multiferroic systems,Gajek et al. (2007) growth of extrinsic multiferroic superlattices,Vrejoiu et al. (2008) as well as the observation of a giant interlayer exchange coupling in La0.7Sr0.3MnO3/SrRuO3 superlattices.Ziese et al. (2010a, b) The latter exchange coupling leads to positive exchange biasKe et al. (2004, 2005); Padhan et al. (2006) and is mediated by the direct Mn-O-Ru-bond. Lee et al. (2008); Ziese et al. (2010a) The exchange bias is very large, since the individual layer thickness in the SLs is very small. In general, in systems with strong correlations between the electronic, magnetic and structural degrees of freedom one would expect to find new phenomena in the limit of ultrathin layers, i.e. in restricted geometries.
In this paper, another type of perovskite superlattice is studied, consisting out of ultrathin Pr0.7Ca0.3MnO3 (PCMO) and SrRuO3 (SRO) layers. Bulk SRO is an itinerant ferromagnet with orthorhombic crystal structure (space group Pbnm, lattice parameters nm, nm, nm) and a Curie temperature of about 160 K.Cao et al. (1997); Klein et al. (1996) Bulk PCMO has orthorhombic symmetry (Pbnm, nm, nm, nm); it has a complex magnetic behavior and phase diagram, and for 30% Ca doping several transitions occur upon cooling, with an insulating canted ferromagnetic or antiferromagnetic state below K Jirák et al. (1985); Yoshizawa et al. (1995). The aim of this work is to investigate the crystalline symmetry of the individual layers. This is a formidable task, since the layer thickness is below 5 nm and since the orthorhombic distortions from the pseudocubic cell are at maximum % for SRO and % for PCMO. This task was tackled by high-resolution transmission electron microscopy as well as angular-dependent magnetoresistance (MR) measurements. Since PCMO is insulating, the MR measurements only probe the SRO layers. We have shown before that the crystalline symmetry of orthorhombic SRO single layers could be accurately studied by angular MR measurements, revealing a monoclinic distortion of the - and -axesZiese et al. (2010c) that was also observed in high-resolution X-ray diffractometry.Gan et al. (1999)
II Experimental
PCMO/SRO SLs were fabricated by pulsed-laser deposition at a temperature of C and in an oxygen partial pressure of mbar. Vicinal SrTiO3 single crystal substrates with a low miscut angle of about were used for the growth, after being etched in buffered HF and annealed at C for 2 hours in air. This treatment assured substrate surfaces with atomically flat terraces of a width between 100 and 500 nm separated by unit-cell high steps. The SLs consisted of fifteen PCMO/SRO bilayers with various layer thicknesses, see Table 1.
| Sample | PCMO / SRO | |
|---|---|---|
| SL1 | [1.5 nm / 4.4 nm] | [4 u.c. / 10-11 u.c.] |
| SL2 | [3.0 nm / 4.0 nm] | [8 u.c. / 9-10 u.c.] |
| SL3 | [3.8 nm / 4.0 nm] | [10 u.c. / 10 u.c.] |
High-angle annular dark-field scanning transmission electron microscopy (HAADF-STEM), electron energy loss spectroscopy (EELS) and energy dispersive X-ray (EDX) mappings were done in a TITAN 80-300 FEI microscope (300 keV energy of the primary electrons) with a spherical aberration corrected () probe forming system. For the related Scherzer conditionsScherzer (1949) used, i.e. a focus of nm, image aberrations were minimum and all atomic columns were clearly resolved in the HAADF-STEM mode. High-resolution transmission electron microscopy (HRTEM) investigations were performed in a Jeol 4010 (400 keV energy of the primary electrons), and Fourier-filter-related image processing was performed by help of the Digital Micrograph program package (Gatan Inc.). For magnetoresistance measurements the SLs were mounted on a rotatable stage with an angular resolution better than and an angle slackness after reversal of . The measurements were performed in a He-flow cryostat equipped with an 8 T superconducting solenoid.
III Structural properties
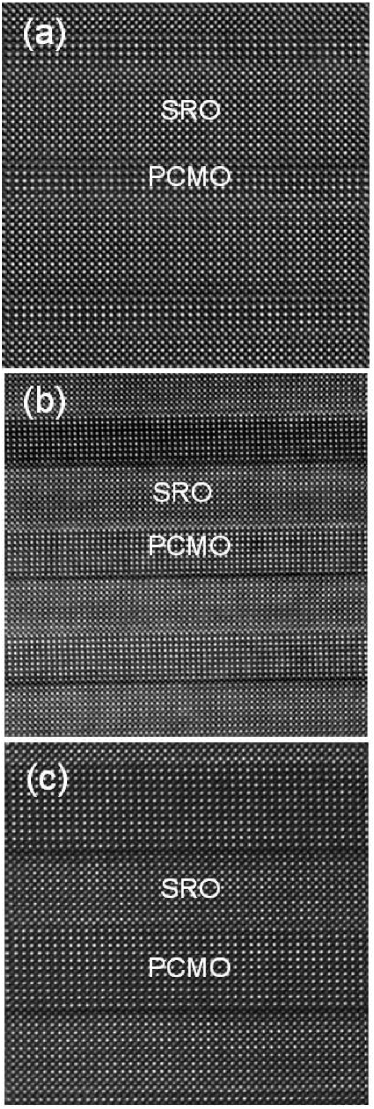
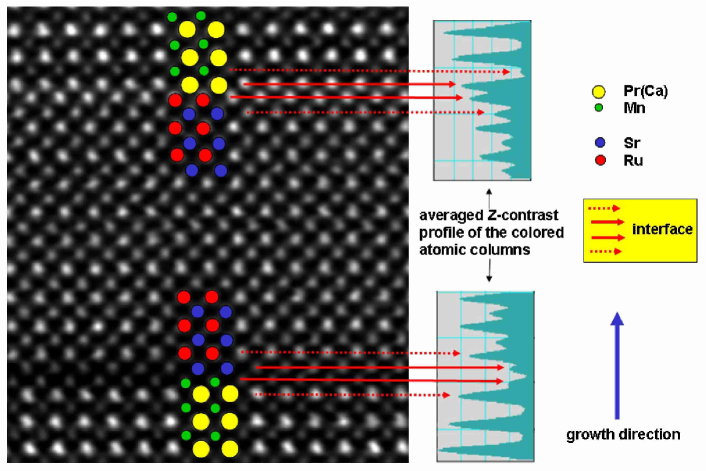
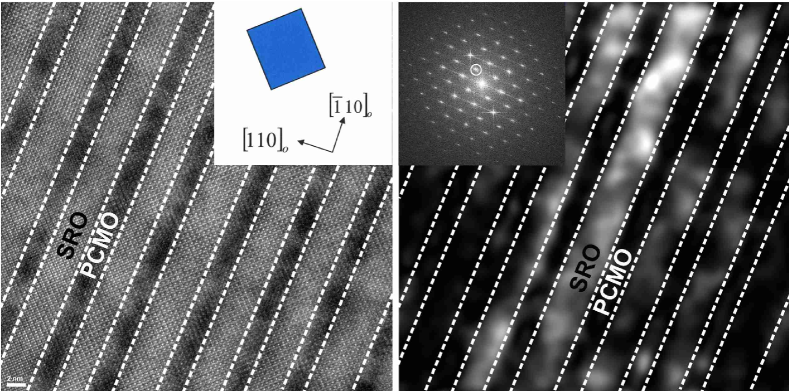
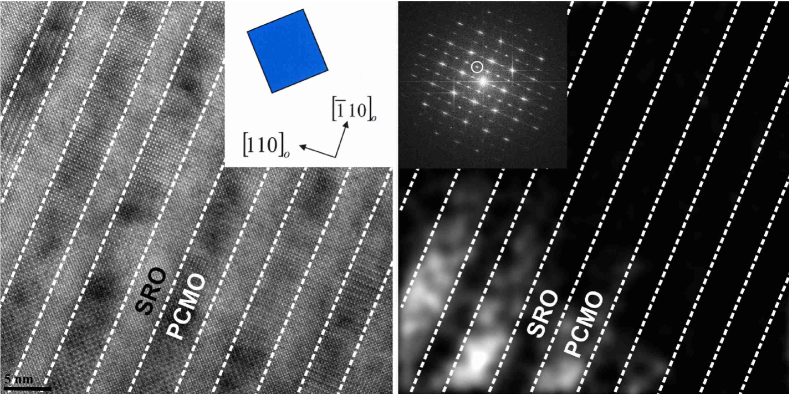
Figure 1 shows HAADF-STEM micrographs of the three PCMO/SRO SLs, with respective layers thicknesses of 1.5 nm/4.4 nm (SL1, Fig. 1(a)), 3.0 nm/4.0 nm (SL2, Fig. 1(b)) and 3.8 nm/4.0 nm (SL3, Fig. 1(c)). The layers were grown entirely epitaxially, with coherent interfaces between the PCMO and SRO layers. No misfit dislocations were found along the interfaces. Closer inspection of the HAADF-STEM micrographs revealed an asymmetry of the interfaces: in the growth direction, the PCMO layers terminated most probably with MnO2 planes, and the SRO layers terminated most likely with RuO2 planes, resulting in different interface contrasts, see Fig. 2.
Fast Fourier transforms (FFTs) of HRTEM and STEM micrographs showed orthorhombic reflections indicating that either PCMO or SRO, or both, had orthorhombic structure in the SLs. Bulk PCMO and SRO have orthorhombic structures at room temperature, however, for epitaxial films, especially coherent and ultrathin ones grown on dissimilar substrates, distortions from the orthorhombic bulk structure and formation of particular configurations of crystallographic domains are expected to occur.Fujimoto et al. (2007); Gan et al. (1999) For example, epitaxial SRO films on DyScO3 were proven to have tetragonal structure.Vailionis et al. (2008)
Dark-field reconstructed images in the light of certain reflections, obtained from cross- sectional HRTEM images of samples SL1 and SL3, revealed a characteristic difference between these samples: whereas the SRO layers of sample SL1 were clearly orthorhombic, with the long orthorhombic axis lying in the plane of the layers, the SRO layers in sample SL3 were either not orthorhombic or contain only very few orthorhombic domains.
HRTEM images were taken from cross sections of samples SL1 and SL3. FFTs and reconstructed dark-field images in the light of certain reflections were prepared. Note again that in the following the long orthorhombic axis of the SRO unit cell is defined as the -axis. In particular, the following reflections were used to characterize the superlattices with respect to the presence of an orthorhombic phase in the SRO layers:
- 1.
-
2.
the orthorhombic reflections corresponding to those parts of both SRO and PCMO lattices in which the orthorhombic -axis was potentially in-plane but perpendicular to the viewing direction (Fig. 5, see inset), and
-
3.
the orthorhombic reflections corresponding to those parts of both SRO and PCMO lattices in which the orthorhombic -axis was potentially out-of-plane (perpendicular to the plane of the layers and perpendicular to the viewing direction) (Fig. 6, see inset).
A distinction between orthorhombic and tetragonal phases is possible for the dynamically appearing , and reflections which are present in the orthorhombic phase, but absent in the tetragonal phase.
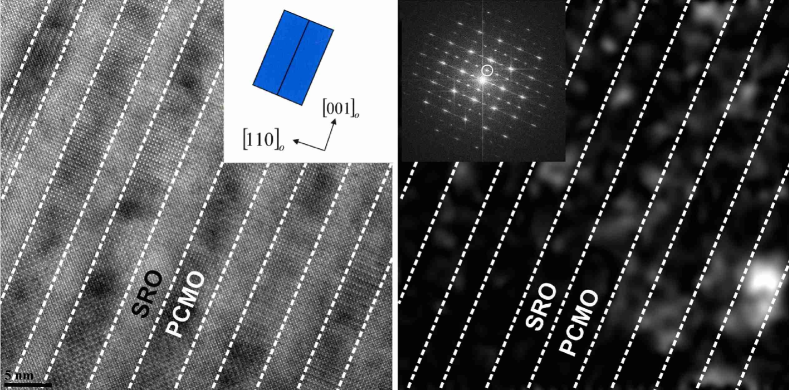
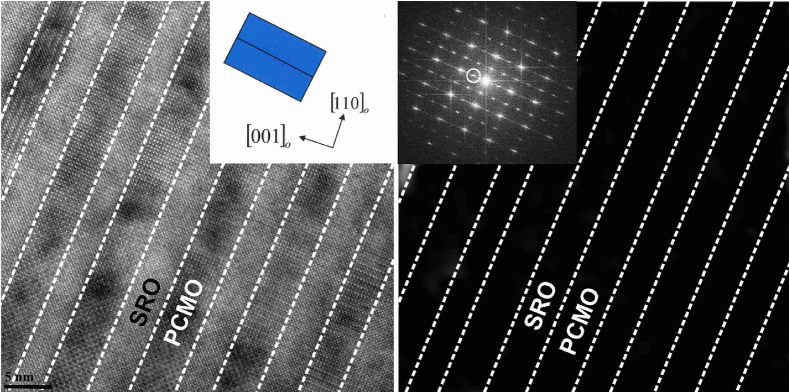
For sample SL1, in the reconstructed dark-field image of Fig. 3 (right) in the light of the reflection, the SRO layers are mostly imaged with high intensity (i.e. bright). This means that in sample SL1, the SRO layers are clearly orthorhombic, with the -axis in the plane of the layers. Opposite to this, for sample SL3, in the corresponding reconstructed dark-field image of Fig. 4 (right) in the light of the reflection, the SRO layers are all imaged with very low intensity (i.e. dark). Since this could also mean that the orientation of the SRO layers was different from the one in sample SL1, whereas still being orthorhombic, the other two possible orientations were studied as well. As Fig. 5 shows, the reconstructed dark-field image in the light of the reflection (right) for the in-plane -axis perpendicular to the viewing direction gives although non-zero, but still rather low intensity of the SRO layers. Figure 6 shows that the intensity of the SRO layers in the reconstructed dark-field image in the light of the reflection (right) for the orthorhombic SRO unit cell with out-of-plane -axis was zero. In result, the SRO layers in sample SL3 were either not orthorhombic, or contained only a very minor proportion of the orthorhombic phase. A corresponding FFT-based analysis of the HAADF-STEM images of the same two samples gave analogous results.
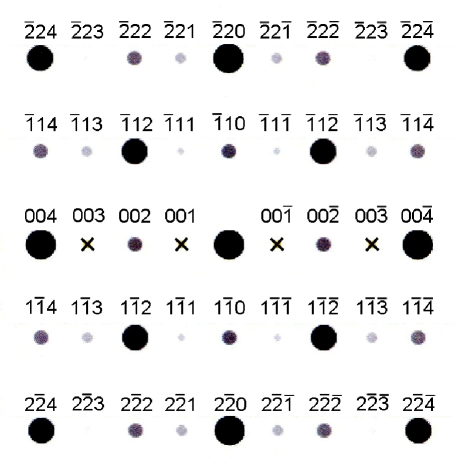
Figure 7 shows part of a simulated diffraction pattern of the orthorhombic SRO structure along the zone axis , in particular revealing the (indicated by crosses) reflections used during reconstructed dark-field imaging in Figs. 5 and 6. Different from the FFT patterns in Figs. 3 to 6 which resulted from superpositions of the three SRO (and additionally PCMO) orientations shown in the insets of Figs. 4 to 6, Fig. 7 shows the diffraction pattern of only one single SRO orientation. The latter corresponds (slightly rotated) to the FFT pattern and schematic inset of Fig. 6. Although reflections are kinematically forbidden in the orthorhombic space group of SRO, they nevertheless appear due to dynamical diffraction conditions.
In all the Figs. 4 to 6 the SRO layers were dark, which means that they were not orthorhombic in sample SL3. Only occasionally, small spots of intensity could be seen in the SRO layers, which might indicate that there are very few orthorhombic domains in sample SL3.
In conclusion, the SRO layers of sample SL1 were orthorhombic, whereas those in sample SL3 were either not orthorhombic or contain only very few orthorhombic domains.
IV Magnetotransport properties
IV.1 Theoretical considerations
In a ferromagnet, anisotropy energy and resistivity are functions of the direction of the spontaneous magnetization. Therefore, it is possible to conclude on the crystalline symmetry from direction-dependent measurements of the anisotropic magnetoresistance (AMR). The relevant equations for this approach are summarized in the appendix; the derivation followed Döring and Simon.Döring and Simon (1960, 1961)
The MR can be written as a function of a symmetric tensor of second rank reduced by the directional unit vector of the current density:Döring and Simon (1960)
| (1) |
By definition the are the direction cosines of the current density with respect to the crystallographic basis vectors. The tensor components are functions of the direction cosines of the magnetization, , where denotes the saturation magnetization and the unit vector along the magnetization direction. The functional form of the matrices was obtained from crystal symmetry considerations in [Döring, 1957; Döring and Simon, 1960, 1961]. Note that in case of crystal systems with a normal basis, the direction cosines obey .
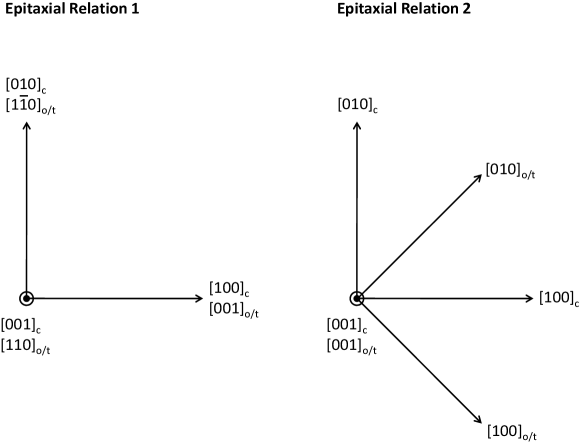
In the following indices “c”, “t” and “o” refer to the cubic directions of SrTiO3 and to the tetragonal or orthorhombic directions of SrRuO3, respectively. For SrRuO3 either orthorhombicGan et al. (1999) or tetragonalVailionis et al. (2008) symmetry was assumed. The orthorhombic cell has four times the volume of the pseudocubic cell, i.e. in this cell the c-axis parameter and the basal plane area are doubled compared to the pseudocubic cell. The minimal tetragonal cell would have twice the volume of the pseudocubic cell;Zakharov et al. (1999) for better comparison with the orthorhombic case,Kennedy and Hunter (1998) however, we chose a tetragonal cell also with four times the volume of the pseudocubic cell. We have mainly investigated two epitaxial relations for both orthorhombic and tetragonal symmetry. In the first epitaxial relation the axis is along the substrate axis, whereas the axis is along the substrate axis, see Fig. 8(a). In the second epitaxial relation the axis is along the substrate axis, wheras the and axes are rotated with respect to the substrate and axes by degrees, see Fig. 8(b). In case of single SrRuO3 films grown on SrTiO3 substrates the first epitaxial relation is realized;Gan et al. (1999); Ziese et al. (2010c) macroscopic alignment of the orthorhombic axis along terrace steps is achieved by growth on slightly vicinal substrates. SrRuO3 films grown on SrTiO3 in this fashion have a small monoclinic distortion with the angle between the orthorhombic - and -axes deviating from a right angle by about half a degree.Gan et al. (1999) Therefore in case of this epitaxial relation also monoclinic symmetry is considered.
MR measurements were performed at constant magnetic field as a function of angle. For this the orientation of the substrate crystal was used as a reference system and angular sweeps in the , and planes were performed. The direction of the magnetization vector with respect to the substrate crystal is specified by spherical coordinates, with the angles and defined with respect to the and axes, respectively. Note that the magnetization angles are not necessarily identical to the angles and between magnetic field and the substrate axes and that were directly measured. Accordingly the angles in out-of-plane field rotations are specified by and in in-plane field rotations by . The angular dependence of the anisotropic MR as determined from symmetry considerations was derived for the two epitaxial relations and the three rotation planes. Tetragonal, orthorhombic and monoclinic crystal structures are discussed; the relevant equations are summarized in the appendix.
IV.2 Angular magnetoresistance
The resistivity and the angular dependent MR of the three samples shown in Table 1 were measured. Since PCMO single layers are insulating,Ziese et al. (2010d) the resitivity and MR of the superlattices were entirely dominated by the SRO layers. Correspondingly, the resistivity of the PCMO/SRO SLs showed a slope change of the resistivity at the Curie temperature of the SRO layers,Ziese et al. (2010d) from which the Curie temperature of 143 K (as shown in Table 1) for the SRO layers was determined. The Curie temperature of the PCMO layers of 110-115 K was determined from magnetization measurements.Ziese et al. (2010e)
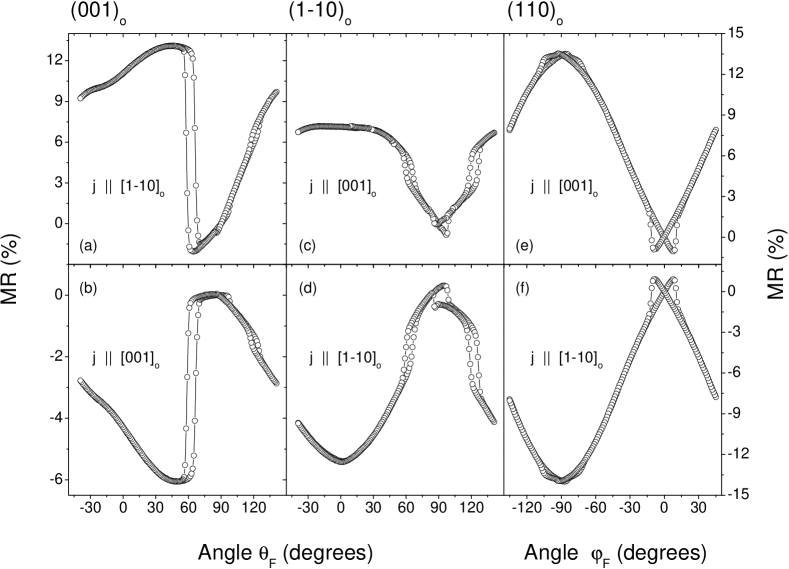
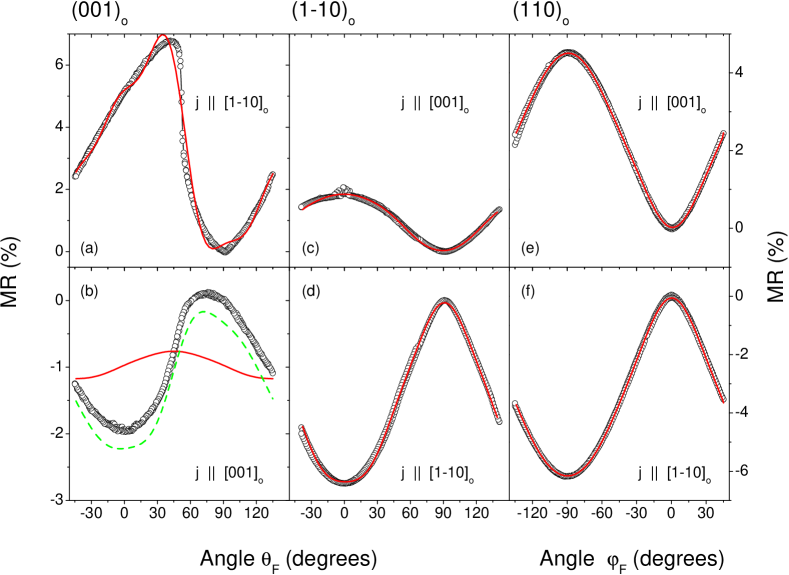
Here we only show angle dependent MR measurements, since these allow for the determination of the crystalline symmetry. The measurements were performed at various temperatures between 10 and 150 K. In the following the data for samples SL1 and SL3 at 10 and 130 K are shown. The angle dependence of the MR of sample SL2 had the same form as that of sample SL3. Figure 9 shows the MR of sample SL1 measured at 10 K. The MR shows hysteresis for certain angles that indicates the presence of a magnetically hard axis close to the corresponding direction. Since SRO has a large magnetocrystalline anisotropy,Ziese et al. (2010c) even at 8 T the magnetization and magnetic-field direction do not agree at low temperatures. In case of sample SL1 the direction of two magnetically hard axes is clearly identified. One lies in the -plane at about 60 degrees from the direction, see sharp hysteretic MR jump in Figs. 9(a) and (b); the second is along the axis, see hysteresis close to in Fig. 9(c) and (d) and in Figs. 9(e) and (f). The magnetic hard axes directions are characteristic for orthorhombic SRO films grown on SrTiO3.Kolesnik et al. (2006); Ziese et al. (2010c) Further, comparing the angular MR traces of sample SL1 with the data of the 40 nm thick SrRuO3 single film presented in [Ziese et al., 2010c], it is immediately evident that the SRO layers in sample SL1 have orthorhombic, actually monoclinic, symmetry. Fitting of the experimental data at 10 K is difficult, since the magnetocrystalline anisotropy energy of the SRO layers is not accurately known and therefore the relation between magnetization angles ( and magnetic field angles is difficult to determine. However, at higher temperatures, the thermal fluctuations are larger and the magnetocrystalline energy might be smaller and the MR curves are smooth, see the MR data of sample SL1 at 130 K in Fig. 10. Thus one might assume and . Eqs. (5-9) derived for orthorhombic symmetry accurately fit the data in Figs. 10(a) and (c)-(f), but not (b), see solid red lines; for the fitting the expressions Eqs. (5-9) were truncated at eighth order. This is in agreement with the results for a single SRO film in [Ziese et al., 2010c]. The MR curve in Fig. 10(b) cannot be described by Eq. (6) even if higher order terms were taken into account, since the experimental data contain a large term absent in Eq. (6). The corresponding expression for monoclinic symmetry, Eq. (10), contains this term and fits the data in Fig. 10(b) well, see dashed green line. This result is again in agreement with the SRO single film resultsZiese et al. (2010c) and is consistent with the fact that a monoclinic distortion between - and -axes was observed in SRO films.Gan et al. (1999); Vailionis et al. (2007) Since the MR data cannot be understood within the other epitaxial relations and crystalline symmetries, from the MR analysis we firmly conclude that the crystalline symmetry of the SRO layers of sample SL1 is orthorhombic (monoclinic). This is in full agreement with the HRTEM results discussed in section III.
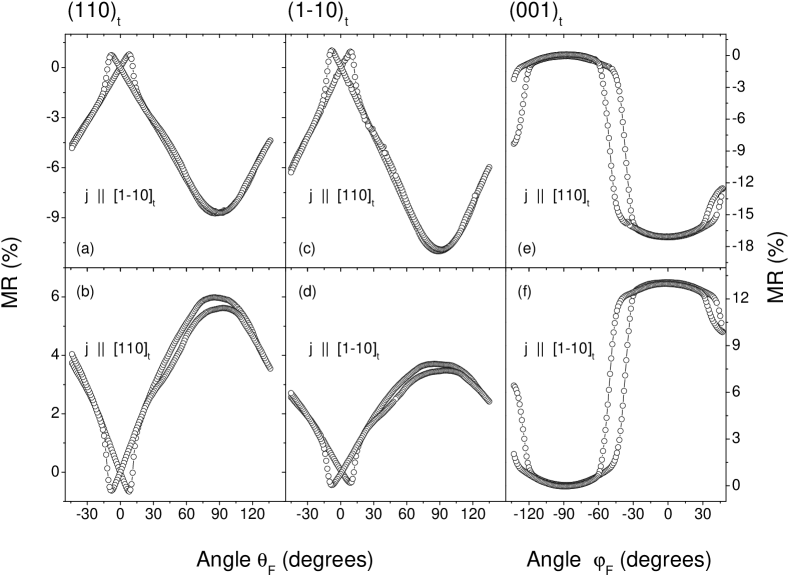
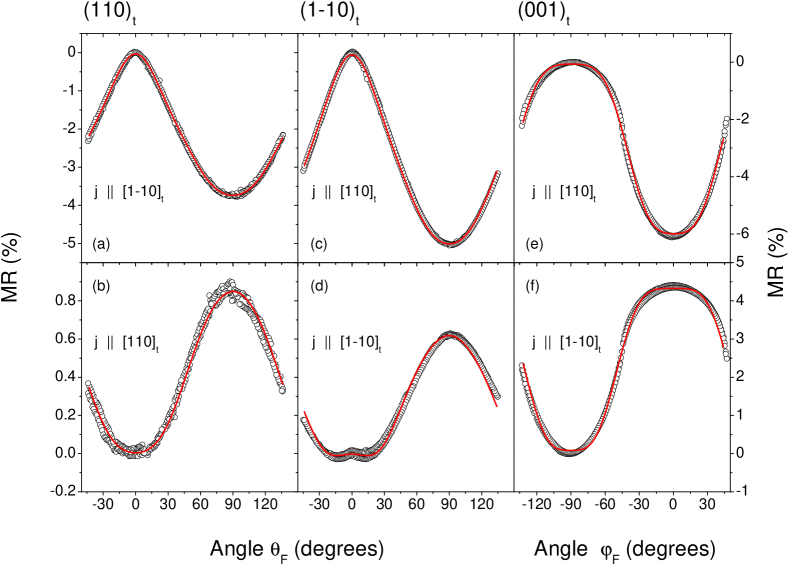
Figure 11 shows the angular MR of sample SL3 measured at 10 K. Comparison with Fig. 9 shows that the form of the angular dependence is significantly different from the orthorhombic case with the -axis in-plane. In case of sample SL3 hysteresis occurs close to the surface normal, degrees, see Figs. 11(a)-(d) and in case of in-plane rotations near degrees, see Figs. 11(e)-(f). Accordingly, compared to sample SL1 the SRO layers in sample SL3 have another orientation, another crystalline symmetry or both. Since the form of the MR curves in Figs. 11(a) and (c) as well as (b) and (d) are very similar, it appears probable that the -axis of the either tetragonal or orthorhombic structure is along the SL normal, i.e. that the second epitaxial relation shown in Fig. 8 is realized for sample SL3. The out-of-plane rotations shown in Fig. 11(a)-(d), however, do not allow for a discrimination of orthorhombic and tetragonal symmetry, since these rotations occur in the and planes that have equivalent symmetry in the two crystallographic structures.
Since the magnetocrystalline anisotropy energy of the SRO layers in sample SL3 is very large, fits of Eqs. (11-13) were made to the MR data of sample SL3 at 130 K. These fits are shown by the red lines in Fig. 12; as above the expressions were truncated at eighth order. The fitting of the curves to the data is fully convincing. However, since the functional form of the MR in Eqs. (11-13) is the same for orthorhombic and tetragonal symmetry, this agreement does not yet discriminate between the two crystalline structures. A discrimination is, however, possible by an analysis of the expansion coefficients in the expressions for the in-plane rotation. In case of tetragonal symmetry, the coefficients and for the two current-density directions have a definite relationship: , whereas the corresponding coefficients for the orthorhombic symmetry are independent of each other. The coefficients obtained at 130 K are shown for samples SL2 and SL3 as well as – for comparison – for sample SL1 in Table 2. In case of the first two samples the coefficients indeed show the alternating pattern as predicted for tetragonal symmetry, see Eqs. (12,13), whereas the corresponding coefficients obtained for sample SL1 do not show this pattern, see rightmost two columns of Table 2. Therefore we conclude from the angular dependent MR measurements that the SRO layers in samples SL2 and SL3 have tetragonal symmetry with the -axis along the SL normal. This conclusion is consistent with the conclusion of the HRTEM studies that the SRO layers in sample SL3 are not orthorhombic, see section III. We cannot firmly exclude, however, the existence of tetragonal domains with an in-plane -axis.
V Discussion and conclusions
In this work we have shown by a combination of two techniques, namely high-resolution transmission electron microscopy and angular dependent magnetoresistance measurements, that the SrRuO3 layers in a Pr0.7Ca0.3MnO3/SrRuO3 superlattice undergo a phase transition from orthorhombic to tetragonal structure, when the thickness of the PCMO layers is increased from 1.5 to 4 nm. The orthorhombic -axis of the SRO layers was found to lie in-plane, whereas the tetragonal -axis of the SRO layers seemed to be oriented along the SL normal; for the tetragonal orientation, however, the existence of crystallographic domains with in-plane -axis cannot be fully excluded. The results impressively demonstrate that this structural phase transition has a large impact on the magnetotransport properties. This is surprising, since the actual atomic displacements between the phases are rather small.
What drives this phase transition? An obvious candidate in case of thin films and superlattices is the strain. Indeed, the transition temperature for the orthorhombic(O)-to-tetragonal(T) transition was found to be substantially lowered in compressively strained SRO films grown on SrTiO3.Vailionis et al. (2007); Choi et al. (2010) Since PCMO has an even smaller lattice constant than STO, a further lowering of the OT-transition temperature might be expected; furthermore, the strain exerted by the PCMO layers is not biaxial, but anisotropic, which might also modify the strain effect. Since we observed the tetragonal structure of the SRO layers down to 10 K, this would mean that the strain effect had lowered the OT-transition temperature basically to zero. Although this scenario is not excluded, it might appear unlikely. In an alternative scenario the OT-transition might be influenced by the electronic or magnetic coupling between the PCMO and SRO layers. Here it would be interesting for future research to look for structural anomalies in these superlattices near the magnetic transition at 110 K and the charge ordering transition near 240 K.Tomioka et al. (1996)
Acknowledgements.
This work was supported by the German Science Foundation (DFG) within the Collaborative Research Center SFB 762 “Functionality of Oxide Interfaces”. We thank Dr. J. Henk for a careful reading of the manuscript.Appendix
The unit vector of the magnetization in the system of the SrTiO3 substrate crystal is written as such that is the angle between the magnetization and and is the angle between the magnetization and . The direction cosines of the magnetization and the current density are defined with respect to the crystallographic axes of the SRO film.
The formulas below just indicate the structure of the solutions. Unless indicated otherwise the coefficients in the equations – although throughout denoted by and – are different for the various rotation planes and current directions. Miller indices specify the rotation plane, the direction vector specifies the corresponding current density direction.
V.1 Epitaxial Relation 1, tetragonal symmetry (D4h)
V.1.1 /, . /, . /, .
| (2) |
V.1.2 /, .
| (3) |
V.1.3 /, . /, .
| (4) |
V.2 Epitaxial Relation 1, orthorhombic symmetry (D2h)
V.2.1 /, .
| (5) |
V.2.2 /, .
| (6) |
V.2.3 /, . /, .
| (7) |
V.2.4 /, .
| (8) |
V.2.5 /, .
| (9) |
V.3 Epitaxial Relation 1, monoclinic symmetry (C2h)
Compared to the orthorhombic symmetry there is only one modification:
V.3.1 /, .
| (10) |
V.4 Epitaxial Relation 2, tetragonal symmetry (D4h)
V.4.1 /, . /, . /, . /, .
| (11) |
Note that the coefficients in the expression for the first and third as well as the second and fourth configuration are the same.
V.4.2 /, .
| (12) |
V.4.3 /, .
| (13) |
Note that .
V.5 Epitaxial Relation 2, orthorhombic symmetry (D2h)
For orthorhombic symmetry the equations for the out-of-plane rotation configurations have the same structure as the corresponding ones for tetragonal symmetry specified in the preceding section. This comes from the fact that the choice of rotation planes to be the and planes does not allow for a discrimination of the orthorhombic - and -axes which are under 45 degrees with respect to the rotation planes. The symmetry of the in-plane rotation, however, leads to different expansions.
V.5.1 /, . /, .
| (14) |
References
- Reyren et al. (2007) N. Reyren, S. Thiel, A. D. Caviglia, L. Fitting-Kourkoutis, G. Hammerl, C. Richter, C. W. Schneider, T. Kopp, A.-S. Ruetschi, D. Jaccard, M. Gabay, D. A. Muller, J.-M. Triscone, and J. Mannhart, Science 317, 1196 (2007).
- Gajek et al. (2007) M. Gajek, M. Bibes, S. Fusil, K. Bouzehouane, J. Fontcuberta, A. Barthélémy, and A. Fert, Nature Materials 6, 296 (2007).
- Vrejoiu et al. (2008) I. Vrejoiu, M. Ziese, A. Setzer, P. Esquinazi, B. I. Birajdar, A. Lotnyk, M. Alexe, and D. Hesse, Appl. Phys. Lett. 92, 152506 (2008).
- Ziese et al. (2010a) M. Ziese, I. Vrejoiu, E. Pippel, P. Esquinazi, D. Hesse, C. Etz, J. Henk, A. Ernst, I. V. Maznichenko, W. Hergert, and I. Mertig, Phys. Rev. Lett. 104, 167203 (2010a).
- Ziese et al. (2010b) M. Ziese, I. Vrejoiu, and D. Hesse, Appl. Phys. Lett. 97, 052504 (2010b).
- Ke et al. (2004) X. Ke, M. S. Rzchowski, L. J. Belenky, and C. B. Eom, Appl. Phys. Lett. 84, 5458 (2004).
- Ke et al. (2005) X. Ke, L. J. Belenky, C. B. Eom, and M. S. Rzchowski, J. Appl. Phys. 97, 10K115 (2005).
- Padhan et al. (2006) P. Padhan, W. Prellier, and R. C. Budhani, Appl. Phys. Lett. 88, 192509 (2006).
- Lee et al. (2008) Y. Lee, B. Caes, and B. Harmon, Journal of Alloys and Compounds 450, 1 (2008).
- Cao et al. (1997) G. Cao, S. McCall, M. Shepard, J. E. Crow, and R. P. Guertin, Phys. Rev. B 56, 321 (1997).
- Klein et al. (1996) L. Klein, J. S. Dodge, C. H. Ahn, G. J. Snyder, T. H. Geballe, M. R. Beasley, and A. Kapitulnik, Phys. Rev. Lett. 77, 2774 (1996).
- Jirák et al. (1985) Z. Jirák, S. Krupička, Z. Šimša, M. Dlouhá, and S. Vratislav, J. Magn. Magn. Mater. 53, 153 (1985).
- Yoshizawa et al. (1995) H. Yoshizawa, H. Kawano, Y. Tomioka, and Y. Tokura, Phys. Rev. B 52, R13145 (1995).
- Ziese et al. (2010c) M. Ziese, I. Vrejoiu, and D. Hesse, Phys. Rev. B 81, 184418 (2010c).
- Gan et al. (1999) Q. Gan, R. A. Rao, C. B. Eom, L. Wu, and F. Tsui, J. Appl. Phys. 85, 5297 (1999).
- Scherzer (1949) O. Scherzer, J. Appl. Phys. 20, 20 (1949).
- Fujimoto et al. (2007) M. Fujimoto, H. Koyama, Y. Nishi, T. Suzuki, S. Kobayashi, Y. Tamai, and N. Awaya, J. Am. Ceram Soc. 90, 2205 (2007).
- Vailionis et al. (2008) A. Vailionis, W. Siemons, and G. Koster, Appl. Phys. Lett. 93, 051909 (2008).
- Döring and Simon (1960) W. Döring and G. Simon, Ann. Physik 460, 373 (1960).
- Döring and Simon (1961) W. Döring and G. Simon, Ann. Physik 463, 144 (1961).
- Döring (1957) W. Döring, Ann. Physik 456, 102 (1957).
- Zakharov et al. (1999) N. D. Zakharov, K. M. Satyalakshmi, G. Koren, and D. Hesse, J. Mater. Research 14, 4385 (1999).
- Kennedy and Hunter (1998) B. J. Kennedy and B. A. Hunter, Phys. Rev. B 58, 653 (1998).
- Ziese et al. (2010d) M. Ziese, F. Bern, I. Vrejoiu, E. Pippel, and D. Hesse, unpublished (2010d).
- Ziese et al. (2010e) M. Ziese, I. Vrejoiu, E. Pippel, E. Nikulina, and D. Hesse, unpublished (2010e).
- Kolesnik et al. (2006) S. Kolesnik, Y. Z. Yoo, O. Chmaissem, B. Dabrowski, T. Maxwell, C. W. Kimball, and A. P. Genis, J. Appl. Phys. 99, 08F501 (2006).
- Vailionis et al. (2007) A. Vailionis, W. Siemons, and G. Koster, Appl. Phys. Lett. 91, 071907 (2007).
- Choi et al. (2010) K. J. Choi, S. H. Baek, H. W. Jang, L. J. Belenky, M. Lyubchenko, and C.-B. Eom, Adv. Mater. 22, 759 (2010).
- Tomioka et al. (1996) Y. Tomioka, A. Asamitsu, H. Kuwahara, Y. Moritomo, and Y. Tokura, Phys. Rev. B 53, R1689 (1996).