Quiescent X-ray variability from the neutron star transient Aql X-1
Abstract
A number of studies have revealed variability from neutron star low-mass X-ray binaries during quiescence. Such variability is not well characterised, or understood, but may be a common property that has been missed due to lack of multiple observations. One such source where variability has been observed is Aql X-1. Here, we analyse 14 Chandra and XMM-Newton observations of Aql X-1 in quiescence, covering a period of approximately 2 years. There is clear variability between the epochs, with the most striking feature being a flare-like increase in the flux by a factor of 5. Spectral fitting is inconclusive as to whether the power-law and/or thermal component is variable. We suggest that the variability and flare-like behaviour during quiescence is due to accretion at low rates which might reach the neutron star surface.
keywords:
accretion, accretion discs — stars: neutron — stars: individual (Aql X-1) — X-rays: binaries1 Introduction
Transient neutron star low-mass X-ray binaries spend the majority of their lifetime in a quiescent state and only a small amount of the time in outburst, accreting at a significantly higher rate (). During quiescence the X-ray spectrum is typically characterised by a thermal and/or power-law component. The thermal component is most frequently interpreted as emission from the neutron star surface. In the deep crustal heating scenario (Brown, Bildsten & Rutledge, 1998), pycnonuclear reactions occur in the inner crust during outburst due to compression of the crust by accreted material. Energy deposited by these reactions heats the neutron star core on a timescale of yr, where it reaches a steady state luminosity set by the time-averaged mass accretion rate. The neutron star should therefore have a minimum thermal luminosity due to these processes. This thermal emission is fit well by neutron star atmosphere models, which could open the possibility of measuring the neutron star radius (e.g., Rutledge et al., 1999).
The origin of the power-law component, however, remains poorly understood. A number of emission mechanisms have been suggested involving on-going low levels of accretion, but whether the gas impacts the neutron star surface (e.g., Menou & McClintock, 2001), is stopped at the magnetospheric radius, or whether there is a shock between a radio pulsar relativistic wind and matter transferred from the companion star (see the review by Campana et al., 1998) is unclear. Moreover, on-going accretion onto the neutron star surface could potentially produce a thermal-like spectrum (Zampieri et al., 1995).
Variability has been observed during quiescence in a number of sources, with variability seen over a wide range of timescales from hundreds of seconds through to years (Campana et al., 1997, 2004; Rutledge et al., 2000, 2001b, 2002; Cackett et al., 2005; Cackett et al., 2010; Muno et al., 2007; Fridriksson et al., 2010; Fridriksson et al., 2011). In the majority of cases, the variability has either been attributed to the power-law component or its origin remains unclear. However, our recent observations of Cen X-4 showed variability as large as a factor of 4.4 which could only be fit by variability in both the thermal and power-law components (Cackett et al., 2010). Another source showing particularly interesting quiescent variability is XTE J1701462 (Fridriksson et al., 2010; Fridriksson et al., 2011). In this source, an overall cooling of the thermal component has been observed after a long outburst lasting 2 years. However, on two occasions a sudden short-term flare has been observed, with the brightest one rising to a flux about 20 times the normal quiescent level. Such flares are presumably due to sporadic increases in accretion rate during quiescence.
The focus of this current work is Aql X-1, one of the sources where variability has been observed both on short (hundreds of seconds) and long (months) timescales (Rutledge et al., 2002). However, the nature of this variability has been debated. While Rutledge et al. (2002) conclude that the thermal component is variable, a subsequent analysis by Campana & Stella (2003) showed that correlated changes in the power-law index and column density can also describe the data. Having recently found large amplitude quiescent variability in Cen X-4, we also searched for further variability in archival observations of Aql X-1. In addition to the 4 observations analysed by Rutledge et al. (2002) and Campana & Stella (2003), we analyse a further 10 quiescent observations performed about a year later. In section 2 we detail the data reduction, section 3 describes the spectral analysis, and in section 4 we discuss our findings.
2 Data Reduction
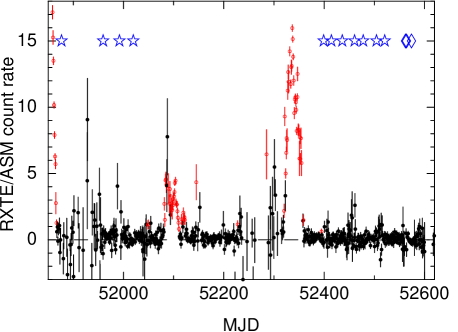
Here we analyse a total of 14 observations of Aql X-1 in a quiescent state (11 with Chandra, 3 with XMM-Newton), all the available archival Chandra and XMM-Newton observations of Aql X-1 in quiescence. In Table 1 we give details of these 14 observations. Figure 1 shows the one-day averaged lightcurve from the RXTE All-sky monitor (ASM), with the times of these observations marked. Two outbursts occur between the first four Chandra observations and the last 10 Chandra/XMM-Newton observations. All observations analysed here are clearly at times when Aql X-1 is undetected by the RXTE/ASM. The 1-day average detection threshold (2 – 10 keV) for the ASM is approximately 10 mCrab (Levine et al., 1996).
| Observation | Start date | MJD | Mission/Instrument | ObsID | Exp. time | Net count rate |
|---|---|---|---|---|---|---|
| dd/mm/yy | mid observation | (ksec) | (c s-1) | |||
| CXO1 | 28/11/00 | 51876.5 | Chandra/ACIS-S | 708 | 6.6 | |
| CXO2 | 19/02/01 | 51959.5 | Chandra/ACIS-S | 709 | 7.8 | |
| CXO3 | 23/03/01 | 51991.9 | Chandra/ACIS-S | 710 | 7.4 | |
| CXO4 | 20/04/01 | 52019.6 | Chandra/ACIS-S | 711 | 9.2 | |
| CXO5 | 04/05/02 | 52399.0 | Chandra/ACIS-S | 3484 | 6.5 | |
| CXO6 | 20/05/02 | 52414.4 | Chandra/ACIS-S | 3485 | 7.0 | |
| CXO7 | 11/06/02 | 52436.2 | Chandra/ACIS-S | 3486 | 6.5 | |
| CXO8 | 05/07/02 | 52460.7 | Chandra/ACIS-S | 3487 | 5.9 | |
| CXO9 | 22/07/02 | 52477.9 | Chandra/ACIS-S | 3488 | 6.5 | |
| CXO10 | 18/08/02 | 52504.4 | Chandra/ACIS-S | 3489 | 7.1 | |
| CXO11 | 03/09/02 | 52520.7 | Chandra/ACIS-S | 3490 | 6.9 | |
| XMM1 | 15/10/02 | 52562.1 | XMM-Newton/MOS | 0112440301 | 7.1 | (MOS1) |
| (MOS2) | ||||||
| XMM2 | 17/10/02 | 52564.2 | XMM-Newton/MOS | 0112440401 | 13.4 | (MOS1) |
| (MOS2) | ||||||
| XMM3 | 27/10/02 | 52574.1 | XMM-Newton/MOS | 0112440101 | 2.7 | (MOS1) |
| (MOS2) |
2.1 Chandra data reduction
We reduced the Chandra data using the CIAO software (v4.2) and the most
recent calibration database (CALDB v4.3.1). All observations were performed
using the ACIS-S detector, with a 1/8 sub-array to give a frame time of
0.44s and the source placed off-axis where the PSF is significantly larger. Both these choices mitigate pile-up
(see Rutledge et al., 2002), even for the brightest observation here. In all cases, we followed the standard data reduction
threads111see http://cxc.harvard.edu/ciao/threads/, using the
chandra_repro script to reprocess the data
with the latest calibration. The source spectrum was extracted using a circular
region of radius 10 pixels, and the background spectrum was extracted from a
source-free annulus with inner radius 20 pixels and outer radius 60 pixels. The
response matrix (rmf) and ancillary response file (arf) were generated with the
mkacisrmf and mkarf scripts.
2.2 XMM-Newton data reduction
All three XMM-Newton observations analysed here were performed with the PN
detector operated in timing mode. As the source was in quiescence during these
observations, the timing mode data is not of a high quality and the source is only detectable when a restricted energy range is used. We therefore analyse only the data for the two MOS detectors, which were both operated in full frame mode with the thin filter for each observation. These MOS data were
reduced using the XMMSAS software (v10.0.0), with the latest ‘current
calibration files’, producing calibrated event lists from the Observation Data
Files using emproc.
There was no significant background flaring in the first (0112440301) or second (0112440401) XMM-Newton observations analysed here. However, during the third observation (0112440101), there was a bright background flare at the end of the observation. We searched for background flares by filtering the lightcurve from the whole detector for single events (pattern zero) with energies above 10 keV. We excluded times when the count rate from this filtered lightcurve was greater than 2 counts s-1. This reduced the exposure by approximately 0.5 ks.
Using the evselect tool, the source spectra were extracted from a
circular region of radius 32″, where as the background spectra were
extracted from an annulus with inner radius 60″and outer radius
250″. We selected for events with patterns 0 – 12 only. The rmf and arf
were generated with the rmfgen and arfgen tools.
3 Spectral Analysis
The spectra were modelled using the XSPEC (v12) spectral fitting package (Arnaud, 1996). All spectra were grouped to a minimum of 20 counts per bin in the 0.5 – 10 keV energy range, and the models were only fit over this energy range. All uncertainties are quoted at the 1 confidence level.
An initial look at the raw count rates from the eleven Chandra
observations (see Table 1) demonstrates there is variability between
the observations. For
instance, CXO7 has a count rate about 4 times higher than CXO10.
Initially we fit all the spectra individually with an absorbed neutron star
atmosphere model, using the phabs model for
photoelectric absorption and the nsatmos model (Heinke et al., 2006) for the
neutron star atmosphere. From these fits, it is clear that half of the
spectra are fit well () by just an absorbed neutron star
atmosphere model, but that the other half require an additional power-law
component. The observations that require a power-law
component ( without it) are CXO3, CXO4, CXO5, CXO6, CXO7,
CXO11 and XMM2. Note that in most of those fits the power-law index is poorly
constrained, and all spectra are consistent with having the same index at the
1 level. In these fits where the power-law is required, the
index ranges from approximately -1 to 2, but the uncertainties are such that
they are all consistent with .
In order to determine which spectral parameters are variable between the observations, we fit all the spectra jointly. Here, we fit an absorbed neutron star atmosphere plus power-law model. We include the power-law component for all observations, allowing the normalisation to be a free parameter. Given that in the individual fits the power-law index was consistent with being constant, we tied the power-law index between all observations. From the individual fits, we also find that the column density is consistent between all the observations, and therefore we tie this parameter. We also assume a canonical neutron star mass and radius (1.4 , 10 km), and that the entire neutron star surface is emitting (these parameters were all fixed). We assume a distance of 5 kpc throughout, as also adopted in previous work (e.g. Rutledge et al., 2002). For a discussion of the distance to Aql X-1 see Rutledge et al. (2001a) who find the distance is between 4 and 6.5 kpc.
In the first instance, we tie the neutron star atmosphere temperature between all observations (the spectral parameters are given in Table 2 and all uncertainties quoted there, and throughout the paper, are at the 1 confidence level). This allowed us to investigate whether variability in the power-law normalisation alone can fit the data. This provides an adequate fit to the data (, null hypothesis probability = 0.057), with an effective temperature (for an observer at infinity) of eV, power-law index, and power-law normalisation ranging from a non-detection in XMM2 to approximately photons keV-1 cm-2 s-1 at 1 keV in CXO7. The variability of the unabsorbed 0.5 – 10 keV power-law flux is shown in Figure 2 for this model. Note that the column density we determine is consistent with values determined from previous work, as well as optical photometry and 21 cm emission (see Rutledge et al., 2002, for a discussion of the reddening towards Aql X-1).
| Obs. | Power law norm. | 0.5 – 10 keV flux | Thermal | (dof) | ||||
|---|---|---|---|---|---|---|---|---|
| ( cm-2) | (eV) | () | ( erg cm-2 s-1) | ( erg s-1) | fraction | |||
| Power-law normalisation variable, temperature tied | ||||||||
| CXO1 | 1.10 (533) | |||||||
| CXO2 | ||||||||
| CXO3 | ||||||||
| CXO4 | ||||||||
| CXO5 | ||||||||
| CXO6 | ||||||||
| CXO7 | ||||||||
| CXO8 | ||||||||
| CXO9 | ||||||||
| CXO10 | ||||||||
| CXO11 | ||||||||
| XMM1 | ||||||||
| XMM2 | ||||||||
| XMM3 | ||||||||
| Temperature and power-law normalisation variable | ||||||||
| CXO1 | 0.88 (520) | |||||||
| CXO2 | ||||||||
| CXO3 | ||||||||
| CXO4 | ||||||||
| CXO5 | ||||||||
| CXO6 | ||||||||
| CXO7 | ||||||||
| CXO8 | ||||||||
| CXO9 | ||||||||
| CXO10 | ||||||||
| CXO11 | ||||||||
| XMM1 | ||||||||
| XMM2 | ||||||||
| XMM3 | ||||||||

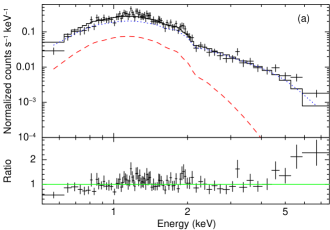
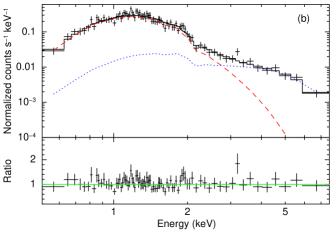
While the model with only the power-law normalisation variable between observations fits the data well, examining the residuals of the brightest observation (CXO7) it seems that the steep power-law is attempting to mimic a soft thermal component, and the residuals show an upturn above 4 keV (see Figure 3). Note that while this is not statistically significant, it would appear to suggest the spectrum should be dominated by a thermal component at soft energies rather than the power-law. We therefore also fit the data allowing both the power-law normalisation and the temperature of the neutron star atmosphere to vary. The results of those fits are also given in Table 2. A good fit, with a lower , is achieved (). In this case a much flatter power-law index is found, . A power-law consistent with a slope of 1 – 2 is quite typical for quiescent neutron stars. With this model we find significant variability in the effective temperature of the neutron star atmosphere component, ranging from approximately eV (with typical 1 uncertainties of 1 eV), in addition to variability in the power-law normalisation. In Figure 4 we show the 0.5 – 10 keV flux, effective temperature and unabsorbed 0.5 – 10 keV power-law flux from this model. For comparison, we show the spectral fit to CXO7 for both models in Figure 3, note that the residuals are much flatter at both high and low energy in the fit where both the temperature and the power-law normalisation are allowed to vary.
We also investigated a fit with both the power-law index and normalisation tied between all observations. It provides a significantly worse fit (, null hypothesis probability = ), and cannot match the spectrum of the brightest observations above 3 keV, underpredicting the flux at 5 keV by a factor of . As discussed in the Introduction, Campana & Stella (2003) described the first four Chandra observations by correlated changes in the power-law index and column density. Note that when fitting the spectra individually, the values are all consistent with remaining unchanged, and as mentioned above, so are the power-law indices. Moreover, given that a good fit can be achieved without the power-law index or being variable, we do not test this model further.
The three XMM-Newton observations have some of the lowest 0.5 – 10 keV fluxes of all the observations. While this change may be real, we caution that part of the difference in flux with the closest Chandra observations could potentially be due to cross-calibration differences between the two missions. Differences of 10% between Chandra and XMM-Newton soft X-ray fluxes have been seen in cross-calibration studies (e.g. Tsujimoto et al., 2011).
We also investigated the effect of having fit all the data simultaneously with multiple parameters tied between the spectra. With such a method, the spectrum with the highest signal-to-noise ratio can potentially dominate the fit, and skew the parameters. However, we find that this is not the case here. Removing the best spectrum, CXO7, from the fit with both temperature and power-law normalisation variable, we find that both tied parameters (the power-law index and ) remain consistent with their former values, with and cm-2.

As an aside, we note that we searched for any obvious variability or flaring within the individual lightcurves of each observation. There is no dramatic variability present (though see Rutledge et al., 2002, for power density spectra of the first four Chandra observations), and we do not investigate this further here.
4 Discussion
We have analysed 14 observations of Aql X-1 in quiescence, with the observations spanning a period of approximately 2 years. Variability in the first four observations has been studied previously (Rutledge et al., 2002; Campana & Stella, 2003). Here, we find variability between the different observations, with a particularly striking flare showing a change in 0.5 – 10 keV flux by a factor of 5 between the peak of the flare (CXO7) and the next observation (CXO8). If the three observations around MJD 52400 are from the same event, then the flare lasted approximately 60 days, with observations CXO5 and CXO6 seemingly catching the rise of the flare. However, with the sparse sampling we cannot be sure that this was a single flare event or not. The ratio of the maximum to minimum observed 0.5 – 10 keV flux is 7 – 8 (depending on the spectral model assumed).
We fitted the spectra with an absorbed neutron star atmosphere plus power-law model. In the first instance, the only parameter allowed to vary between the observations was the power-law normalisation, i.e. we assume that the temperature of the neutron star surface remains the same at all epochs. Such a model fits the data adequately (), and requires a power-law with a steep slope (). Alternatively, we also fit the data allowing both the effective temperature and power-law normalisation vary, which, of course, also fits well (). In this case, the power-law index is much flatter (), and the thermal component dominates the spectrum at all epochs (with thermal fractions typically 0.7 – 0.9). Given that both models provide a good fit to the data, we are unable to conclusively determine which spectral component is driving the variability.
Comparing the times of the quiescent observations with the RXTE/ASM lightcurve (Fig 1), the last significant (3) detection at the end of the outburst (before the flare) with the RXTE/ASM was on MJD 52355. A pointed RXTE/PCA observation detects Aql X-1 on MJD 52366 with a 2 – 10 keV flux of erg s-1 cm-2, however, a subsequent (and final) pointed observation two days later does not provide a clear detection, and gives an upper limit to the 2 – 10 keV flux of approximately erg s-1 cm-2. Therefore, the first of the three bright observations (CXO5, 6 and 7) occurs about 33 days after the end of a full outburst (taking the last detection with the PCA as the approximate end of the outburst).
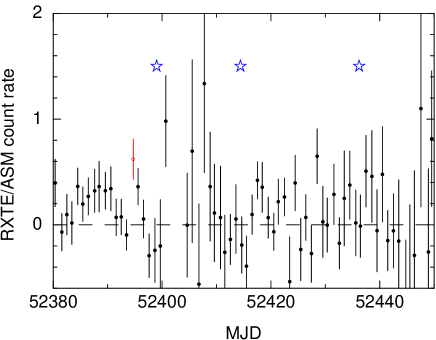
Figure 5 shows the RXTE/ASM 1-day averaged lightcurve around the times of the three brightest quiescent observations. Clearly, there is no apparent flaring detected by the ASM. There is only one data point at a significance greater than 3, and that occurs approximately 5 days before CXO5 (the observation on MJD 52399). Given the surrounding non-detections, this point is likely a statistical fluctuation and not a real detection. Even so, Aql X-1 was not accreting at close to outburst levels near the quiescent flare we observed.
One source of variability in quiescence is thermal relaxation of the neutron star crust after the end of an outburst (Rutledge et al., 2002), which has now been observed in four sources (e.g. Cackett et al., 2006; Fridriksson et al., 2010; Degenaar et al., 2010). As CXO5, 6 and 7 occur close to the end of an outburst, it may be possible that thermal relaxation of the crust could lead to variability in the thermal component. Thus far, only an overall luminosity decrease over time has been observed. However, depending on the microphysics of the crust and core, an increase can be achieved as heat from pycnonuclear reactions diffuses to the top of the crust (Ushomirsky & Rutledge, 2001; Rutledge et al., 2002). The largest fractional variability would come from sources with long recurrence times between outbursts and from neutron stars with enhanced levels of core neutrino emission. But, as noted by Ushomirsky & Rutledge (2001), the quiescent luminosity of Aql X-1 is inconsistent with rapid cooling (Brown et al., 1998) and it has a short recurrence time ( yr), thus the observed quiescent variability in this source cannot be due to thermal relaxation of the crust. Furthermore, the observed flare is not just due to the thermal component - the thermal fraction is lowest during the flare and there is a significant and clearly variable power-law component. Note also that CXO1 also occurs directly after the end of an outburst, and is hotter than the 3 subsequent observations. While it is tempting to speculate that the neutron star was hotter in CXO1 than CXO 2 – 4 because of thermal relaxation of the crust, the arguments of Ushomirsky & Rutledge (2001) (discussed above), would seem to rule that out.
While thermal relaxation of the crust does not appear to explain the flare, it may still be possible that the flare is associated with the previous outburst. A double outburst was recently seen from the accretion-powered millisecond pulsar IGR J00291+5934 (Patruno, 2010; Hartman et al., 2011; Papitto et al., 2011), where two approximately 10 day long outbursts were separated by only 30 days in quiescence. Discussing these two outbursts, Hartman et al. (2011) suggest that they are connected – the first outburst is stopped by the propeller effect before the disc is completely depleted, leaving material in the disc for the second outburst. The first brighter observation in Aql X-1 is also approximately 30 days after the end of an outburst, however, unlike IGR J00291+5934 the increase in Aql X-1 does not get close to outburst levels (Aql X-1 is not detected by the RXTE/ASM near the brightest observations), thus it is not clear whether a similar mechanism applies here.
In addition to Aql X-1, flaring (by which we mean short lasting, sharp rises in flux) during quiescence has recently been observed in the neutron star low-mass X-ray binaries XTE J1701462 (Fridriksson et al., 2010) and Cen X-4 (Cackett et al., 2010). In XTE J1701462, an increase in X-ray flux by a factor of almost 3 (to a peak observed 0.5 – 10 keV luminosity of erg s-1) was observed approximately 230 days after the end of an outburst on top of an overall decreasing X-ray flux presumably associated with thermal relaxation of the crust (Fridriksson et al., 2010). The increased flux lasted a maximum of approximately 120 days (the time between the quiescent observations on either side of the increased flux). Since then, further X-ray monitoring of this source during quiescence showed another X-ray flare about 1075 days into quiescence. This time, the flare was significantly brighter, with a peak observed increase of a factor of 20 in flux (reaching a maximum luminosity of erg s-1) and lasting 10 – 20 days in total (Fridriksson et al., 2011). Interestingly, like Aql X-1, in XTE J1701462 the thermal component does increase during the flares, but the non-thermal component increases faster leading to a thermal fraction that is lower during the flares than at other times in quiescence (Fridriksson et al., 2011).
In Cen X-4, quiescent observations spanning 15 years showed substantial variability between epochs (Cackett et al., 2010). Additionally, examination of the lightcurves from individual observations revealed a short flare in one of the XMM-Newton observations. This flare lasted 2 ks and showed an increase of approximately a factor of 4 in count rate at the peak. The natural explanation for this flaring activity in both these sources appears to be increased levels of ongoing accretion during quiescence, which presumably is occurring in Aql X-1 too. The exact mechanism for this accretion is unclear (as discussed in the Introduction, the origin of the power-law component is uncertain), but the clear variability in the thermal component in Cen X-4, and the apparent connection between the power-law and thermal components (the thermal fraction remained roughly constant) may suggest that accreting material reaches the neutron star surface.
Another class of objects that are particularly interesting are the very faint X-ray transients (VFXTs) whose peak 2 – 10 keV luminosity during outburst only reaches erg s-1. With such low peak luminosities, these sources are missed by all-sky monitors. However, frequent monitoring of the Galactic Centre region by multiple X-ray missions (e.g. Chandra, XMM-Newton and Swift), has revealed a number of these sources (see, e.g. Muno et al., 2005; Sakano et al., 2005; Wijnands et al., 2006; Degenaar & Wijnands, 2009, 2010). The frequent monitoring has revealed flare-like behaviour in-between normal quiescent and outburst levels in four sources (Degenaar & Wijnands, 2009, 2010). The flares last typically 1 – 2 weeks, and the peak brightness can vary substantially, though one source (XMM J1744572850.3) has shown a flare with a peak luminosity as low as seen here in Aql X-1. Several (though not all) of these VFXTs are confirmed as neutron star sources as they have shown type-I X-ray bursts.
Variability in quiescence is not limited to just neutron stars. Several of the brighter quiescent stellar-mass black holes have also been observed to vary in several sources (V404 Cyg, 4U 163047, GX 3394, A062000, and GRO J165540: Wagner et al., 1994; Parmar et al., 1997; Kong et al., 2000, 2002; Hynes et al., 2004; Bradley et al., 2007; Miller-Jones et al., 2008). The best studied of these is V404 Cyg. This object has been observed to vary by as much as a factor of 20 in X-ray count rate during one short flare (Hynes et al., 2004), and has been variable during the observation on every occasion when observed by Chandra or XMM-Newton (Kong et al., 2002; Hynes et al., 2004; Bradley et al., 2007). Also interesting is that the X-ray variability is correlated with optical variability, with the H line variability seemingly powered by X-ray irradiation (Hynes et al., 2004). Moreover, sensitive radio observations of V404 Cyg in quiescence detect the source and even find a short flare, with a rise time of 30 minutes (Miller-Jones et al., 2008). The radio emission appears to be non-thermal and therefore may originate in a compact jet. Of course, in these objects there is no stellar surface, thus variability here cannot involve any stellar surface or stellar magnetic field. While it has been suggested that coronal emission from the rapidly rotating secondary star could be the source of the quiescent X-ray emission in black hole sources (Bildsten & Rutledge, 2000), the X-ray luminosity of several sources exceeds the maximum predicted by the coronal model (e.g. Kong et al., 2002).
Quiescent variability and flaring has also been seen in nearby quiescent supermassive black holes. For instance, the supermassive black hole at the centre of the Galaxy, Sgr A*, has shown significant flaring behaviour at X-ray, IR and radio wavelengths (e.g. Baganoff et al., 2001; Genzel et al., 2003; Zhao et al., 2003; Porquet et al., 2003; Porquet et al., 2008). The brightest X-ray flare from Sgr A* showed an increase by a factor of 160 in 2-10 keV luminosity with a duration shorter than one hour (Porquet et al., 2003). More recently, the supermassive black hole at the centre of Andromeda, M31*, has also shown X-ray variability and flaring activity (Garcia et al., 2010; Li et al., 2010). Thus, while any mechanism for such flares is not clear (e.g. Yuan et al., 2004; Maitra et al., 2009, and references therein), it may suggest that flaring is a standard property of accretion at low rates, though the stellar surface and magnetic field of neutron stars may lead to a different inner accretion geometry.
The standard model used to explain the transient behaviour and outburst cycles in X-ray binaries is the disc instability model (e.g. King & Ritter, 1998; Hameury et al., 1998; Menou et al., 2000; Dubus et al., 2001; Lasota, 2001). During quiescence, as long as the mass accretion rate is smaller than some critical value everywhere in the disc, accretion can continue (see for example the discussion in Kuulkers, in’t Zand & Lasota, 2009). However, the disc instability model does not make any strong predictions for variability during quiescence, and Dubus et al. (2001) discuss how flaring after the end of an outburst such as that observed in GRO J0422+32 (Callanan et al., 1995) are not understood. Similarly, it appears that the variability seen in Aql X-1 and XTE J1701-462 can not readily be explained in the disc instability framework.
Finally, the short 2 ks flare seen in the X-ray lightcurve of Cen X-4 may have a different origin (not related to the disc instability model). Such short 30 – 60 min flares are also seen in the optical lightcurve of Cen X-4 (Shahbaz et al., 2010). Shahbaz et al. (2010) suggest that the most likely model for those flares is blackbody radiation from an optically thin layer of recombining hydrogen (similar to the model for solar flares), and must occupy a small (0.3 per cent) area of the disc. Further monitoring of quiescent X-ray binaries is required to understand the prevalence of such variability and flares.
Acknowledgements
EMC thanks Andy Fabian, Jim Pringle and Ramesh Narayan for interesting and insightful conversations about accretion at low rates. RW acknowledges support from a European Research Council Starting Grant.
References
- Arnaud (1996) Arnaud K. A., 1996, in ASP Conf. Ser. 101: Astronomical Data Analysis Software and Systems V XSPEC: The First Ten Years. p. 17
- Baganoff et al. (2001) Baganoff F. K., Bautz M. W., Brandt W. N., Chartas G., Feigelson E. D., Garmire G. P., Maeda Y., Morris M., Ricker G. R., Townsley L. K., Walter F., 2001, Nature, 413, 45
- Bildsten & Rutledge (2000) Bildsten L., Rutledge R. E., 2000, ApJ, 541, 908
- Bradley et al. (2007) Bradley C. K., Hynes R. I., Kong A. K. H., Haswell C. A., Casares J., Gallo E., 2007, ApJ, 667, 427
- Brown et al. (1998) Brown E. F., Bildsten L., Rutledge R. E., 1998, ApJ, 504, L95
- Cackett et al. (2010) Cackett E. M., Brown E. F., Miller J. M., Wijnands R., 2010, ApJ, 720, 1325
- Cackett et al. (2005) Cackett E. M., Wijnands R., Heinke C. O., Edmonds P. D., Lewin W. H. G., Pooley D., Grindlay J. E., Jonker P. G., Miller J. M., 2005, ApJ, 620, 922
- Cackett et al. (2006) Cackett E. M., Wijnands R., Linares M., Miller J. M., Homan J., Lewin W. H. G., 2006, MNRAS, 372, 479
- Callanan et al. (1995) Callanan P. J., Garcia M. R., McClintock J. E., Zhao P., Remillard R. A., Bailyn C. D., Orosz J. A., Harmon B. A., Paciesas W. S., 1995, ApJ, 441, 786
- Campana et al. (1998) Campana S., Colpi M., Mereghetti S., Stella L., Tavani M., 1998, AA&AR, 8, 279
- Campana et al. (2004) Campana S., Israel G. L., Stella L., Gastaldello F., Mereghetti S., 2004, ApJ, 601, 474
- Campana et al. (1997) Campana S., Mereghetti S., Stella L., Colpi M., 1997, A&A, 324, 941
- Campana & Stella (2003) Campana S., Stella L., 2003, ApJ, 597, 474
- Degenaar & Wijnands (2009) Degenaar N., Wijnands R., 2009, A&A, 495, 547
- Degenaar & Wijnands (2010) Degenaar N., Wijnands R., 2010, A&A, 524, A69
- Degenaar et al. (2010) Degenaar N., Wolff M. T., Ray P. S., Wood K. S., Homan J., Lewin W. H. G., Jonker P. G., Cackett E. M., Miller J. M., Brown E. F., Wijnands R., 2010, MNRAS, in press, arXiv:1007.0247
- Dubus et al. (2001) Dubus G., Hameury J., Lasota J., 2001, A&A, 373, 251
- Fridriksson et al. (2011) Fridriksson J. K., et al., 2011, ApJ, submitted, arXiv:1101.0081
- Fridriksson et al. (2010) Fridriksson J. K., Homan J., Wijnands R., Méndez M., Altamirano D., Cackett E. M., Brown E. F., Belloni T. M., Degenaar N., Lewin W. H. G., 2010, ApJ, 714, 270
- Garcia et al. (2010) Garcia M. R., Hextall R., Baganoff F. K., Galache J., Melia F., Murray S. S., Primini F. A., Sjouwerman L. O., Williams B., 2010, ApJ, 710, 755
- Genzel et al. (2003) Genzel R., Schödel R., Ott T., Eckart A., Alexander T., Lacombe F., Rouan D., Aschenbach B., 2003, Nature, 425, 934
- Hameury et al. (1998) Hameury J., Menou K., Dubus G., Lasota J., Hure J., 1998, MNRAS, 298, 1048
- Hartman et al. (2011) Hartman J. M., Galloway D. K., Chakrabarty D., 2011, ApJ, 726, 26
- Heinke et al. (2006) Heinke C. O., Rybicki G. B., Narayan R., Grindlay J. E., 2006, ApJ, 644, 1090
- Hynes et al. (2004) Hynes R. I., Charles P. A., Garcia M. R., Robinson E. L., Casares J., Haswell C. A., Kong A. K. H., Rupen M., Fender R. P., Wagner R. M., Gallo E., Eves B. A. C., Shahbaz T., Zurita C., 2004, ApJ, 611, L125
- King & Ritter (1998) King A. R., Ritter H., 1998, MNRAS, 293, L42
- Kong et al. (2000) Kong A. K. H., Kuulkers E., Charles P. A., Homer L., 2000, MNRAS, 312, L49
- Kong et al. (2002) Kong A. K. H., McClintock J. E., Garcia M. R., Murray S. S., Barret D., 2002, ApJ, 570, 277
- Kuulkers et al. (2009) Kuulkers E., in’t Zand J. J. M., Lasota J., 2009, A&A, 503, 889
- Lasota (2001) Lasota J., 2001, New Astronomy Reviews, 45, 449
- Levine et al. (1996) Levine A. M., Bradt H., Cui W., Jernigan J. G., Morgan E. H., Remillard R., Shirey R. E., Smith D. A., 1996, ApJ, 469, L33+
- Li et al. (2010) Li Z., Garcia M. R., Forman W. R., Jones C., Kraft R. P., Lal D. V., Murray S. S., Wang Q. D., 2010, ApJL, submitted, arXiv:1011.1224
- Maitra et al. (2009) Maitra D., Markoff S., Falcke H., 2009, A&A, 508, L13
- Menou et al. (2000) Menou K., Hameury J., Lasota J., Narayan R., 2000, MNRAS, 314, 498
- Menou & McClintock (2001) Menou K., McClintock J. E., 2001, ApJ, 557, 304
- Miller-Jones et al. (2008) Miller-Jones J. C. A., Gallo E., Rupen M. P., Mioduszewski A. J., Brisken W., Fender R. P., Jonker P. G., Maccarone T. J., 2008, MNRAS, 388, 1751
- Muno et al. (2005) Muno M. P., Pfahl E., Baganoff F. K., Brandt W. N., Ghez A., Lu J., Morris M. R., 2005, ApJ, 622, L113
- Muno et al. (2007) Muno M. P., Wijnands R., Wang Q. D., Park S., Brandt W. N., Bauer F. E., Wang Z., 2007, The Astronomer’s Telegram, 1013
- Papitto et al. (2011) Papitto A., Riggio A., Burderi L., Di Salvo T., D’Aí A., Iaria R., 2011, A&A, in press, arXiv:1006.1303
- Parmar et al. (1997) Parmar A. N., Williams O. R., Kuulkers E., Angelini L., White N. E., 1997, A&A, 319, 855
- Patruno (2010) Patruno A., 2010, ApJ, 722, 909
- Porquet et al. (2008) Porquet D., Grosso N., Predehl P., Hasinger G., Yusef-Zadeh F., Aschenbach B., Trap G., Melia F., Warwick R. S., Goldwurm A., Bélanger G., Tanaka Y., Genzel R., Dodds-Eden K., Sakano M., Ferrando P., 2008, A&A, 488, 549
- Porquet et al. (2003) Porquet D., Predehl P., Aschenbach B., Grosso N., Goldwurm A., Goldoni P., Warwick R. S., Decourchelle A., 2003, A&A, 407, L17
- Rutledge et al. (1999) Rutledge R. E., Bildsten L., Brown E. F., Pavlov G. G., Zavlin V. E., 1999, ApJ, 514, 945
- Rutledge et al. (2000) Rutledge R. E., Bildsten L., Brown E. F., Pavlov G. G., Zavlin V. E., 2000, ApJ, 529, 985
- Rutledge et al. (2001a) Rutledge R. E., Bildsten L., Brown E. F., Pavlov G. G., Zavlin V. E., 2001a, ApJ, 559, 1054
- Rutledge et al. (2001b) Rutledge R. E., Bildsten L., Brown E. F., Pavlov G. G., Zavlin V. E., 2001b, ApJ, 551, 921
- Rutledge et al. (2002) Rutledge R. E., Bildsten L., Brown E. F., Pavlov G. G., Zavlin V. E., 2002, ApJ, 577, 346
- Rutledge et al. (2002) Rutledge R. E., Bildsten L., Brown E. F., Pavlov G. G., Zavlin V. E., Ushomirsky G., 2002, ApJ, 580, 413
- Sakano et al. (2005) Sakano M., Warwick R. S., Decourchelle A., Wang Q. D., 2005, MNRAS, 357, 1211
- Shahbaz et al. (2010) Shahbaz T., Dhillon V. S., Marsh T. R., Casares J., Zurita C., Charles P. A., 2010, MNRAS, 403, 2167
- Tsujimoto et al. (2011) Tsujimoto M., Guainazzi M., Plucinsky P. P., Beardmore A. P., Ishida M., Natalucci L., Posson-Brown J. L. L., Read A. M., Saxton R. D., Shaposhnikov N. V., 2011, A&A, 525, A25+
- Ushomirsky & Rutledge (2001) Ushomirsky G., Rutledge R. E., 2001, MNRAS, 325, 1157
- Wagner et al. (1994) Wagner R. M., Starrfield S. G., Hjellming R. M., Howell S. B., Kreidl T. J., 1994, ApJ, 429, L25
- Wijnands et al. (2006) Wijnands R., in’t Zand J. J. M., Rupen M., Maccarone T., Homan J., Cornelisse R., Fender R., Grindlay J., van der Klis M., Kuulkers E., Markwardt C. B., Miller-Jones J. C. A., Wang Q. D., 2006, A&A, 449, 1117
- Yuan et al. (2004) Yuan F., Quataert E., Narayan R., 2004, ApJ, 606, 894
- Zampieri et al. (1995) Zampieri L., Turolla R., Zane S., Treves A., 1995, ApJ, 439, 849
- Zhao et al. (2003) Zhao J., Young K. H., Herrnstein R. M., Ho P. T. P., Tsutsumi T., Lo K. Y., Goss W. M., Bower G. C., 2003, ApJ, 586, L29