Dust in Comet C/2007 N3 (Lulin)
Abstract
We report optical imaging, optical and near-infrared polarimetry, and Spitzer mid-infrared spectroscopy of comet C/2007 N3 (Lulin). Polarimetric observations were obtained in (0.676 µm) at phase angles from to with simultaneous observations in (1.65 µm) at , exploring the negative branch in polarization. Comet C/2007 N3 (Lulin) shows a typical negative polarization in the optical as well as a similar negative branch at near-infrared wavelengths. The 10 µm silicate feature is only weakly in emission and according to our thermal models, is consistent with emission from a mixture of silicate and carbon material. We argue that large, low-porosity (akin to Ballistic Particle Cluster Aggregates), rather absorbing aggregate dust particles best explain both the polarimetric and the mid-infrared spectral energy distribution.
1 INTRODUCTION
Comet dust provides us with insight into two fundamental aspects of our solar system: (a) the composition of both the solar system’s initial ingredients and formation products; and, (b) the spatial and temporal heterogeneity of the proto-planetary disk. Comet dust comae are optically thin, providing a unique laboratory for the study of preserved dust grains that observations of Kuiper Belt objects and primitive asteroids cannot provide. The compositions of both comet dynamical families, ecliptic comets (ECs) and nearly-isotropic comets (NICs), have been preserved in their interiors during their residences in the Scattered Disk and Oort Cloud.
Knowledge of cometary materials enables better understanding of planetary and small body formation as well as evolutionary processes in the protoplanetary disk. The NASA space mission Stardust was designed to bring back samples of comet dust from 81P/Wild 2. The terrestrial laboratory analysis of grain samples captured in the aerogel have helped us to understand the properties of comet refractory materials, revealing, among others, high-temperature crystalline materials (Flynn, 2008). In the preliminary analysis of Stardust samples, % of the aerogel tracks were ‘carrot-shaped,’ indicative of large solid grains that upon inspection included micron- to tens of micron-sized forsterite (Mg-rich crystalline silicate) and FeS crystals (Burchell et al., 2008; Zolensky et al., 2008). A fraction, %, of the Stardust aerogel tracks were bulbous and attributed to porous aggregates which suffered significant heating upon impact with the aerogel (Roskosz, Leroux, & Watson, 2008; Leroux et al., 2008). However, analysis of microcrater impacts in the foil suggest that % are clustered with irregular, non-circular outlines likely originating from composite, i.e., aggregate grains (Borg et al., 2007). In contrast to the Stardust samples that were dominated by weakly bound aggregates, which likely originated in the inner protoplanetary disk, the interplanetary dust particles (IDPs) captured in Earth’s stratosphere from comet 26P/Grigg-Skjellerup were all highly porous (e.g., Nakamura-Messenger et al., 2008) and were not dominated by large single mineral grains.
Grain thermal modeling of mid-infrared (MIR) remote sensing spectral energy distribution (SEDs) of comets constrains various coma grain properties including their: temperatures, size distributions (), mass, dust production rate, and porosity (e.g., Harker et al., 2002; Wooden et al., 1999). These grain properties must then be reconciled with those derived from analysis of the optical and near-infrared (NIR) polarimetry to produce a self-consistent description of the dust.
The status of remote sensing of cometary dust was reviewed by Kolokolova et al. (2004), who concluded that aggregate models are likely best at explaining photometric, polarimetric, and thermal properties of cometary dust. This model (Kolokolova et al., 2007) not only explained the phase dependence of brightness and polarization for comets, but also explained the existence of two classes of comets based on polarimetry by Dobrovolsky et al. (1986) and Levasseur-Regourd et al. (1996). Lisse et al. (2002) and Sitko et al. (2004) argue that there are two classes of comets based on the strength of the silicate feature in emission and the 10 µm SED temperature excess over an equivalent blackbody at the observed heliocentric distance () of the comet. Taxomomically, comets with strong silicate feature emission comprise the same population of comets that show high polarization (coma dust population dominated by small or very porous particles), while those with weak silicate feature emission are the same population that exhibit low polarization (coma dust population dominated by large compact particles). This correlation is consistent with aggregate dust models (Kolokolova et al., 2007). Comparison of thermal model dust parameters used to interpret ground-based remote sensing observations of the SED arising from coma grains with the dust from the Stardust sample return mission has helped to improve the aggregate model, making it not only qualitatively but also quantitatively compatible with the experimental data (Kolokolova & Kimura, 2010).
The presence of the so-called negative branch in the phase dependence of the polarization is an important observational characteristic of comet polarization (Mishcnenko et al., 2010; Kolokolova et al., 2004). Unlike Rayleigh particles, which polarize light perpendicular (positive Stokes Q) to the plane of scattering at all phase angles, for comets and asteroids the polarization position angle flips by (negative Stokes Q) at low phase angles, ° (e.g., Kelley et al., 2004). Although negative polarization can be reproduced by modeling comet dust as an ensemble of polydisperse spherical particles (e.g., Mukai et al., 1987), Kolokolova et al. (2004) demonstrate that all other polarimetric, photometric, and thermal IR characteristics of comet dust require that comet partciles be aggregates of submicron monomers. This aggregate “structure” was confirmed by the in situ coma particle sampling of the Stardust mission (e.g., Flynn, 2008) that showed that the majority (%) of the returned sample particles had an aggregate nature. Reproduction of the negative branch can be achieved in the aggregate model cases utilizing large (thousands of monomers), aggregates (Kolokolova et al., 2007) or alternatively in cases where the aggregates are transparent silicates (Zubko et al., 2009; Kimura, 2001). However, the presence of aggregates made of transparent silicates is hard to reconcile with the low geometric albedo of comet nuclei caused by a significant carbon content (Campins et al., 2006). Other ballistic aggregate models (e.g., Lasue et al., 2009; Shen et al., 2009, 2008) developed to assess the effect of effective aggregate size, porosity, and composition in the polarimetric behavior of dust in astrophysical environments need to be carefully scrutinized for their applicability in describing dust in comet coma. This assessment, which we discuss in detail in §3.4, is critical for interpreting the negative polarization branch observed at small phase angles.
There are very few observations of comet polarization in the NIR at phase angles below , and existing observations present a puzzle. The unusual comet C/1995 O1 (Hale-Bopp), for example, showed no negative branch at NIR wavelengths (Jones & Gehrz, 2000), unlike the behavior of all comets at optical wavelengths. Knowledge of the wavelength dependence of the polarization at long wavelengths (µm) through the negative branch as well as NIR observations at a wide range of phase angles should shed more light on the nature of the aggregates that make up the majority of comet dust. These aggregates also need to reproduce the observed emission in the thermal infrared, especially in the 10 µm spectral region where various minerals produce broad resonances and narrow features.
The wavelength dependence of the polarization has only recently been extended out beyond . By observing out to , Jones & Gehrz (2000) and Kelley et al. (2004) were able to show that in general, the polarization increases from the optical out to the NIR for most comets (red polarization color). This effect is in contrast to that observed in asteroids, where the polarization decreases with wavelength (blue polarization color; Masiero & Cellino, 2009, and references therein). Most NIR polarimetry observations of comets are made independent of the visual observations, requiring extrapolation between different phase angles in order to directly compare fractional polarization at visual and NIR wavelengths. This lack of simultaneity complicates determination of the polarization color.
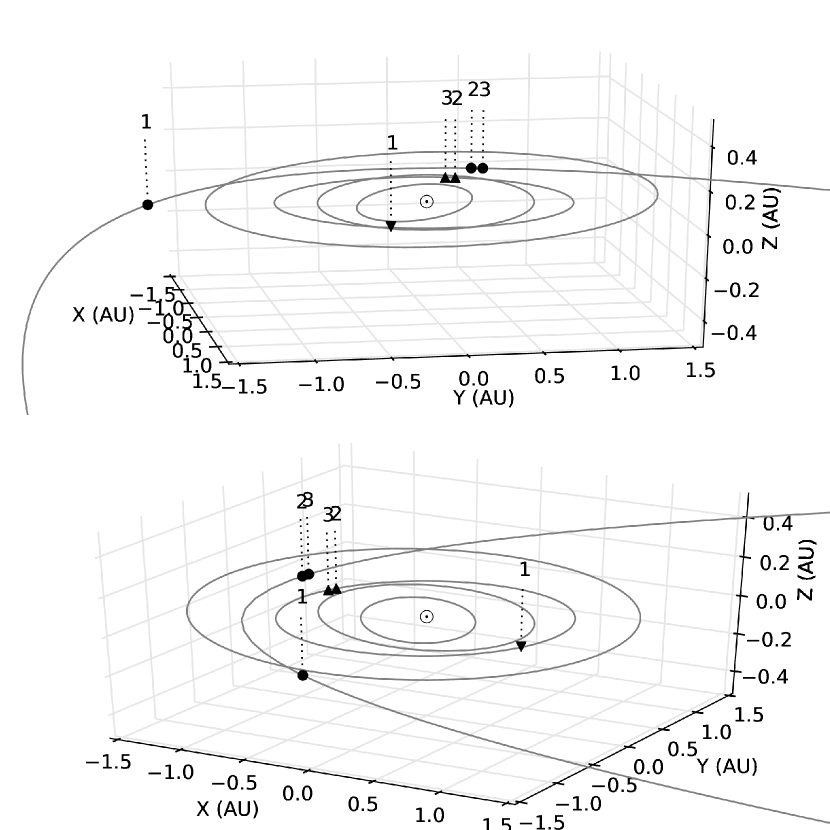
Comet C/2007 N3 (Lulin) provided an excellent opportunity to make simultaneous visual and NIR polarimetric observations of a comet at phase angles below . Comet C/2007 N3 (Lulin) is a NIC (Oort cloud) comet that passed less than from zero phase angle at opposition (see Fig. 1). We obtained polarimetric observations in the optical red at phase angles from to with simultaneous observations in the NIR at . When combined with Spitzer MIR spectroscopy, we can compare dust models that match the observed scattering and the observed emission properties of the dust in the coma.
2 OBSERVATIONS
2.1 Optical Imaging
Comet C/2007 N3 (Lulin) was observed on 2009 March 03 UT with the 2.3-m Bok Telescope at Kitt Peak National Observatory at heliocentric distance, AU and a geocentric distance, AU. The comet was at a phase angle .
The images were obtained with the 90prime Camera (Williams et al., 2004), a prime focus imager built for the Bok Telescope. At the time of observation, the 90prime camera utilized a thinned back-illuminated CCD detector with 4064 4064 pixels with a pixel size of . At prime focus the camera pixel scale is which yields a field of view of 30.530.5 square-arcmin. The instrument was equipped with Cousins/Bessel system broadband and filters.
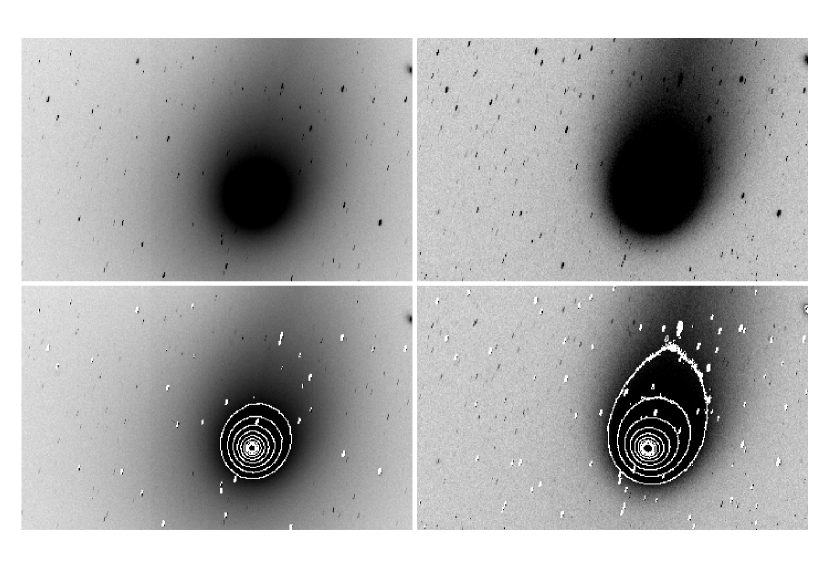
Multiple exposures (3 images of 120 seconds in band and 4 images in band; 1 of 60 seconds and 3 of 120 seconds) were obtained of the nucleus and coma of the comet with the telescope tracking at the non-sidereal rate corresponding to the predicted motion of the comet provided by JPL Horizons111http://ssd.jpl.nasa.gov/horizons.cgi in an airmass range of 1.08 to 1.11. All images were corrected for overscan, bias and flat-fielding with standard IRAF222IRAF is distributed by the National Optical Astronomy Observatory, which is operated by the Association of Universities for Research in Astronomy (AURA) under cooperative agreement with the National Science Foundation. routines. Due to the thinned nature of the 90prime detector, band data must be defringed. A master fringe file was created using the median of 41 data frames from this night of observation and subtracted from the band data. The data was photometrically calibrated using Landolt standard fields PG0918, SA102, SA104, PG1323 (Landolt, 1992) and the average nightly seeing was . One 120 second exposure in each band is shown in Fig. 2.
2.2 Polarimetry
The NIR observations were made in the band using NSFCAM2 (Shure et al., 1994) on the IRTF 3-m telescope at a plate scale of per pixel, resulting in a field of view of square. In polarimetry mode, NSFCAM2 utilizes a rotating half-wave plate at the entrance window of the camera and a cold wire grid polarizer in the second filter wheel. Details of the NSFCAM2 (+Polarimeter) observing technique and data reduction procedure are given in Jones & Gehrz (2000) and Kelley et al. (2004). The visual polarimetric observations were made using OptiPol (Jones et al., 2008) at the University of Minnesota Mt. Lemmon Observing Facility (MLOF) in a narrow band filter centered at µm, with a bandwidth . This filter was chosen to avoid contamination from unpolarized gas emission as much as possible.
The results of our polarimetry, including the observing log, observation time, and phase angle are given in Table 1. Simultaneous polarimetry at and was obtained on 2009 January 27 UT.
2.3 Spitzer IRS
Comet C/2007 N3 (Lulin) was observed by Spitzer on 2008 October 04.3 UT ( AU, a Spitzer-comet distance of 1.673 AU, and a phase angle of 32.5°) with the Infrared Spectrograph (IRS; Houck et al., 2004) as part of a larger Cycle 5 study assessing the water production and volatile production rates of comets (program identification number [PID] 50335; PI: D. E. Harker). The astronomical observation request (AOR) key for the dataset is 2587584 (catalog ADS/Sa.Spitzer#2587584), and the basic calibrated data (BCD) products processed with IRS reduction pipeline S18.60. The AOR for the short-wavelength, low-resolution SL1 ( µm) data discussed here executed a spectral map (performed with no peak-up) yielding 21 spectra (6 sec 2 cycles) with steps (perpendicular parallel to the long slit dimension). Background (shadow) observations were taken 34 hours later at the same celestial coordinates as the target spectra (AOR key 25988864), allowing the comet to move out of the spectral map field-of-view (FOV). Further analysis of the SL1 and LH spectra are discussed in Woodward et al. (2011).
The spectra were reduced as follows. The shadow observations were subtracted from the on-source observations, and the result was assembled into a data cube using the CUBISM software (Smith et al., 2007), with bad pixels masked and all extended source calibrations applied. The spectrum presented in this paper is extracted from an aperture 925 925 in size, centered on the peak surface brightness of the comet.
3 DISCUSSION
3.1 Optical Imaging
The radial profile of comet C/2007 N3 (Lulin) was plotted to assess the quality of the data for calculating a dust production rate. The radial profile of C/2007 N3 (Lulin) in the V band shows a deviation from the conical profile (Gehrz & Ney, 1992), suggesting contamination from gas such as at 5141 Å. We therefore only calculate the dust production in band. The band radial profile of C/2007 N3 (Lulin) is shown in Fig. 3.
To estimate the rate of dust production in comet C/2007 N3 (Lulin), we utilize the quantity introduced by A’Hearn (1984). This quantity serves as a proxy for dust production and when the cometary coma is in steady state, the value for is an aperture independent parameter,
| (1) |
where is the Bond Albedo, is the filling factor of the coma, is the apparent solar magnitude, is the measured cometary magnitude, is the linear radius of the aperture at the comet’s position (cm) and and are the heliocentric and geocentric distances measured in AU and cm, respectively. Cometary magnitudes are observed to follow similar phase angle effects as asteroids; therefore we also apply the phase angle correction of where is the phase angle in degrees and C is correction factor of 0.03 magnitudes per degree, the mean of the correction factors derived by Meech et al. (1987). Figure 4 illustrates the progression of as a function of and Table 2 reports values of at a selection of distances from the comet photocenter.
3.2 NIR and Polarimetry
Comet C/2007 N3 (Lulin) was sufficiently distant at the epoch of our observations that we did not have the spatial resolution to map changes in polarization across the coma. Thus it is unknown whether or not there was any significant variation in polarization with coma morphology. Comet C/1995 O1 (Hale-Bopp), for example, had a high surface brightness jet that showed distinctly greater fractional polarization in the NIR than the rest of the coma (Jones & Gehrz, 2000). The only other comet with good spatial resolution and polarimetry at NIR wavelengths is comet 73P/Schwassmann-Wachmann 3 (SW-3), an ecliptic-family comet (Jones et al., 2008). SW-3 passed sufficiently close to the Earth to allow us to measure the surface brightness and polarization of the coma with a resolution of km (Jones et al., 2008). While Jones et al. (2008) and Harker et al. (2011) found strong evidence for significant breakup of the dust aggregates released from the nucleus of SW-3 taking place over distances of 40-400 km from the nucleus, only small changes in the fractional polarization across the inner coma were observed. All of the polarization observations of SW-3 were at phase angles and showed weak red polarimetric color. Despite the strong evidence for significant breakup of dust aggregates, the polarization of SW-3 is not distinguishable from other comets.
The surface brightness profile of C/2007 N3 (Lulin) at is shown in Figure 5 along with the profile of a star for comparison. Given the seeing of full-width half-maximum (FWHM), the surface brightness of C/2007 N3 (Lulin) is entirely consistent with a simple dependence as expected for a constant velocity outflow (Gehrz & Ney, 1992). The polarimetry was not of sufficient signal-noise to determine if there were any variations in fractional polarization at large distances ( km or ) from the center.
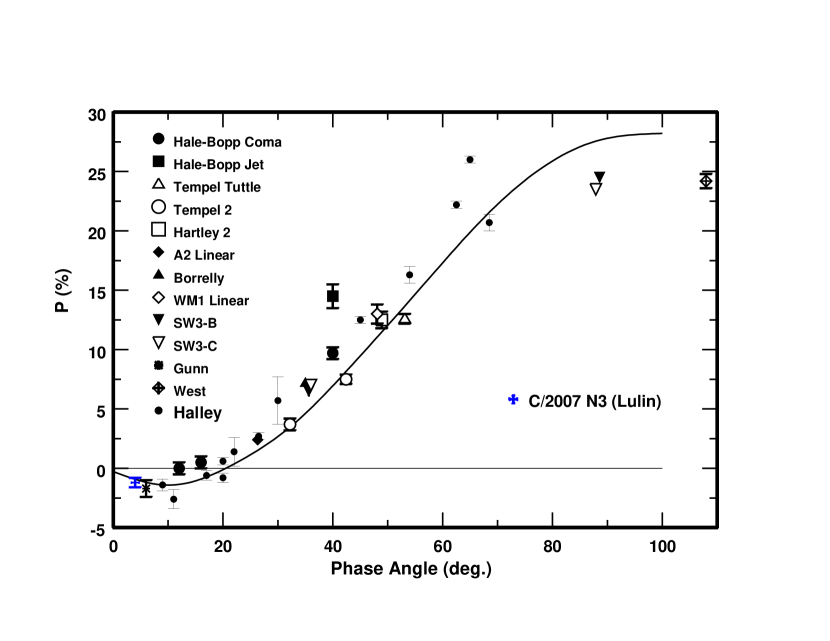
There is very little NIR polarimetry of comets at phase angles , primarily C/1995 O1 (Hale-Bopp) (Jones & Gehrz, 2000), 1P/Halley (Brooke et al., 1987), and a single observation of 65P/Gunn (Kelley et al., 2005). A compilation of NIR polarimetry of comets is shown in Fig. 6. The solid line in this figure is the mean phase dependence of the polarization in the band found by Levasseur-Regourd et al. (1996). The majority, but not all, of the NIR polarimetry lies above this line, at least out to phase angles of , consistent with the generally red polarimetric color of comets. The precise (low formal error) observations of comet C/1995 O1 (Hale-Bopp), which contained unusually small dust particles (Williams et al., 1997; Mason et al., 2001; Harker et al., 2002; Wooden et al., 1999), shows no negative branch. The lack of a negative branch in the NIR for C/1995 O1 (Hale-Bopp) can, to first order, be explained by the added polarization of light scattered from more ’Rayleigh-like’ particles coming from the jet. The addition of these smaller particles increases the fractional polarization above what would otherwise be a typical polarization vs. phase curve for the rest of the coma.
Our band polarimetry of comet C/2007 N3 (Lulin) is the first observation of the polarization of a comet in the NIR at a phase angle within a few degrees of zero. The polarimetry for comet C/2007 N3 (Lulin) given in Table 1 is plotted vs. phase angle in Fig. 7. The solid line is the typical dependence of polarization on phase angle in the band mentioned earlier. Our band observations of comet C/2007 N3 (Lulin) are entirely consistent with the typical optical behavior of polarization comets. The NIR polarization of comet C/2007 N3 (Lulin) is also entirely consistent with the contemporaneous visual polarization measurements, and the NIR negative polarization is clearly comparable with a typical optical negative branch polarization behavior observed in most comets at small (°) phase angles.
3.3 The 10 µm Silicate Feature
Within the spectral range covered by the Spitzer SL1 module, the observed SED of comets often are comprised of amorphous carbon grains, which produce the underlying featureless emission (continuum) in the µm wavelength region, and small ( 1 µm) siliceous dust grains which produce broad features and distinct resonances in excess of the continuum (for a reviews see Hanner & Zolensky, 2010; Kelley & Wooden, 2009). Amorphous silicates with chemical composition (stiochiometry) similar to olivine (Mgy,Fe(1-y))2SiO4 and pyroxene (Mgx,Fe(1-x))SiO3 with (Mg/(Mg+Fe) ) reproduce the broad width of the 10 µm feature. The distinct 9.3 and 10.5 µm emission features are attributed to Mg-rich orthopyroxene (Wooden et al., 1999; Harker et al., 2002), while Mg-rich crystalline olivine is uniquely identified through its distinct, relatively narrow 11.2 µm silicate feature (Hanner et al., 1994). Mg-rich crystalline species are defined as grains with (Wooden, 2008; Koike et al., 2003; Chihara et al., 2002). Frequently in comets, the Mg content of crystalline silicates is often significantly larger than that of the amorphous silicate grains.
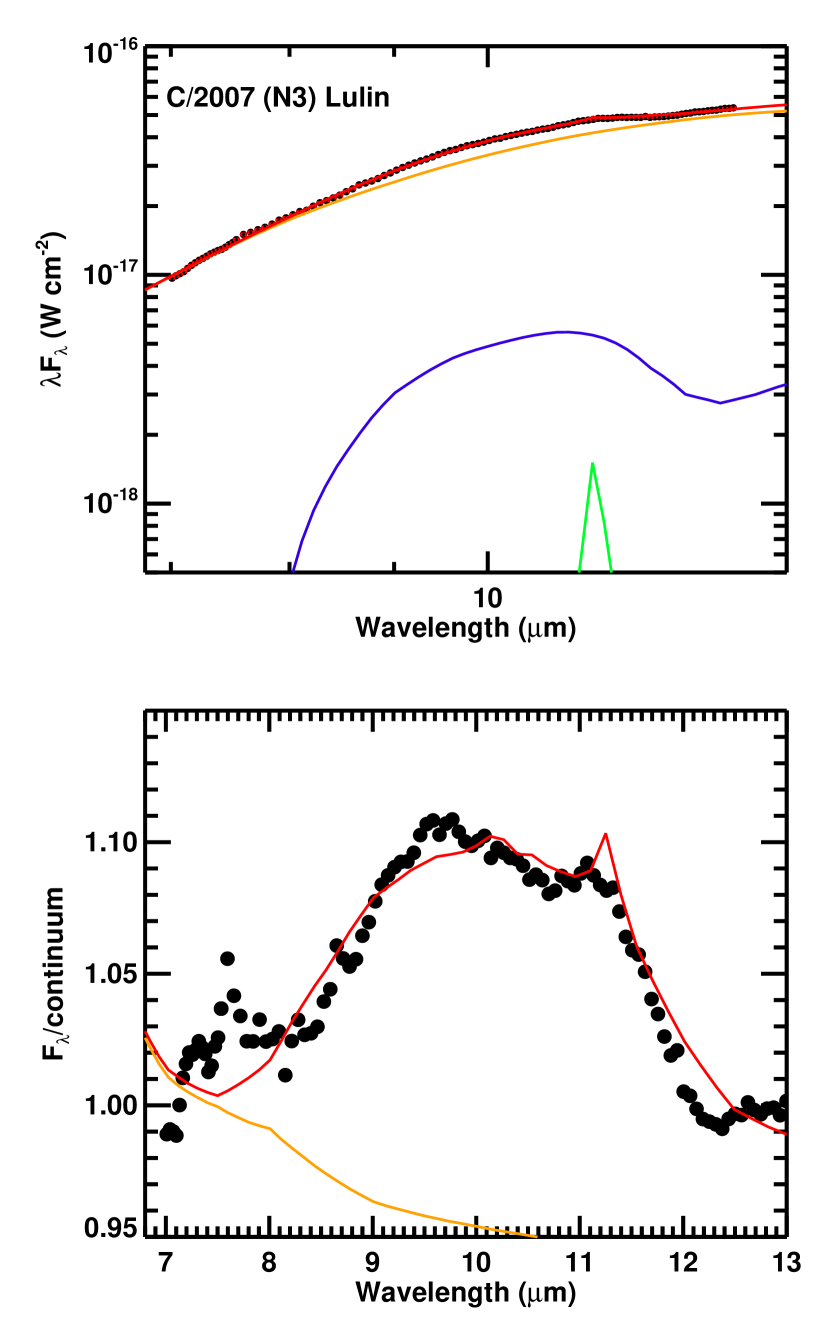
Weak silicate emission is evident in the IRS spectra of comet C/2007 N3 (Lulin) (Fig. 8). At µm the silicate emission is % above a blackbody curve fit to continuum points around and . The best fit blackbody has a temperature of K. The silicate feature strength at of C/2007 N3 (Lulin) is relatively weak compared to other comets, most ecliptic-family comets have % silicate feature strengths (Kelley & Wooden, 2009; Sitko et al., 2004).
The SED of comet C/2007 N3 (Lulin) was modeled using the Harker et al. (2002) thermal emission dust code which assumes that a collection of optically-thin, discrete (singular mineralogy) dust particles reside at the heliocentric () and geocentric () distance of the comet at the epoch of observations (2008 Oct 04.3 UT) and adopts a Hanner grain-size distribution (HSGD; Hanner et al., 1983) for . The mineralogy used in the model is derived from laboratory studies of interplanetary dust particles (Wooden et al., 2000), micrometeorites (Bradley et al., 1999), the NASA Stardust mission (Brownlee et al., 2006) as well as other grain species employed in other remote sensing thermal models (e.g., Hanner et al., 1994; Wooden et al., 2004). Additional details of the our thermal modeling specifically of comet C/2007 N3 (Lulin) is discussed in Woodward et al. (2011).
The best-fit thermal models (Fig. 8, and given in Table 3) suggest that the silicates in C/2007 N3 (Lulin) are dominated by pyroxene grains, and include minor amounts of crystalline olivine and orthopyroxene. Grains in the coma of C/2007 N3 (Lulin) are relatively large, the HGSD peaking at , and moderately porous (fractal porosity parameter ) with a large grain slope . The submicron sized silicate-to-carbon ratio inferred from our models is . The error bars on parameters derived from the thermal modeling reflect a 95% confidence limit. We also find that the silicate crystalline mass fraction for the submicron to micron-size portion of the grain size distribution (Harker et al., 2002; Moreno et al., 2003), defined as (crystalline)/(crystalline + amorphous), for comet C/2007 N3 (Lulin) is . In contrast, other NIC comets such as C/1995 O1 (Hale-Bopp) which had a very strong 10 µm silicate feature had coma dust grains that were fractally very porous () with the HGSD peaking at µm (Harker et al., 2002) and mineralogically diverse, including amorphous and crystalline forms of both olivine and pyroxene with (Harker et al., 2002). The dynamically new comet C/2001 Q4 (NEAT) which exhibited a modest silicate emission had dust grains that were ‘solid’ () with a HGSD peaking at and a with (Wooden et al., 2004).
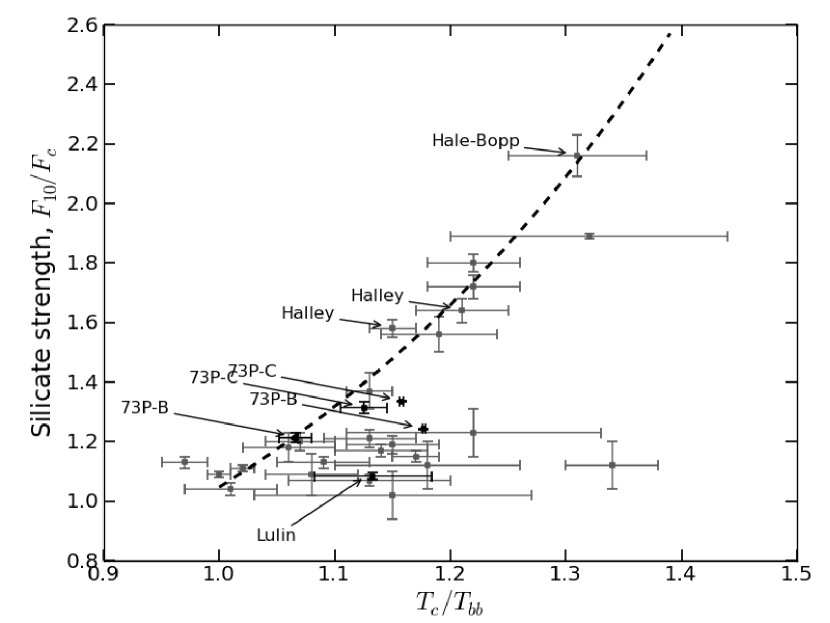
In Fig. 9 we plot the strength of the 10 µm silicate emission above the continuum, , where is integrated feature flux over a bandwidth from µm and is that of the local continuum at 10.5 µm, vs. the color temperature excess above black body equilibrium at the distance of C/2007 N3 (Lulin), and various other comets, from the Sun (e.g., Sitko et al., 2004). The color temperature excess is defined as:
| (2) |
where is the black body fit to the observed continuum and is in AU. For comet C/2007 N3 (Lulin) this temperature excess is , while . Comet C/1995 O1 (Hale-Bopp), which had a jet with much smaller grain aggregate or monomer size dust particles and no negative branch in polarization (Jones & Gehrz, 2000), shows an exceptionally strong silicate feature and a large color temperature excess, also indicative of small grain aggregates or small grain monomers separated from the aggregate (Williams et al., 1997). C/2007 N3 (Lulin), in contrast, has a very weak silicate feature with little color temperature excess. The large compact aggregates that are required by the polarimetry are consistent with the thermal IR measurements that show a very weak silicate feature.
The silicate feature strength and continuum temperature excess of fragments B and C of comet 73P/Schwassmann-Wachmann observed by Gemini (Harker et al., 2011) and Spitzer (Sitko et al., 2011) are also included in Fig. 9 for completeness. For fragment B, the silicate feature strengths and temperature excesses were and (Gemini), and and (Spitzer) respectively. For fragment C, the silicate feature strengths and temperature excesses were and (Gemini), and and (Spitzer) respectively.
3.4 Aggregate Models and Comet NIR Polarimetry
The negative polarization branch, where the maximum linear polarization is of order % is evident in all comets observed at visual wavelengths at small, °, phase angles (for a review see Mishcnenko et al., 2010; Kolokolova et al., 2004). As we mentioned above, computer simulations of this characteristic, based on aggregate models, requires either large aggregates (thousands of monomers) or monomers made of rather transparent material (silicates). These simulations are usually based on ballistic aggregation that not only allows fitting the observational data but are also consistent with the origin and evolution of cometary dust. For example, Kimura et al. (2006, 2003) considered two types of ballistic aggregates: BPCA (Ballistic Particle Cluster Aggregates) and BCCA (Ballistic Cluster Cluster Aggregate). These two types of aggregates differ in their porosity. For an equivalent number of constituent monomers of radius , the BPCA aggregates are more compact than BCCA, where the porosity is defined as and the characteristic radius , where is the gyration radius of the aggregate (Kozasa et al., 1992), , with the position of the center of the monomer. Kolokolova et al. (2007) and Kimura et al. (2006) describe the polarimetric and IR properties of comet dust using these two types of ballistic aggregates, consisting of sub-micron monomers (of radius µm) with a Halley-type composition which includes silicates, amorphous carbon, and organic refractory material. These models can account for the general behavior of the maximum polarization, the shape of the polarization curve as a function of phase angle , and the negative polarization branch. In addition, such models also yield the low geometric albedos (of order % that is typical for comet dust) and red photometric colors (normalized reflectivity gradient; Jewitt & Meech, 1986) that are typical for comet dust, for example C/2004 Q2 (Machholz) (Lin et al., 2007) and others discussed in Kolokolova et al. (2004) or Hadamcik & Levasseur-Regourd (2009). Indeed, Fig. 2 of Joshi, Ganesh, & Baliyan (2011) indicates that the colors of comet C/2007 N3 (Lulin) are not blue. For proper characterization of the observed low geometric albedos and red photometric of comets, the values of the refractive index used to describe the aggregate ensembles are crucial. Kimura et al. (2006) demonstrate that if the imaginary part, , of the index of refraction becomes smaller than 0.4 the color of comet dust becomes blue.
The same ballistic aggregates, BPCA and BCCA, were considered by Lasue et al. (2009) to model comet polarization. Mixing them with spheroidal silicate particles they achieved a good fit to the polarization phase curve. However, Lasue et al. (2009) do not provide any photometric characteristics of the dust, specifically the albedo and photometric color. This omission does not permit a critical examination of their model to assess its validity in the study of comet C/2007 N3 (Lulin). The comprehensive study of Kimura et al. (2006) indicates that one might expect, due to the rather low absorption properties of the Lasue et al. (2009) materials (they considered the refractive index of organics equal to and of silicates ), that the Lasue et al. (2009) dust would demonstrate rather high albedo and blue color. The erroneously high albedo and blue dust color is also apparent in the results of Shen et al. (2009) which uses aggregates to model comet dust; a aggregate model first developed by Shen et al. (2008). In the latter work, they consider random ballistic aggregates (BAs) constructing BAM1 and BAM2 particles describing differing monomer migration after randomized first contact aggregation. BAs have porosities similar to BPCAs, yet are less porous than BCCAs. However, the complex refractive indices of the silicates used in (Shen et al., 2009, 2008) models are low, and in the visible and IR respectively which lead to rather high albedo and erroneous photometric colors. For instance, the Shen et al. (2009) model produces an albedo of order % and blue dust color. Currently, the model most consistent with the observational and in situ data is that of Kolokolova & Kimura (2010) where, following the findings of Stardust mission, a mixture of aggregated and solid particles was considered. The results of Kolokolova & Kimura (2010) modeling are characterized not only by the correct polarization and photometric properties of the dust, including albedo and colors, but also by the model organics-to-silicate ratio and ratio of aggregates to solid particles that are consistent with the results of in situ studies of comets.
An important constraint in interpreting polarimetric aggregate models applicable to our study of C/2007 N3 (Lulin) near perihelion is our 10 µm spectra333The synthetic apertures used to determine the polarization (see Table 1) are comparable to the Spitzer extraction apertures. which show the comet near the epoch of the optical/NIR polarimetric observations had a weak silicate feature (§ 3.3). Thermal modeling of the 10 µm SED suggests that the peak of coma grain size distribution is of order 1 µm with a large grain slope indicative of a population tail of grains are extant whose sizes are 1.0 µm. These latter grains are large as well as moderately porous, (Harker et al., 2002) where = 0.1 µm and . Large aggregates are also necessary to explain the negative polarization in the NIR and the red color of light scattered by comet C/2007 N3 (Lulin)’s dust. Extensive optical photometry of the comet near opposition (Joshi, Ganesh, & Baliyan, 2011) also indicate a dominance of grains in the coma larger than 0.1 µm. Thus, the results derived from the scattered light and the thermal emission spectra are consistent, and the porosity of grains from our thermal models (% for µm) suggests that the coma of comet C/2007 N3 (Lulin) is composed of grains with properties more like BPCA grains rather than BCCA grains.
Negative polarization was not observed in the NIR in comet C/1995 O1 (Hale-Bopp) whose dust was characterized by small particles. Disappearance of the negative polarization in this instance signals that at wavelengths µm, the size parameter of the dust particles became smaller than the wavelength (Rayleigh particles) for which polarization is always positive. This is not the case observed in comet C/2007 (N3) Lulin. The genesis of negative polarization is complex (for a detailed discussion see Petrova, Tishkovets, & Jockers, 2007). It results from a combination of properties of individual monomers, multiple scattering, coherent backscattering and near-field effects. At some monomer sizes these latter effects, combined with porosity and refractive indices, tend to produce effects that work in the same direction increasing the negative polarization, but at other monomer sizes they produce opposite effects. This is why one can get equal negative polarization for different types of aggregates or a big change in negative polarization for a small change of, for example, the size parameter of the monomer (Kolokolova & Kimura, 2010). Computation of negative polarization is still a modeling challenge deserving future attention.
In our analysis of comet C/2007 N3 (Lulin), we claim that the negative polarization does not contradict conclusions regarding the particle properties inferred the red polarization color (from the -band through the -band) and those derived from the thermal IR observations that indicate the grains are large (i.e., micron-sized or larger) and of low porosity (perhaps as compact as an aggregate of submicron particles can be). Another explanation for the negative polarization observed in the coma of comet C/2007 N3 (Lulin) is that the dust was composed of transparent silicate particles with little or no carbon content. However, cometary dust is usually characterized by a low albedo that presumes a large content of carbon, and photometrically C/2007 N3 (Lulin) does not show any peculiarity that would allow us to suppose that its albedo is significantly different. Also, in the case of abundant silicate particles, we would expect a noticeable spectral dependence of polarization (Zubko et al., 2009). In addition, our thermal model has a silicate to carbon ratio of 0.48, inconsistent with dust dominated by transparent silicates.
4 CONCLUSIONS
We have found that C/2007 N3 (Lulin) clearly has a typical optical negative branch in the polarization as well as exhibiting a negative branch in the near-infrared at low phase angles. When compact aggregates are larger than the longest wavelength considered it is known that the depth of the negative branch does not depend significantly on the wavelength; furthermore, the wavelength dependence becomes less pronounced as the phase angle decreases (Belskaya et al., 2009). We have also found that these large, low-porosity aggregates in comet C/2007 N3 (Lulin) are consistent with the thermal infrared measurements that showed a very weak silicate feature.
Our thermal model contains moderately porous grains (), with a peak grain size of . This is qualitatively consistent with the large aggregate grains needed to explain the polarimetry if the monomers are µm in size. We conclude that the dust in comet C/2007 N3 (Lulin) is dominated by large and compact aggregate particles, made up of thousands of small monomers. Compact aggregates are typical for old periodic comets (Kolokolova et al., 2007) but not for new ones, which tend to have more porous aggregates. However, Sitko et al. (2004) show that the dust properties of some nearly-isotropic (including Oort cloud comets) and ecliptic comets are similar based on intercomparison of the strength of the 10 µm silicate feature versus the color temperature of the dust. Our polarimetry of comet C/2007 N3 (Lulin), an Oort cloud comet with thermal emission properties equivalent to ecliptic-family comets, demonstrate that grain structure may account for this observation (see Fig. 4 of Sitko et al., 2004).
The occurrence of a negative branch in the polarization in the near-infrared is likely typical for most comets. Comet C/1995 O1 (Hale-Bopp), which showed no negative branch in the near-infrared, must be considered an anomalous case due to the production of significant numbers of very small, submicron grains. These latter small coma grains could be individual monomers that have broken off from the larger, porous aggregates. For C/2007 N3 (Lulin), the more compact aggregates must maintain most of their integrity after release from the nucleus. Although aggregate models for the polarization and the large porous grain model for the thermal emission of comet C/2007 N3 (Lulin) share qualitative features, a rigorous quantitative grain/grain-aggregate model that is self consistent for both scattering and emission (e.g., Kolokolova & Kimura, 2010) has yet to be applied to observations of individual comets. Such an effort will be an important future work.
5 Acknowledgments
CEW, ELR, BB, and DEH acknowledge support for this work from the National Science Foundation grant AST-0706980. MSK acknowledges support from NASA Planetary Astronomy Grant NNX09AF10G. CEW, DEH, and MSK were also supported in part by NASA/JPL Spitzer grant JPL-01355616. TJJ and MK acknowledge partial support from the National Science Foundation grant AST-0937570. The authors also wish to thank the referee, Dr. D. H. Wooden, for her insightful review that improved the final manuscript.
References
- A’Hearn (1984) A’Hearn, M. F., Schleicher, D. G., Feldman, P. D., Millis, R. L., & Thompson, D. T. 1984, AJ, 89, 579
- Belskaya et al. (2009) Belskaya, I. N., Levasseur-Regourd, A.-C., Cellino, A., Efimov, Y. S., Shakhovskoy, N. M., Hadamcik, E., & Bendjoya, P. 2009, Icarus, 199, 97
- Borg et al. (2007) Borg, J., et al. 2007, LPI, 38, 1592
- Bradley et al. (1999) Bradley, J. P., Snow, T. P., Brownlee, D. E., & Hanner, M. S. 1999, in Solid Interstellar Matter: The ISO Revolution, Les Houches Workshop, February 2-6, 1998, eds. L. d’Hendecourt, C. Joblin, and A. Jones (EDP Sciences, Springer-Verlag: Berlin), p.298
- Bregman et al. (1987) Bregman, J. D., Witteborn, F. C., Allamandola, L. J., Campins, H., Wooden, D. H., Rank, D. M., Cohen, M., & Tielens, A. G. G. M. 1987, A&A, 187, 616
- Brooke et al. (1987) Brooke, T. Y., Knacke, R. F., & Joyce, R. R. 1987, A&A, 187, 621
- Brownlee et al. (2006) Brownlee, D., et al. 2006, Science, 314, 1711
- Burchell et al. (2008) Burchell, M. J., et al. 2008, Meteroritics & Planetary Sci., 43, 23
- Campins et al. (2006) Campins, H., Ziffer, J., Licandro, J., Pinilla-Alonso, N., Fernández, Y., León, J. D., Mothé-Diniz, T., & Binzel, R. P. 2006, AJ, 132, 1346
- Chihara et al. (2002) Chihara, H., Koike, C., Tsuchiyama A., Tachibana, S., & Sakamoto, D. 2002, A&A, 391, 267
- Dobrovolsky et al. (1986) Dobrovolsky, O. V., Kiselev, N. N., & Chernova, G. P. 1986, Earth Moon and Planets, 34, 189
- Flynn (2008) Flynn, G. J. 2008, Earth, Moon and Planets, 102, 447
- Gehrz & Ney (1992) Gehrz, R. D., & Ney, E. P. 1992, Icarus, 100, 162
- Hadamcik & Levasseur-Regourd (2009) Hadamcik, E., & Levasseur-Regourd, A.-C. 2009, Planetary & Space Sci., 57, 1118
- Hanner & Zolensky (2010) Hanner, M. S. & Zolensky, M. E. 2010, in Astromineralogy, 2nd Edition, ed. Th. Henning, (Springer-Verlag: Berlin), in press
- Hanner et al. (1994) Hanner, M. S., Lynch, D. K., & Russell, R. W. 1994, ApJ, 425, 274
- Hanner et al. (1983) Hanner, M. S. 1983, in Cometary Exploration, Vol. 2 (Budapet: Hungaria Acad. Sci.), 1
- Harker et al. (2011) Harker, D E., et al. 2011, AJ, 141, 26
- Harker et al. (2002) Harker, D. E., Wooden, D. H., Woodward, C. E., & Lisse, C. M. 2002, ApJ, 580, 579
- Jewitt & Meech (1986) Jewitt, D., & Meech, K. J. 1986, ApJ, 310, 937
- Jones & Gehrz (2000) Jones, T. J., & Gehrz, R. D. 2000, Icarus, 143, 338
- Jones et al. (2008) Jones, T. J., Stark, D., Woodward, C. E., Kelley, M. S., Kolokolova, L., Clemens, D., & Pinnick, A. 2008, AJ, 135, 1318
- Joshi, Ganesh, & Baliyan (2011) Joshi, U. C., Ganesh, S., & Baliyan, K. S. 2011, MNRAS, Letters, no. doi: 10.1111/j.1745-3933.2010.01005.x
- Houck et al. (2004) Houck, J. R., et al. 2004, Proc. SPIE, 5487, 62
- Kelley & Wooden (2009) Kelley, M. S., & Wooden, D. H. 2009, Planetary & Space Sci., 57, 1133
- Kelley et al. (2006) Kelley, M. S., et al. 2006, ApJ, 651, 1256
- Kelley et al. (2005) Kelley, M. S., Woodward, C. E., & Jones, T. J. 2005, Astronomical Polarimetry: Current Status and Future Directions, 343, 192
- Kelley et al. (2004) Kelley, M. S., Woodward, C. E., Jones, T. J., Reach, W. T., & Johnson, J. 2004, AJ, 127, 2398
- Kimura et al. (2006) Kimura, H., Kolokolova, L., & Mann, I. 2006, A&A, 449, 1243
- Kimura et al. (2003) Kimura, H., Kolokolova, L., & Mann, I. 2006, A&A, 407, L5
- Kimura (2001) Kimura, H. 2001, J. Quant. Spec. Radiat. Transf., 70, 581
- Koike et al. (2003) Koike C., Chihara, H., Tsuchiyzma, A., Suto, H., Sogawa, H., & Okuda, H. 2003, A&A, 399, 1101
- Kolokolova & Kimura (2010) Kolokolova, L., & Kimura, H. 2010, Earth, Planets, & Space, 62, 17
- Kolokolova et al. (2004) Kolokolova, L., Hanner, M. S., Levasseur-Regourd, A.-C., & Gustafson, B. Å. S. 2004, Comets II, 577
- Kolokolova et al. (2007) Kolokolova, L., Kimura, H., Kiselev, N., & Rosenbush, V. 2007, A&A, 463, 1189
- Kozasa et al. (1992) Kozasa, T., Blum, J., & Mukai, T. 1992, A&A, 263, 423
- Landolt (1992) Landolt, A. U. 1992, AJ, 104, 1, 340
- Lasue et al. (2009) Lasue, J., Levvasseur-Regourd, A.-C., Hadamcik, E., & Alcoufee, G. 2009, Icarus, 199, 129
- Levasseur-Regourd et al. (1996) Levasseur-Regourd, A.-C., Hadamcik, E. & Renard, J. B. 1996, A&A, 313, 327
- Leroux et al. (2008) Leroux, H., et al. 2008, Meteroritics & Planetary Sci., 43, 92
- Lin et al. (2007) Lin, Z. Y., Weiler, M., Rauer, H., & Ip, W. H. 2007, A&A, 469, 771
- Lisse et al. (2002) Lisse, C. M., A’Hearn, M. F., Fernández, Y. R., & Peschke, S. B. 2002, IAU Colloq. 181: Dust in the Solar System and Other Planetary Systems, 259
- Masiero & Cellino (2009) Masiero, J., & Cellino, A. 2009, Icarus, 199, 333
- Mason et al. (2001) Mason, C. G., Gehrz, R. D., Jones, T. J., Woodward, C. E., Hanner, M. S., & Williams, D. M. 2001, ApJ, 549, 635
- Meech et al. (1987) Meech, K., et al., 1987, A&A, 187, 585
- Mishcnenko et al. (2010) Mischenko, M. I., et al. 2010, Polarimetric Remote Sensing of Solar System Objects, (KYIV: Akademperiodyka) available at http://www.giss.nasa.gov/staff/mmishchenko/books.html
- Moreno et al. (2003) Moreno, F., Muñoz, O., Vilaplana, R., & Molina, A. 2003, ApJ, 595, 522
- Mukai et al. (1987) Mukai, T., Mukai, S., & Kikuchi, S. 1987 A&A, 262, 315
- Nakamura-Messenger et al. (2008) Nakamura-Messenger, K., et al. 2008, LPI, 39, 2103
- Petrova, Tishkovets, & Jockers (2007) Petrova, E. V., Tishkovets, V. P., & Jockers, K. 2007, Icarus 188, 233
- Roskosz, Leroux, & Watson (2008) Roskosz, M., Leroux, H., & Watson, H. C. 2008, Earth & Planetary Sci. Letts., 273, 195
- Shen et al. (2009) Shen, Y., Draine, B. T., & Johnson, E. T. 2008, ApJ, 696, 2126
- Shen et al. (2008) Shen, Y., Draine, B. T., & Johnson, E. T. 2008, ApJ, 689, 260
- Shure et al. (1994) Shure, M. A., et al. 1994, SPIE 2189.614S
- Sitko et al. (2011) Sitko, M. L., et al. 2011 in prep.
- Sitko et al. (2004) Sitko, M. L., Lynch, D. K., Russell, R. W., & Hanner, M. S. 2004, ApJ, 612, 576
- Smith et al. (2007) Smith, J. D., et al. 2007, PASP, 119, 1133
- Williams et al. (1997) Williams, D. M., et al. 1997, ApJ, 489, L91
- Williams et al. (2004) Williams, G. G., Olszewski, E., Lesser, M. P., & Burge, J. H. 2004, Proc. SPIE, 5492, 787
- Wooden et al. (2004) Wooden, D. H., Woodward, C. E., & Harker, D. E. 2004, ApJ, 612, L77
- Wooden et al. (2000) Wooden, D. H., Butner, H. M., Harker, D. E., & Woodward, C. E. 2000, Icarus 143, 126
- Wooden et al. (1999) Wooden, D. H., Harker, D. E., Woodward, C. E., Butner, H. M., Koike, C., Witteborn, F. C., & McMurtry, C. W. 1999, ApJ, 517, 1034
- Wooden (2008) Wooden, D. H. 2008, Space Sci. Rev., 138, 75
- Woodward et al. (2011) Woodward, C. E., et al. 2011, in prep.
- Zolensky et al. (2008) Zolensky, M., et al. 2008, Meteroritics & Planetary Sci., 43, 261
- Zubko et al. (2009) Zubko, E., Kimura, H., Shkuratov, Y., Muinonen, K., Yamamoto, T., Okamoto, H., & Videen, G. 2009, J. Quant. Spec. Radiat. Transf., 110, 1741
| Date (2009) | UT (Hr) | Phase (deg) | Filter | P (%) |
|---|---|---|---|---|
| 21 Feb. | 8:00 | 21.3 | ||
| 22 Feb. | 7:30 | 17.4 | ||
| 26 Feb. | 10:00 | 0.44 | ||
| 27 Feb. | 7:30 | 4.0 | ||
| 27 Feb. | 7:30 | 4.0 |
| Aperture[arcsec] | [km] | [mag] | Af [cm] |
|---|---|---|---|
| 28.35 | 10000 | 8.49 0.06 | 3188 111 |
| 42.3 | 15000 | 8.05 0.07 | 3213 138 |
| 70.2 | 25000 | 7.49 0.07 | 3228 138 |
| 281.25 | 100000 | 6.24 0.07 | 2545 109 |
| Sub-µm | ||
|---|---|---|
| Dust component | bbNumber of grains at the peak of the grain size distribution. | mass fraction |
| Amorphous pyroxene | ||
| Amorphous olivine | ||
| Amorphous carbon | ||
| Crystalline olivine | ||
| Crystalline pyroxene | ||
| Other model parameters | ||
| 47.2 | ||
| Degrees of freedom | 101 | |
| Total coma mass | kg | |
| Silicate / carbon | ||