Far-infrared emission from intergalactic medium in Stephan’s Quintet revealed by AKARI
Abstract
The Stephan’s Quintet (SQ, HCG92) was observed with the Far-Infrared Surveyor (FIS) aboard AKARI in four far-infrared (IR) bands at 65, 90, 140, and 160 m. The AKARI four-band images of the SQ show far-IR emission in the intergalactic medium (IGM) of the SQ. In particular, the 160 m band image shows single peak emission in addition to the structure extending in the North-South direction along the shock ridge as seen in the 140 m band, H2 emission and X-ray emission. Whereas most of the far-IR emission in the shocked region comes from the cold dust component, shock-powered [C II]158 m emission can significantly contribute to the emission in the 160 m band that shows a single peak at the shocked region. In the shocked region, the observed gas-to-dust mass ratio is in agreement with the Galactic one. The color temperature of the cold dust component (20 K) is lower than that in surrounding galaxies (30 K). We discuss a possible origin of the intergalactic dust emission.
1 Introduction
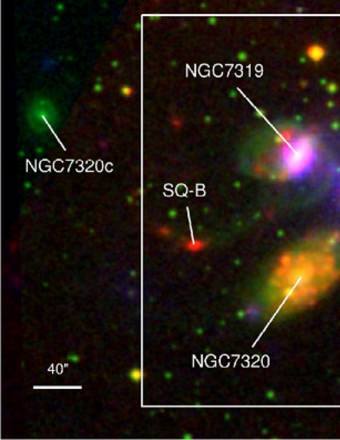
The track of the galactic scale transmigration of gas and dust is indispensable to understand the galaxy evolution. Stephan’s Quintet (SQ, HCG92) is the well studied compact group of galaxies (Hickson, 1982) with the disturbed intergalactic medium (IGM) as shown in Fig. 1. The intruder galaxy NGC 7318b is currently colliding with the IGM at a relative velocity of km s-1 and causes a large-scale shock front and IGM starbursts (SQ-A and SQ-B). The shock front was first discovered by Allen and Hartsuiker (1972) with radio, and subsequently detected in the X-ray emission from shock-heated ( K) gas (Pietsch et al., 1997; Trinchieri et al., 2003, 2005; O’Sullivan et al., 2009). Appleton et al. (2006) found powerful H2 rotational line emission from warm (- K) molecular gas in the center of the shock ridge. The significant discovery is the extremely large equivalent width () of the H2 line emission. This may indicate that far-infrared (IR) fine-structure lines such as [C II]158 m line also show extremely large by the shock and have a significant contribution to far-IR luminosity. However, the fact has yet to be revealed observationally. Cluver et al. (2010) made H2 maps of the SQ and found that the spatial distribution of the H2 emission was similar to those of radio and X-ray emission in the shocked region. To explain the co-existence of both hot and H2 gas, Guillard et al. (2009) proposed a model of the shock in the inhomogeneous gas medium. While H2 molecules are likely to be produced on the grain surface (Gould & Salpeter, 1963), direct association of the H2 gas with dust has yet to be found in the shock ridge. Recently, Natale et al. (2010) reported dust emission in the SQ with Spitzer observations. While the map at 160 m shows the significant presence of cold dust in the shock ridge, it is difficult to make direct comparison of the diffuse 160 m map with the H2 emission map because of the effect of bright emission from the surrounding galaxies.
The Far-Infrared Surveyor (FIS) (Kawada et al., 2007) aboard AKARI (Murakami et al., 2007) has four far-IR bands with the central wavelengths of 65, 90, 140, and 160 m, and achieves high sensitivity with relatively high spatial resolution. Finer allocation of AKARI/FIS 4 bands can provide the spectral information to constrain both the dust temperature and the [C II]158 m line emission and is the distinctive advantage compared to Spitzer/MIPS observations. In this paper we report the observation of the SQ with the FIS, and discuss the origin of the far-IR emission in the IGM.
2 Observations and Data reduction
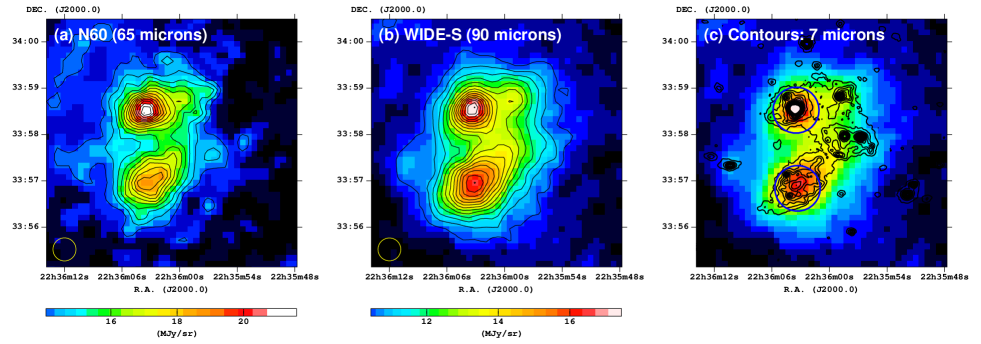
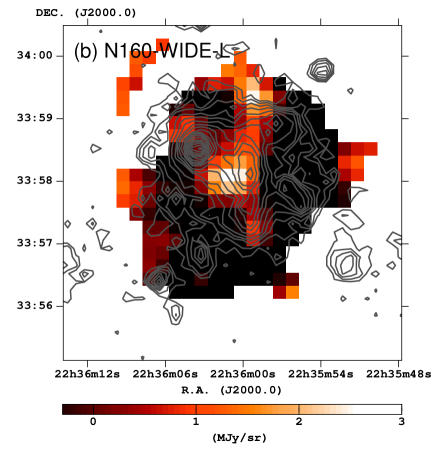
The SQ was observed in part of the AKARI mission program “ISM in our Galaxy and Nearby Galaxies” (ISMGN; Kaneda et al., 2009) on 2007 Jun 18 using the FIS01 observation mode (Observation ID: 1402238-001). Details of the FIS instrument and its in-orbit performance/calibration are described in Kawada et al. (2007) and Shirahata et al. (2009). The FIS was operated in the photometry mode with the four bands: N60 (65 m), WIDE-S (90 m), WIDE-L (140 m), and N160 (160 m). The four-band data were simultaneously obtained in a pointing observation for an area of about around the SQ. The FIS data were processed with the AKARI official pipeline modules (version 20070914). Finally, four-band images were created with grid sizes of for the WIDE-L and N160 bands and for the WIDE-S and N60 bands. The widths (FWHM) of the point spread functions (PSFs) are for the WIDE-L and N160 bands and for the WIDE-S and N60 bands (Shirahata et al., 2009). The four-band images are presented in Fig. 2. The images are smoothed with boxcar kernels with a width of for the WIDE-L and N160 bands, and for the WIDE-S and N60 bands.
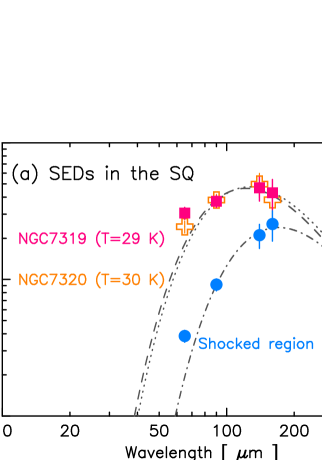
To derive the spatial variation in color temperature, the spatial resolutions of the original WIDE-S and N60 images are reduced to match those of the WIDE-L and N160 images by convolving the former images with a Gaussian kernel. The images are then resized with the common spatial scale among the four bands, /pixel. The four-band flux densities at each image bin are derived after subtracting the sky background. The background levels were estimated and subtracted using nearby regions of the blank sky, which were observed in the beginning and at the end of the scan. Color corrections were also applied for the obtained flux densities by assuming a modified blackbody spectrum with the emissivity power-law index of unity and the temperatures of 20 K and 30 K for the shocked region and galaxies, respectively. Aperture corrections were not applied to the flux densities because we only consider diffuse emission components. At the centers of the shocked region, NGC 7319, and NGC 7320, we derive the flux densities by integrating the surface brightness within circular apertures. Figure 3(a) shows the resulting spectral energy distributions (SEDs) at these positions. Note that the fluxes in Fig. 3(a) are not the fluxes for the whole areas of the shocked region and the galaxies. The systematic errors for the flux densities are estimated to be 10 % for the WIDE-S and N60 bands, 20 % for the WIDE-L band, and 25 % for N160 band, which include the uncertainty due to radiation effects. The relative uncertainties for the flux densities are estimated to be below 5 % for the four bands.
3 Results
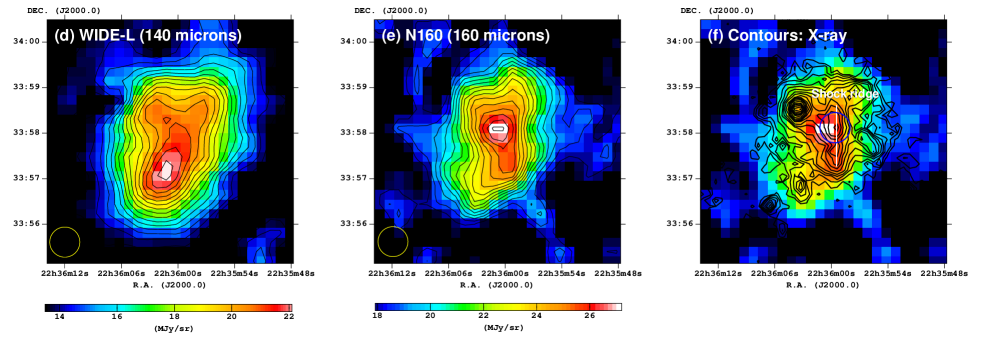
In Fig. 2, N60 and WIDE-S images show emission from NGC 7319 and NGC 7320, and from the SQ-A and SQ-B (Fig. 2(c)). Although the WIDE-L image shows a structure extending in the North-South direction along the shock ridge, the N160 image clearly shows single peak emission in addition to the structure, but does not indicate any features associated with the individual galaxies. In the shocked region, the background-subtracted surface brightness in the N160 band is larger than 9 MJy sr-1, which is comparable to 5 sky background noise. For the first time, AKARI observations reveal the dramatical change in the spatial distribution of far-IR emission at wavelengths around 140-160 m. The difference in images between the N160 band and the MIPS160 band (Natale et al., 2010) may come from the fact that the spectral response of the N160 band covers longer wavelengths than that of the MIPS160 band; wavelength coverage at 10 % of the peak responsivity is - m for the N160 band (AKARI FIS Data Users Manual ver.1.3) and - m for the MIPS160 band (MIPS Instrument Handbook). Figure 2(f) shows that the spatial distribution of 160 m emission is quite similar to that of X-ray emission in the shocked region. In fact, X-ray, radio, and H2 emission in the shocked region all show structures associated with the shock ridge and the bridge extending eastward from the shock ridge to NGC 7319. Our result clearly shows the spatial correlation of the far-IR emission with these structures.
3.1 Difference in images between N160 and WIDE-L bands
The cold dust temperatures in the shock and surrounding galaxies are about 20-30 K. Because the flux ratio between the N160 and WIDE-L bands is not very sensitive to the dust temperature, the difference in the spatial distribution of far-IR emission between the two bands is hard to explain only by the presence of the cold dust component. An alternative possibility is a contribution from the shock-powered [C II]158 m line emission to the N160 band. For the SQ, the wavelength of [C II]158 m line is redshifted to 161 m (Hickson, 1992). Thus, its contribution to the N160 band is larger than to the WIDE-L band. To estimate the contribution from the [C II] line, the WIDE-L flux density is simply subtracted from the N160 flux density by assuming that the dust emission is constant in units of over the two bands (Fig. 3(b)). By using the same aperture as that in Fig. 2(f), the subtracted flux density is estimated to be 40 mJy. The error includes the uncertainty that to be subtracted must be increased by 38 %, if the SED of the dust emission is considered as the modified blackbody spectrum whose temperature and amplitude are determined from the data at 90 and 140 m. The uncertainty is comparable to the subtracted sky background noise. The [C II] luminosity surface density [erg sec-1 kpc-2] is given by
| (1) |
where is the distance to the SQ of 94 Mpc, is the aperture area at the shocked region (260 kpc2), and are the relative responses of the N160 and WIDE-L bands at 161 m, respectively, and and are the effective bandwidths of the N160 and WIDE-L, respectively. From Kawada et al. (2007), , , , and are taken as 0.96, 0.59, 0.4 THz, and 0.8 THz, respectively. Thus, is estimated to be erg sec-1 kpc-2, which is comparable to the H2 line luminosity surface density of erg sec-1 kpc-2(Cluver et al., 2010). By using the dust emission at 160 m, the of the [C II] line is estimated to be 10 m. The is about 10 times larger than that in nearby galaxies (the mean of 0.7 m with the dispersion of 0.2-3.0 m, Boselli et al. (2002)). We calculated the contribution of the [C II] line emission to the fluxes in the WIDE-L and N160 bands by considering the constant dust emission in units of over the two bands. We obtained 8 % to WIDE-L band and 23 % to N160 band.
3.2 Properties of far-IR dust emission
To estimate the far-IR luminosity in the shocked region, the best-fit modified blackbody (the dash dotted line in Fig 3(a)) was integrated between 3 and 3000 m to yield of erg sec-1. By dividing by the aperture area , the luminosity surface density is estimated to be erg sec-1 kpc-2, which is in agreement with the far-IR luminosity surface density ( erg sec-1 kpc-2) of ISO observations (Xu et al., 2003). In the shocked region, we calculate the dust mass according to Eq. (4) of Hildebrand (1983) with the emissivity power-law index of unity. The dust mass surface density is given by
| (2) |
The dust temperature is set to be 22 K, which is derived from the SED fitting in Fig 3(a). From Eq. (2), is estimated to be kpc-2. If we consider the contribution of the [C II] line emission to , is reduced by 20 %. Cluver et al. (2010) estimated the mass surface density of warm H2 gas in the shocked region as kpc-2. CO observations of the shocked region suggest that the mass ratio of the cold H2 ( 50 K) to warm H2 gas masses is 2 with the CO-to-H2 conversion factor of our Galaxy (Guillard, 2010). Guillard et al. (2009) estimated an upper limit of the mass surface density of H I gas in the shocked region as kpc-2. Thus, the gas-to-dust mass ratio is 170-210, which is in agreement with that of our Galaxy (Sodroski et al., 1997). The estimated properties of the dust in the SQ are summarized in Table 1.
4 Discussion
4.1 Shock-powered [C II]158 m line emission from the shocked region
To investigate the possibility of the luminous [C II] line emission from the shocked region, the C+ abundance per hydrogen atom is estimated with assumptions that the [C II] line emission comes from the warm H2 gas and is optically thin. Within these assumptions, is given as
| (3) |
where is the kinetic temperature of H2 gas, is the critical density of the [C II] line emission for H I collisions, and is the number density of H I. At the shocked region, and are 158 K and cm-3, respectively (Cluver et al., 2010). is cm-3 at 158 K (Langer et al., 2010). Thus, is estimated to be . Assuming that the carbon in the [CII] line emitting region is in singly ionized form, the carbon abundance in the shocked region is in agreement with that in an interstellar gas-phase (, Cardelli et al. (1996)). Therefore, the luminous [C II] line emission from the shocked region is physically plausible provided that C+ is the main carbon form in the warm H2 gas.
4.2 Origin of the cold dust emission from the shocked region
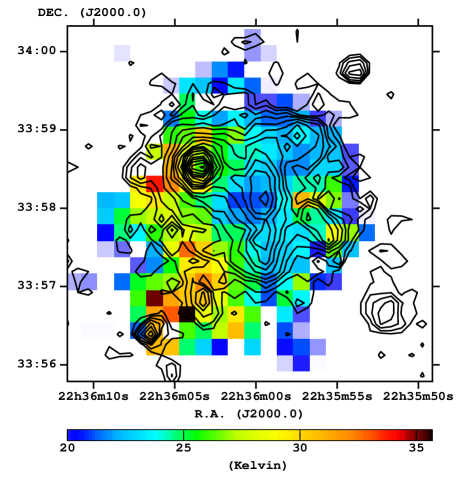
The clear spatial correlations among the cold dust, H2, and X-ray emissions suggest two possibilities: radiative heating of dust grains in a low interstellar radiation field (ISRF) and collisional heating of dust grains in a hot plasma. To explain the formation of H2 gas in the shocked region, Guillard et al. (2009) introduced a model of the shock in an inhomogeneous gas phase. In their model, there are two critical assumptions to explain the formation of H2 gas in the collision age: dust survival in the shock and the Galactic gas-to-dust mass ratio. The spatial correlation between the maps of the cold dust emission and H2 rotational line strongly supports H2 formation on dust grains. In addition, the observed gas-to-dust mass ratio in the shocked region is in agreement with the Galactic one. These facts indicate that the H2 formation time scale should be shorter than the collision age. In the case of the multiphase medium, the cold dust emission comes from molecular gas clouds. Guillard et al. (2010) modeled SEDs of dust emission associated with diffuse (the hydrogen column density cm-2) or clumpy molecular gas ( cm-2) in radiation fields. As discussed in Section 4.1, the [C II] line emission can come from molecular gas clouds. The optical depth of the [C II] line is expressed in Eq. (A4) of Crawford et al. (1985). By using of and the velocity dispersion of 870 km s-1 (Cluver et al., 2010), is estimated to be cm-2 when becomes unity. Thus, the [C II] line emission is optically thin for both cloud models. To estimate color temperatures of cold dust for both cloud models, flux densities at 90 and 160 m are obtained from Fig. 7 in Guillard et al. (2009). Assuming the modified blackbody spectrum with the emissivity power-law index of unity, the color temperature is estimated to be 24 K for the diffuse molecular gas model and 20 K for the clumpy one. We investigate the spatial distribution of the color temperature in the SQ (see Fig. 4) by using the flux densities at 90 and 160 m that are above the sky background noise. Errors in the color temperature are estimated as - K. The color temperature in the shocked region is about 20 K, which favors the temperature for the clumpy molecular gas model rather than the diffuse one and significantly lower than that in the surrounding galaxies. Thus, it is possible that cold dust in the shocked region is radiatively heated by the ISRF.
The spatial correlation between the maps of the cold dust emission and X-ray suggests an alternative possibility for the origin of cold dust emission in the shocked region. If dust grains are exposed to the hot plasma for the collision age ( yr), grains smaller than 0.1 m in radius must have been destroyed in yr (Guillard et al., 2009). We calculated the temperatures of dust grains with radii m heated collisionally by ambient plasma electrons, based on the model of Dwek (1986, 1987). We assumed the size distribution with = 2.5-3.5 over the range for either silicate or graphite grains. The density and temperature of the electrons are taken to be cm-3 and K, respectively (Trinchieri et al., 2003). As a result, we derive the dust temperature of 20-22 K, which is insensitive to a specific choice of or grain composition. The derived temperature is in a range similar to that observed in the shocked region. Thus we cannot distinguish between radiative heating and collisional heating of dust grains solely from the dust temperature.
However, the similarity in the spatial distribution between the far-IR (cold dust and [C II] line) emission and H2 emission strongly suggests that H2 molecules form on dust grains and coexists with C+. Moreover, Natale et al. (2010) showed that the collisionally heated dust emission should be minor contribution to explain the X-ray temperature map. Therefore, it is likely that the far-IR dust emission arises mostly from radiative heating of cold dust in clumpy molecular gas. These facts support the multiphase medium model for the SQ.
5 Summary
We observed the SQ with the FIS aboard AKARI in four far-IR bands. The N160 band image shows single peak emission in addition to the structure extending in the North-South direction along the shock ridge as seen in the WIDE-L band, H2 emission and X-ray emission. Whereas most of the far-IR emission in the shocked region comes from the cold dust component, the [C II] line emission whose luminosity is comparable to that of the warm H2 gas can significantly contribute to the single peak emission in the N160 band. It can be explained that the [C II] line emission comes from the warm H2 gas. In the shocked region, the observed gas-to-dust mass ratio is in agreement with the Galactic one. These indicate that H2 molecules are produced on the grain surface and their formation timescale should be shorter than the collision age. The color temperature in the shocked region ( K) is significantly lower than that in the surrounding galaxies ( K). It is considered that the cold dust emission comes mostly from radiative heating in dense and clumpy gas clouds. Our results support the scenario of the multiphase medium of the pre-shocked gas in the IGM.
References
- Allen and Hartsuiker (1972) Allen, R. J., & Hartsuiker, J. W. 1972, Nature, 239, 324
- Appleton et al. (2006) Appleton, P. N. et al. 2006, ApJ, 639, L51
- Boselli et al. (2002) Boselli, A., Gavazzi, G., Lequeux, J.,& Pierini, D. 2002, A&A, 385, 454
- Cardelli et al. (1996) Cardelli, J. A., Meyer, D. M., Jura, M., & Savage, B. D. 1996, ApJ, 467, 334
- Cluver et al. (2010) Cluver, M. E. et al. 2010, ApJ, 710, 248
- Crawford et al. (1985) Crawford, M. K., Genzel, R., Townes, C. H., Watson, D. M. 1985, ApJ, 291, 755
- Dwek (1987) Dwek, E. 1987, ApJ, 322, 812
- Dwek (1986) Dwek, E. 1986, ApJ, 302, 363
- Gould & Salpeter (1963) Gould R. J., Salpeter E. E. 1963, ApJ, 138, 393
- Guillard et al. (2010) Guillard, P., Boulanger, F., Cluver, M. E., Appleton, P. N., Pineau des Forets, G.,& Ogle, P. 2010, A&A, 518, 59
- Guillard (2010) Guillard, P. 2010, arXiv:1001.3613
- Guillard et al. (2009) Guillard, P., Boulanger, F., Pineau Des Forêts, G., & Appleton, P. N. 2009, A&A, 502, 515
- Hickson (1992) Hickson, P., Mendes de Oliveira, C., Huchra, J. P., & Palumbo, G. G. 1992, ApJ, 399, 353
- Hickson (1982) Hickson, P. 1982, ApJ, 255, 382
- Hildebrand (1983) Hildebrand, R. H. 1983, QJRAS, 24, 267.
- Kaneda et al. (2009) Kaneda, H., Koo, B. C., Onaka, T., & Takahashi, H. 2009, Advances in Space Research, 44, 1038
- Kawada et al. (2007) Kawada, M. et al. 2007, PASJ, 59, 389
- Langer et al. (2010) Langer, W. D., Velusamy, T., Pineda, J. L., Goldsmith, P. F., Li, D., & Yorke, H. W. 2010, A&A, 521L, 17L
- Moles et al. (1997) Moles, M., Sulentic, J. W., & Marquez, I. 1997, ApJ, 485, L69
- Murakami et al. (2007) Murakami, H. et al. 2007, PASJ, 59, 369
- Natale et al. (2010) Natale, G. et al. 2010, ApJ, 725, 955
- O’Sullivan et al. (2009) O’Sullivan, E., Giacintucci, S., Vrtilek, J. M., Raychaudhury, S., & David, L. P. 2009, ApJ, 701, 1560
- Pietsch et al. (1997) Pietsch, W., Trinchieri, G., Arp, H., & Sulentic, J. W. 1997, A&A, 322, 89
- Shirahata et al. (2009) Shirahata, M. et al. 2009, PASJ, 61, 737
- Sodroski et al. (1997) Sodroski, T. J., Odegard, N., Arendt, R. G., Dwek, E., Weiland, J. L., Hauser, M. G. & Kelsall, T. 1997, ApJ, 480, 173S
- Trinchieri et al. (2005) Trinchieri, G., Sulentic, J., Pietsch, W., & Breitschwerdt, D. 2005, A&A, 444, 697
- Trinchieri et al. (2003) Trinchieri, G., Sulentic, J., Breitschwerdt, D., & Pietsch, W. 2003, A&A, 401, 173
- Xu et al. (2003) Xu, C. K., Lu, N., Condon, J. J., Dopita, M., & Tuffs, R. J. 2003, ApJ, 595, 665
| Gas-to-dust | |||
| (K) | (erg sec-1 kpc-2) | ( kpc-2) | mass ratio |
| 221 | 170210 |