Filament Eruption in NOAA 11093 Leading to a Two-Ribbon M1.0 Class Flare and CME
Abstract
We present multi-wavelength analysis of an eruption event that occurred in Active Region (AR) NOAA 11093 on 7 August 2010, using data obtained from SDO, STEREO, RHESSI and GONG H network telescope. From these observations, we inferred that upward slow rising motion of an inverse S-shaped filament lying along the polarity inversion line (PIL) resulted in a CME subsequent to a two-ribbon flare. Interaction of overlying field line across the filament with side lobe field lines, associated EUV brightening, and flux emergence/cancellation around the filament were the observational signatures of the processes leading to its destabilization and the onset of eruption. Moreover, the rising motion profile of filament/flux rope corresponded well with flare characteristics, viz., the reconnection rate and HXR emission profiles. Flux rope accelerated to the maximum velocities followed by deceleration to an average velocity of 590 kms-1. We suggest that the observed emergence/cancellation of magnetic fluxes near the filament caused it to rise, resulting in the tethers to cut and reconnection to take place beneath the filament; in agreement with the tether cutting model. The corresponding increase/decrease in positive/negative photospheric fluxes found in the post-peak phase of the eruption provides unambiguous evidence of reconnection as a consequence of tether cutting.
keywords:
Active Regions, Magnetic Fields; Corona, Active; Flares, Dynamics1 Introduction
Intro
Solar filament eruptions are energetic events occurring due to the explosive release of magnetic energy. Understanding the driver and trigger mechanisms of these eruptions is one of the most challenging, ongoing research problems in solar physics. These events manifest as prominence eruptions if seen at the limb, and as filament eruptions if seen against the disk. They can be broadly divided into two classes - (i) ejective eruptions which give CMEs and long duration two-ribbon flares, and (ii) confined eruptions which give short duration flares. However, there are also filament/prominence eruptions that are not associated with any flares. What defines the eruption to be ejective or confined event remains an unanswered question (For detailed reviews on theories of eruptions, refer to \inlinecitepriest2002, \inlinecitelin2003).
In filament eruptions, one commonly observed feature in chromospheric H images is two bright flare ribbons separating away as the flare progresses. This process is explained as follows: Reconnection of magnetic fields is believed to be the underlying mechanism for energy release as proposed by \inlinecitecarmi1964, \inlinecitesturrock1966, \inlinecitehirayama1974, \inlinecitekopp1976. As a coronal magnetic flux rope loses equilibrium and travels upwards, an extreme reconnection current sheet (RCS) is formed underneath. Reconnection in this RCS releases most of the magnetic energy stored in the magnetic field configuration [Forbes and Priest (1984), Lin and Forbes (2000)]. Charged particles can be effectively accelerated by the electric field in the RCS [Martens and Young (1990), Litvinenko and Somov (1995)]. Some particles, energized during a solar flare, gyrate around the field lines and propagate toward the underlying foot points, precipitating at different layers of the solar atmosphere to produce the two-ribbon flares. Separation of these chromospheric flare ribbons is believed to provide a signature of the reconnection process occurring progressively higher up in the corona. This is the standard flare model scenario. All eruption models lead to this standard model in the onset phase of eruption.
Several ideas have been advanced for explaining the eruption onset mechanism [Klimchuk (2001), Forbes (2006), Moore and Sterling (2006)]. In tether-cutting model proposed by \inlinecitemoore1980, and further elaborated by \inlinecitemoore2001, magnetic tension restraining the sheared core field of a bipolar magnetic arcade is released by internal reconnection above the PIL. Evidence for the tether-cutting model can be found in several recent observational studies [Liu et al. (2007), Wang (2006), Yurchyshyn et al. (2006)]. External tether cutting or “breakout” reconnection is similar to tether cutting in that it is a tension release mechanism via reconnection. But here it occurs between the arcade envelope of the erupting field and an over-arching restraining, reversed field of quadrupolar magnetic configuration [Antiochos (1998), Antiochos, DeVore, and Klimchuk (1999)]. Flux cancelation [Martin, Livi, and Wang (1985), Martin (1989)], emergence of twisted flux ropes from below the surface [Leka et al. (1996)], and ideal MHD instability [Kliem and Török (2006), Fan and Gibson (2007)] are some other mechanisms proposed to explain the eruption process.
Although there exist several proposed mechanisms, it is difficult to disentangle as to which particular mechanism is responsible for the fast eruption in complex ARs. This difficulty arises due to the wide variety of dynamic processes involved in such ARs. Therefore, we have selected a filament eruption event that occurred in a relatively simple solar AR NOAA 11093 on 7 August 2010 that led to M1.0 class two-ribbon flare and a fast CME. Our aim in this study is to understand the driver and trigger mechanisms of the eruption and associated processes. We investigate various possible conditions of eruption process in relation to flux emergence/cancellation at selected locations. From a morphological analysis, we attempt to find triggering mechanism of the flare. We derive the flare energetics in order to quantify flare characteristics and then compare it with previous such studies.
The essence of high cadence and high resolution multi-wavelength observations has already been revealed by earlier studies [Liu et al. (2007), Liu et al. (2005), Wang and Sheeley (1999)]. In the present study, we utilize the unique opportunity of coordinated observations in multi-wavelength channels corresponding to different atmospheric heights provided by Atmospheric Imaging Assembly (AIA; \inlinecitelemen2011) and Helioseismic and Magnetic Imager (HMI; \inlineciteschou2011) on board Solar Dynamics Observatory(SDO).
The rest of the paper is organized as follows: The observational data and reduction procedures are presented in Section \irefdata. Results and discussions are described in Section \irefanalys while Section \irefsumm gives the summary and conclusions.
2 Observational Data and Reduction
data
The eruption event in AR NOAA 11093 () occurred on 7 August 2010. It produced a GOES M1.0 class flare starting at 17:55 UT and peaking at 18:20 UT. This event was covered by SDO’s AIA and HMI, Reuven Ramaty High-Energy Solar Spectroscopic Imager (RHESSI; \inlinecitelin2002), as well as, by the ground based GONG H network telescope at BBSO. The associated CME was detected by the COR1 coronagraph [Thompson et al. (2003)] on board both the Ahead and Behind satellites of the Solar TErrestrial RElations Observatory (STEREO) which were separated by about .
AIA takes multi-wavelength images at pixel size of pixel-1 and 12 s cadence. To study the flaring plasma, we focused on the images obtained in 94Å (Fe XVIII; ), 171Å (Fe IX; ) corresponding to the upper transition region, and 304Å (He II; ) corresponding to the chromosphere and lower transition region. Images were added to enhance the signal to noise ratio, giving a cadence of 1 minute. We have used preprocessed images (level 1.0) provided after calibration, involving bad pixel correction, aligning, and scaling.
HMI makes measurements of line-of-sight magnetic field of the full solar disk at 6173Å with a pixel size of and s cadence with a precision of 10G. We rotated images (level 1.0) for solar north pointing up. Scaling of data was done using the header information. We added every four images for increasing the signal to noise ratio, giving a cadence of 3 minutes.
COR1 is an internally-occulted coronagraph and is one of the STEREO SECCHI suite of remote sensing telescopes. It takes observations of CME from 1.3 to 4 solar radii in three different polarizing angles every five minutes. We have used secchi_prep.pro and cor1_quickpol.pro routines in STEREO software package to process the images and finally to get total polarization brightness images. For observing ejected material within 1.2 , we have also examined EUVI observations on board STEREO-A.
We obtained H 6563 Å filtergrams at pixel size of and 1 minute cadence from the GONG telescope operating at BBSO.
All full disk images obtained from different instruments were aligned by differentially rotating to a reference image at 18:00 UT. The offset was corrected after remapping and by overlaying magnetic contours on images taken by different instruments. We have used standard SolarSoftWare (SSW) library routines for our study.
3 Results and Discussions
analys
3.1 Filament Evolution Leading to the Two-Ribbon M1.0 Flare
3.1.1 Morphology
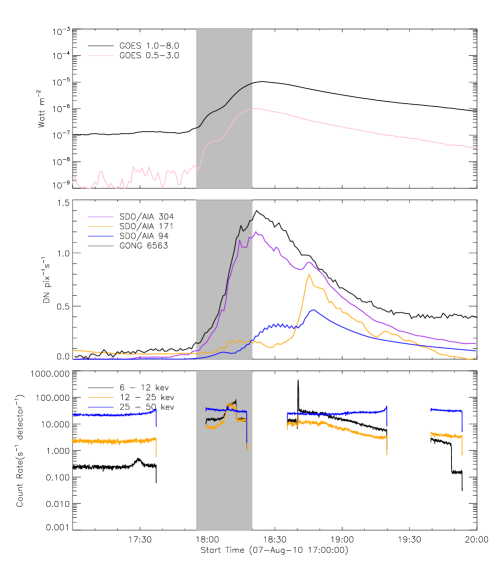
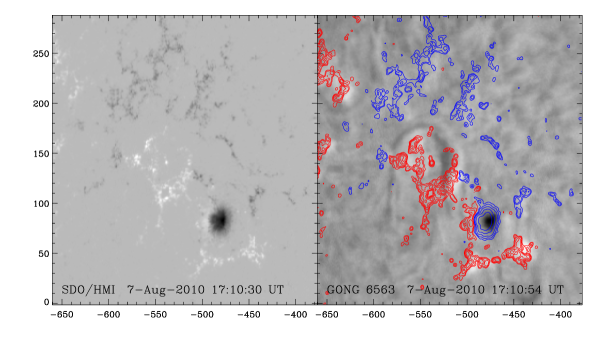
Figure \ireffig1(left panel) shows an HMI magnetogram of AR NOAA 11093 taken on 7 August 2010 at 17:10 UT. The AR possessed a simple magnetic configuration reported as class by NOAA/USAF AR Summary issued on 7 August 2010. The GONG H filtergram of the AR with contours of the line-of-sight magnetic field is shown in the right panel. It consisted of a single main sunspot and an inverse S-shaped filament with its one end connected to the sunspot, as observed more than an hour before the eruption event ensued. These images show the polarity of the dominant main sunspot and the diffused fluxes of opposite polarities surrounding the filament.
The filament was oriented in nearly NE-SW direction along the PIL. Concerning the observed filament, the AR was bipolar with two main leading polarities located on either side of PIL. We have concentrated our study mainly on the time interval 17:00–20:00 UT for identifying the changes occurring in morphological structure as well as the connectivity of field-lines in the AR leading to filament eruption and the flare.
Light curves of the flare in different wavelengths are shown in Figure \ireflitcur. The gray shaded region from the start to peak time of GOES flux represents the impulsive phase of the flare. The decay phase of GOES soft X-rays flux lasted over three hours from the peak time, implying that this relatively small M1.0 class flare was a long duration event (LDE). The AIA 304 Å and H profiles essentially followed the GOES profiles, peaking at around 18:20 UT. However, AIA 94 and 171 Å profiles did not agree well in the impulsive phase, and peaked much later at 18:45 UT. By examining the corresponding images, we found that the delayed peaking in these wavelengths corresponded with the post-flare loops that appeared in the decay phase.
The RHESSI hard X-rays (HXR) profiles show two gaps owing to the spacecraft’s passage through the night-time and South Atlantic Anomaly. However, the available data in the shaded region, i.e., the impulsive phase of the flare, clearly shows a short duration enhancement in the level of HXR emissions in 6-12 and 12-25 keV channels. Notably, however, no enhancement was seen in the harder emission in 25-50 keV (blue) channel.
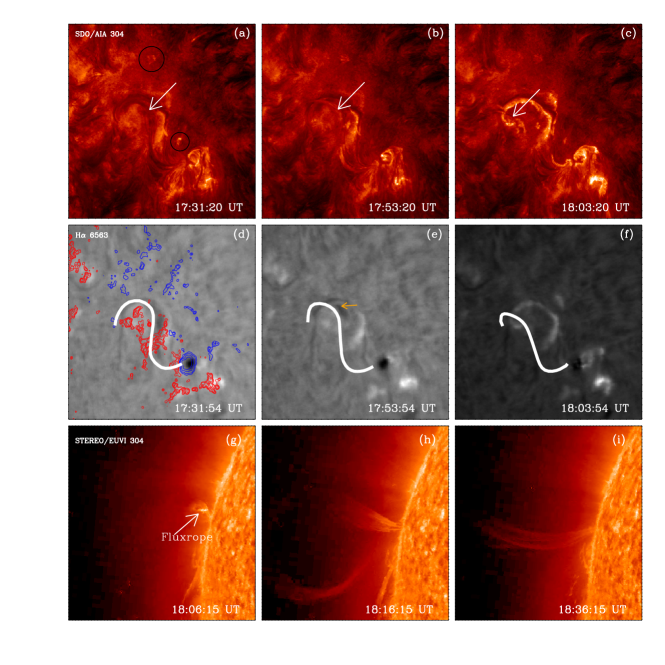
¿From movies made using the images in H and AIA channels, we observed that a flux rope having an average diameter of 6.9 Mm () started to rise from the inner core of the filament at around 17:40 UT. Figure \irefpreris(a-c) shows, as pointed by arrows, the rise of flux rope connecting the sunspot and the other end of the filament elbow. The projection of this flux rope on chromosphere is seen as a dark shadow moving toward east and disappearing after 18:04 UT. At that time it had risen high, nearly vertical to the disk plane. About 15 min after the start of its rise, flare brightenings appeared; first the northern ribbon at the hump part and then the southern one. The rise of filament was seen as plasma jet ejection in EUVI images of STEREO A in 304 Å (Figure \irefpreris(g-i)). STEREO A and B were separated by 150∘, and STEREO B was situated at 71∘ west from the Earth, AR 11093 was 36∘ west of STEREO-B central meridian and 24∘ away from east limb of STEREO-A. Therefore, the flux rope was not visible till 18:03 UT in STEREO-A. Furthermore, from STEREO-B the event was not as clearly visible as in AIA 304 Å due to the lower spatial resolution ( 1.6′′/pixel).
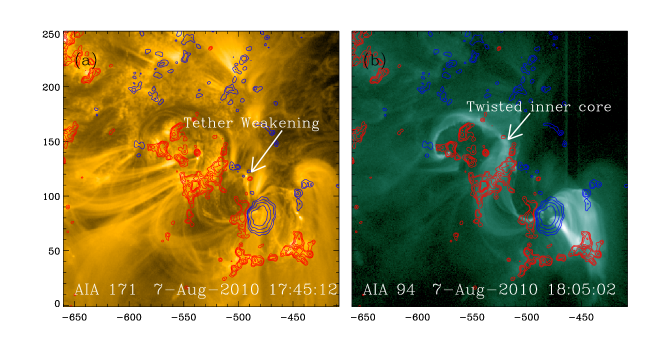
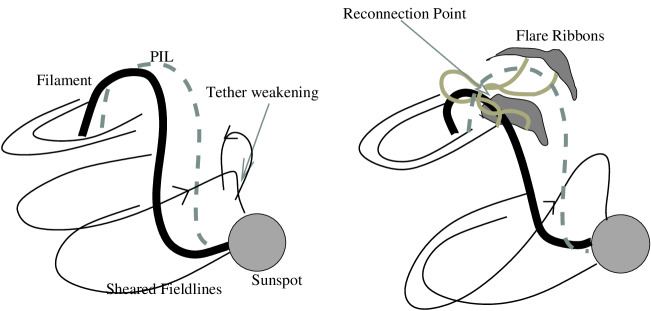
We provide the schematics of eruption event constructed by a careful examination of observed plasma tracers using animations of 171 and 94 Å images in Figure \irefschem_fil_eru. The EUV brightening in the smaller encircled location of Figure \irefpreris(a) resulted due to the interaction of overlying sheared field lines from the sunspot with the side lobe field lines, as shown in Figure \irefschem_fil_eru(frame a and b). This interaction substantially weakened the overlying field lines, allowing the flux rope to rise upward. This rising motion formed current sheet in cusped region of field lines connecting polarities on either side of the filament leading to the onset of internal reconnection to commence the flare. In 94 Å image (frame b), the twisted bright flux system can be seen in the inner core below the flux rope. It is important to notice that the bright flux system appeared only in 94 Å because soft X-ray emission began due to reconnection by the above process. This scenario agrees well with the model of \inlinecitemoore2001 that describes “tether cutting” as the trigger mechanism. It is worth mentioning that the tether weakening first occurred at the location of brightening and then induced further in the core region beneath the filament. Tether cutting as a trigger for the onset of eruption within the erupting system is addressed by \inlineciteyurc2006 in a quadrupolar configuration. We will discuss the magnetic flux changes at the locations of these brightenings in Section \irefFlxCha
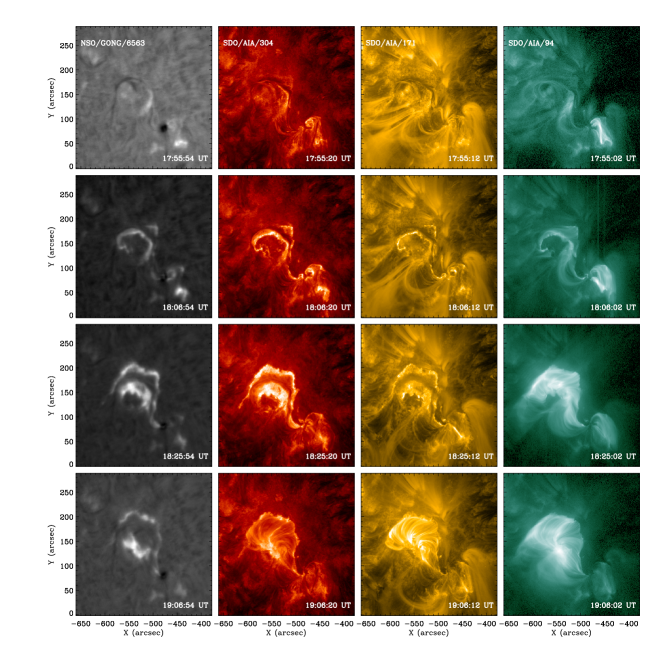
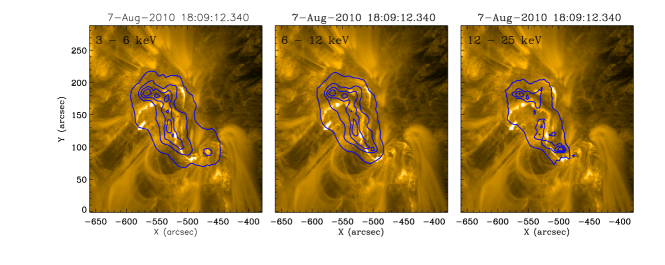
Figure \irefmosaic is a mosaic of multi-wavelength images illustrating filament eruption and the flare in H and various AIA channels corresponding to successively higher atmospheric layers (from left to right columns). Rows correspond to the time of start (top), impulsive (second and third), and decay (bottom) phases of the flare. First column shows flare ribbons in chromospheric H. As time progressed, flare ribbons brightened and separated away up to the peak time 18:25 UT, and decayed there after. Images in the second column correspond to AIA 304 Å, showing flare ribbons in the upper chromosphere along with the overlying field lines filled with K plasma. Post-flare loops connecting the flare ribbons are clearly seen in the decay phase. These post flare loops gave rise to the second peak of 304 Å light curve in Figure \ireflitcur. In third column, AIA 171 Å images show plasma loops more clearly as these are sensitive to K. Fourth column corresponds to AIA 94 Å images showing plasma loops at even higher temperatures (K). We can observe here an increased twist in core flux system due to tether cutting reconnection with increased flux rope height (18:06:02 UT frame). It is important to note that this twisted flux system is not visible in 304 and 171 Å corresponding to lower heights. Once the main reconnection phase commenced, these twisted flux system below the flux rope, as seen at 18:06:02 UT in the inner core of filament, relaxed to arcades of lower twist seen at 19:06:26 UT in the decay phase. This twisted, or sigmoid to arcade evolution is an important mechanism of energy release process as studied in many events [Liu et al. (2007), Liu et al. (2005)]. (A movie, “mosaic.mpeg”, is available on request.)
¿From the RHESSI light curves, it is evident that HXR sources were produced during the impulsive phase of the flare, at least in the lower energies of 6-12 and 12-25 keV. Unfortunately no data was available during 18:17-18:36 UT due to the spacecraft’s night-time and afterward when attenuators were out of the field of view. The data with sufficient counts for imaging was available only during 18:00-18:10 UT in the impulsive phase of the flare.
We constructed the HXR images with “clean” algorithm from the modulated data and looked for HXR sources in the flaring region. In Figure \irefrheimg, we have plotted the contours of these reconstructed images in the energy bands of 3-6, 6-12 and 12-25 keV at 18:09 UT and overlaid on AIA 171 Å images. Integration time of the images was taken as 1 min; adequate to detect the changes. Due to the rather low count rates in this event, it was not possible to reconstruct images in higher energy bands.
The HXR contours were found to be localized between the flare ribbon kernels suggesting that reconnection took place at these locations, where particles accelerated along the field lines and propagated toward foot points anchored in the photosphere. In the 12-25 keV image, a break in contours was observed on ribbon hump part. This suggests that non-thermal HXR sources were located at foot points of the flare ribbons. In the absence of additional HXR data, however, it was not possible to follow up their further evolution.
3.1.2 The Flare Energetics
We can study the flare energetics by evaluating two main physical parameters, viz., the rates of reconnection and energy release. Reconnection rate is the electric-field strength in RCS and is defined as the reconnected magnetic flux per unit time expressed as
| (1) |
The magnetic energy release rate during a solar flare is the product of Poynting flux and the area of RCS that is generated during magnetic reconnection. On the basis of reconnection model, it has been shown by \inlineciteisobe2002 that energy release rate can be written as,
| (2) |
where S is the Poynting flux into the reconnection region, , , and are coronal magnetic field strength, inflow velocity, area of the reconnection region, and the filling factor of reconnection inflow, respectively.
The inflow velocity can be determined from observations. Using the magnetic flux conservation theorem, one can write
| (3) |
where is the velocity of the H ribbon separation, and , are the photospheric and chromospheric magnetic field strengths respectively.
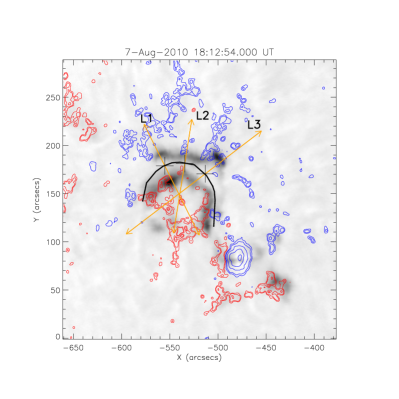
Figure \irefnutlin depicts the scenario of flare ribbon separation motion along the arbitrarily selected lines L1, L2, and L3. We have measured distances from points marked as “+” on both sides of PIL shown in thick solid line, i.e toward the north and south directions. Separation velocities are then determined after fitting Boltzmann sigmoids through the measurements. Further, using these we calculated the reconnection rates, and Poynting fluxes for a quantitative study of flare energetics.

For obtaining ribbons’ separation velocity, we followed the technique and assumptions as discussed in \inlinecitemaurya2010 [and references therein] with and . We thus obtained the reconnection rates in the range 0.5-3 Vcm-1 and Poynting fluxes in the range 0.01-3.8 G erg cm-2s-1 as measured along the lines L1, L2, and L3. We have plotted one of the temporal profiles in Figure \irefflxrop_ht for comparing with the filament/CME rise. This flare lasted for about 3000 seconds with current sheet spread over an area , with average energy release rate of erg cm-2s-1. Using these typical values, we estimate the total energy released during the flare event to be a modest ergs, in conformity with the magnitude of the flare. Our results are consistent with that of quiescent filament eruption reported by \inlinecitewang2003.
We notice here that kernel velocities were not uniform along the selected lines. Further, electric field that is expected to release energy through dissipation of electric currents in RCS, temporally did not correlate well with impulsive hard X-ray emission in some directions. To investigate the electron acceleration in the impulsive phase of the flare, we require hard X-ray and microwave observations. But, due to the data gap in hard X-rays during the impulsive phase, we have used the time derivative of GOES soft X-ray light curve as an alternative to the hard X-ray with the assumption that Neupert effect is valid in this event (as in reference XXXX).
Our estimates for this M1.0 are lower as compared to the velocities of 15-50 kms-1 and reconnection rates of 2.7-11.8 Vcm-1 for the M3.9 flare event reported by \inlinecitemiklenic2007. Also, for a rather short duration, small C9.0 flare, \inlineciteqiu2002 reported a significantly larger kernel velocity of 20-100 kms-1 and peak electric field of 90 Vcm-1. They found ribbon motions both parallel and perpendicular to PIL and concluded that either the 2D-magnetic reconnection theory related to the H kernel motion was applicable only to a part of the flare region due to its particular magnetic geometry, or the electron acceleration was dominated by some other mechanisms depending on the electron energy. We therefore suggest that the estimated electric fields and reconnection rates depend not only on the magnitude of the flare, but also on the flare kernel velocity and the magnetic field geometry.
3.2 The CME and its dynamics
erucme The flux rope started rising at 17:40 UT as seen in AIA 304Å (cf., Figure \irefpreris). Further, with its rise, the surrounding overlying loops also started rising as if they formed a balloon like cavity expanding temporally. The jet like ejection of plasma came out from the reconnection region with ejection velocity presumably proportional to the reconnection rate as its height increased. Eventually, it is observed as the CME event in COR1 coronagraph at about 18:20 UT.
We project the lateral displacements of filament in vertical direction in AIA 304 Å in pre-rise phase(see for details \inlinecitewang2003) and corrected heights of flux rope as it is seen exactly on the limb in EUVI/STEREO in impulsive phase. Then we reconstructed the heights of CME front end from triangulation method in decay phase to obtain the heights of filament/flux with its rise. In order to reduce the measurement errors, we fit them with Boltmann sigmoid function as used for flare ribbon motion [Maurya and Ambastha (2010)]. This function suits well as a model to the data because the lower, steep and upper parts of this function resemble the rise, impulsive and decay phases of CME/flux rope dynamics and can be fitted by four parameters in the least square sense.
Heights of filament and CME front is plotted in Figure \irefflxrop_ht for comparing with temporal evolution of flare ribbon separation, filament eruption and flare energy release in terms of reconnection rate [Wang et al. (2003)]. The fast-rising stage coincided with the flare impulsive phase, and the mass acceleration increased rapidly along with the increase of magnetic reconnection rate. As evident from the figure, flare ribbons appeared at 17:58 UT and attained maximum velocity at the peak phase of flare. This motion agreed with hard X-ray profile as electrons injected onto photosphere in the impulsive phase with increasing reconnection rate. From the figure, we can see that filament started to rise in the first 15 minutes with velocity in the range 8-10 kms-1 reaching 100 kms-1 at an average acceleration of 60 ms-2. ¿From STEREO observations including COR1, we found that the CME traveled with an average speed of 590 kms-1 and reached peak acceleration of 220 ms-2 at the peak phase of the flare. It then decelerated in the decay phase gradually. This is in correspondence with magnetic reconnection rate and flux rope acceleration obtained from a study of 13 well observed two-ribbon flares [Jing et al. (2005)]. The acceleration in the range 50-400 ms-2 and peak reconnection rates in the range 0.2-5.0 Vcm-1 as obtained by them are consistent with our results.
3.3 Changes in the Photospheric Magnetic Field
FlxCha Theoretical models suggest that evolution of magnetic fields at or below the photosphere, in the form of flux emergence and cancellation, could result in a loss of equilibrium of the magnetic structures [Martin, Livi, and Wang (1985), Martin (1989), Leka et al. (1996)]. Changes in the photospheric longitudinal magnetic field around the time of eruption have been examined by many workers in the past [Wang and Sheeley (1999), Mathew and Ambastha (2000), Green et al. (2003), Ambastha (2007), Jiang, Shen, and Wang (2007), Sterling, Harra, and Moore (2007)]. \inlinecitezhang2008b studied the relationship between flux emergence and CME initiation inferring that of CME source regions have increase and have decrease of magnetic flux.
Here, we look for regions, if any, of flux emergence/cancellation in photospheric LOS magnetic field using high resolution SDO/HMI magnetograms. We carried out registration of the images by differentially rotating to a reference image at 18:00 UT. Effects of telescope jitter and other pointing errors were corrected by using a cross correlation method reducing the uncertainty within 1-2 arc sec. Every four images were added to yield a cadence of 3min. As the HMI precision is 10G, we neglected magnetic fields below this value.
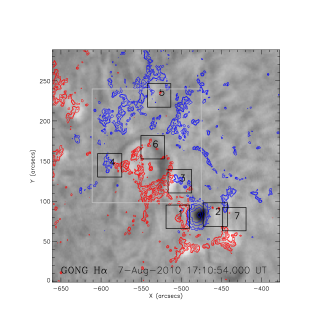
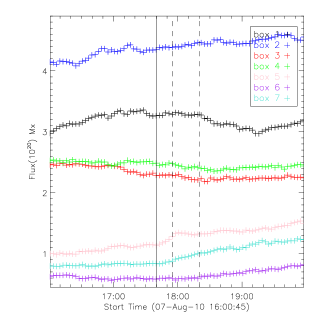
A typical GONG H image of NOAA 11093 overlaid with contours of LOS magnetic fields is shown in Figure \irefmagbx_prof (left frame). From a movie of the registered images, we identified sites of flux emergence/cancellation, marked in the figure by boxes, located around the filament and the sunspot in the AR. Time profiles of unsigned magnetic fluxes corresponding to the selected boxes are plotted during the period 16:00-20:00 UT. Sufficient care was taken in selecting the box size of . A very small box size would not adequately cover the region of interest, while averaging over too large a region would dilute the magnitude of changes.
We interpret temporal evolution of fluxes in each box and its contribution to the stability of sunspot-filament magnetic system. Boxes 1 and 2 are located around the leading sunspot. Box 1 selected at the penumbral location of sunspot also covered regions of opposite polarity fluxes around the filament. Total unsigned flux increased there till the time of onset of the filament eruption, and decreased thereafter. On the other hand, changes were oscillatory in box 2 before the flare, where a small region of negative (red) flux emerged along with pre-flare brightening.
Boxes 3, 4, 5 and 6 are located at either side of the PIL from where field lines originated to tie the filament as ropes required for a stable configuration. Changes in these boxes are important for examining the stability of the filament. In box 3, a gradual decrease of Mx flux occurred at the flare onset time from the time of start of the rope rise. On the other hand, flux increased in boxes 5, 6, and 7 as a result of new flux emergence. Of these, box 6 was located under the flux rope. Evidently, there were sites of flux emergence/cancellation in and around the filament influencing its stability. As the HMI measurements do not suffer by the degrading effect of Earth’s atmosphere, one can be reasonably confident about the observed flux changes.
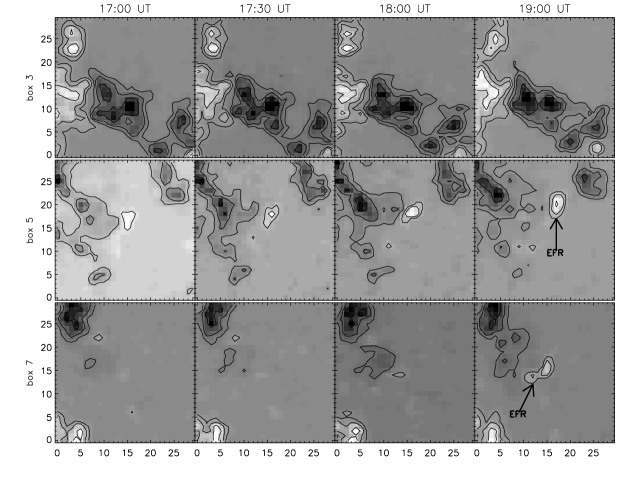
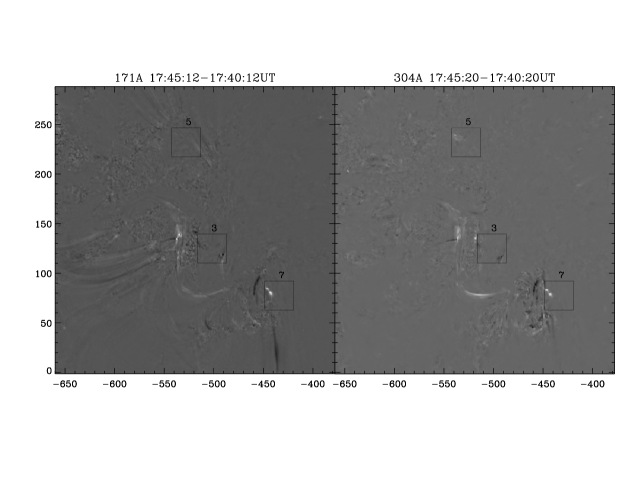
To further corroborate these temporal changes, we enlarged some ROIs as shown in Figure \irefbrig (top panel). Emerging flux regions(EFR), marked by arrows, can be seen in these regions. However, we did not find appreciable disappearance or cancelation in box 3. We also looked for any brightening expected to be associated with flux emergence/cancellation, by examining difference images of pre-eruption/flare phase, i.e., 17:45 -17:40 UT, in AIA 171 Å and 304 Å (Figure \irefbrig (bottom panel)). This showed a brightening (seen as darkening in the difference images) in box 3 where a gradual decrease of unsigned flux was observed during the rise phase of the filament. Similar changes were also found in boxes 5 and 7 (seen as white dots in difference images).

In a recent work, \inlinecitewang2010 found observational evidence of back reaction on the solar surface fluxes with coronal magnetic restructuring after reconnection in well observed X-class flares. They suggested that such results may also be detectable for smaller flares from the low threshold HMI data. To investigate it, we computed positive and negative fluxes separately in the region shown as the large box (drawn in gray color) covering the filament (Figure \irefmagbx_prof(left panel)). Figure \irefflx_chan shows that positive/negative fluxes increased/decreased by similar amount of Mx in the post flare phase. This gives an indirect evidence of reconnection as a consequence of tether cutting, mentioned in the previous sections.
Thus, we have found regions of flux emergence, cancelation and associated EUV brightening in some locations of the AR (see Figure \irefpreris(a)). The interaction of field lines at one of these brightening regions gives an evidence of reconnection leading to tether weakening. These processes could have destabilized the filament to rise upward leading to tether cutting reconnection. The observed photospheric flux changes found in the decay phase of the event are in conformity with \inlinecitewang2010, i.e., evidence of the back reaction on solar surface as a consequence of reconnection.
4 Summary and Conclusions
summ
The current models assume that the stored energy lies in a low lying magnetic flux system which is twisted or sheared. This system is the so-called core flux or flux rope. Such twisted systems in the form of inverse S (or forward S shape), called sigmoid, are usually seen in association with eruptions as the present event. \inlinecitecanf1999 had studied the nature of activity with respect to morphology of eruptive or non-eruptive events with soft X-ray observations and inferred that sigmoids are more likely to erupt.
In this paper, we have presented multi-instrument multi-wavelength observations and analysis of the eruption of an inverse S shaped filament. This event exhibits a good example of standard solar flare characterized by the filament eruption, two ribbon separation and its association with a fast CME. We summarize below the main findings of our analysis of this eruption event:
-
1.
From morphological study of this event, we inferred that the rising motion of the filament was triggered by remote tether weakening at coronal brightening region, which further induced tether cutting reconnection underneath it to unleash the eruption process, leading to a fast CME subsequent to the two-ribbon flare.
-
2.
Flare ribbons or kernels separated out with modest velocities in the range 12-16 kms-1. This was used to estimate various physical parameters for evaluating the flare energetics using a 2-D model. Reconnection rates and Poynting fluxes were estimated in the range of 0.5-3.0Vcm-1 and 0.01-3.8 G erg cm-2s-1, respectively. These were sufficient to release free energy of ergs of an M-class flare.
-
3.
Filament/flux rope rising motion profile indeed showed correspondence with various flare characteristics, viz., reconnection rate and hard X-ray emission profiles. It started rising with velocity of 8-10 kms-1, reaching a maximum of around 100 kms-1 with an average acceleration of 60 ms-2 (estimated by projecting lateral displacements of filament on to the vertical direction observed in 304 Å channel of AIA). Further, this flux rope accelerated to the maximum velocity as the CME, observed at the peak phase of the flare, followed by its deceleration to an average velocity of 590 kms-1.
-
4.
Flux variations in and around the filament were examined before and after the eruption. We found some areas of flux changes, co-temporal with the onset of filament rise. For example, gradual reduction of positive flux was found in box 3 (cf., Figure \irefmagbx_prof) at the onset time of filament rise. From a careful study of 171 Å images, it is interpreted as a consequence of interaction of overlying field lines across the filament with side lobe field lines resulting in tether weakening of the sigmoidal filament system. In addition, flux emergence in box 5 located near the rising part of the filament might have contributed to destabilize the system. In summary, we infer that these flux changes caused the loss of equilibrium leading to slow, upward rise of the filament, and the onset of eruption by tether cutting reconnection. In turn, changes occurred in photospheric fluxes in the decay phase of the flare as a back reaction of this reconnection (Figure \irefflx_chan), in accordance with the recent findings of \inlinecitewang2010.
Destabilization of the filament system can occur due to either ideal-MHD, or kink, instability [Kliem and Török (2006)]. An increased twist in the filament or flux rope system can become kinked by flux emergence, because of which filament itself can rise. Another possibility could be shear motions of photospheric fluxes; not studied here. We suggest that the observed emergence/cancellation of magnetic fluxes near the filament caused the flux rope to rise, resulting in the tethers to cut and reconnection to take place beneath the filament; in agreement with the tether cutting model. We intend to pursue this study further by invoking observations of vector magnetograms as boundary conditions for extrapolations to look for changes in the coronal magnetic field and other associated parameters.
Acknowledgements
The AIA(HMI) data used here are courtesy of SDO(NASA) and the AIA(HMI) consortium. We thank AIA team for making available the processed data. This work utilizes data obtained by the Global Oscillation Network Group (GONG) Program, managed by the National Solar Observatory, which is operated by AURA, Inc., under a cooperative agreement with the National Science Foundation. We thank the anonymous referee for carefully going through the manuscript and making valuable comments which improves readability of manuscript appreciably.
References
- Ambastha (2007) Ambastha, A.: 2007, Sun Geosph. 2, 13.
- Antiochos (1998) Antiochos, S.K.: 1998, ApJ 502, L181. doi:10.1086/311507.
- Antiochos, DeVore, and Klimchuk (1999) Antiochos, S.K., DeVore, C.R., Klimchuk, J.A.: 1999, ApJ 510, 485. doi:10.1086/306563.
- Canfield, Hudson, and McKenzie (1999) Canfield, R.C., Hudson, H.S., McKenzie, D.E.: 1999, Geophys. Res. Lett. 26, 627. doi:10.1029/1999GL900105.
- Carmichael (1964) Carmichael, H.: 1964, NASA Special Publication 50, 451.
- Fan and Gibson (2007) Fan, Y., Gibson, S.E.: 2007, ApJ 668, 1232. doi:10.1086/521335.
- Forbes (2006) Forbes, e.a. T.G.: 2006, Space Sci. Rev. 123, 251. doi:10.1007/s11214-006-9019-8.
- Forbes and Priest (1984) Forbes, T.G., Priest, E.R.: 1984, Sol. Phys. 94, 315. doi:10.1007/BF00151321.
- Green et al. (2003) Green, L.M., Démoulin, P., Mandrini, C.H., Van Driel-Gesztelyi, L.: 2003, Sol. Phys. 215, 307.
- Hirayama (1974) Hirayama, T.: 1974, Sol. Phys. 34, 323. doi:10.1007/BF00153671.
- Isobe et al. (2002) Isobe, H., Yokoyama, T., Shimojo, M., Morimoto, T., Kozu, H., Eto, S., Narukage, N., Shibata, K.: 2002, ApJ 566, 528. doi:10.1086/324777.
- Jiang, Shen, and Wang (2007) Jiang, Y., Shen, Y., Wang, J.: 2007, Chinese J. Astron. Astrophys. 7, 129. doi:10.1088/1009-9271/7/1/10.
- Jing et al. (2005) Jing, J., Qiu, J., Lin, J., Qu, M., Xu, Y., Wang, H.: 2005, ApJ 620, 1085. doi:10.1086/427165.
- Kliem and Török (2006) Kliem, B., Török, T.: 2006, Physical Review Letters 96(25), 255002. doi:10.1103/PhysRevLett.96.255002.
- Klimchuk (2001) Klimchuk, J.A.: 2001, Space Weather (Geophysical Monograph 125), ed. P. Song, H. Singer, G. Siscoe (Washington: Am. Geophys. Un.), 143 (2001) 125, 143.
- Kopp and Pneuman (1976) Kopp, R.A., Pneuman, G.W.: 1976, Sol. Phys. 50, 85. doi:10.1007/BF00206193.
- Leka et al. (1996) Leka, K.D., Canfield, R.C., McClymont, A.N., van Driel-Gesztelyi, L.: 1996, ApJ 462, 547. doi:10.1086/177171.
- Lemen et al. (2011) Lemen, J.R., Title, A.M., Akin, D.J., Boerner, P.F., Chou, C., Drake, J.F., Duncan, D.W., Edwards, C.G., et al.: 2011, Sol. Phys., 115. doi:10.1007/s11207-011-9776-8.
- Lin and Forbes (2000) Lin, J., Forbes, T.G.: 2000, J. Geophys. Res. 105, 2375. doi:10.1029/1999JA900477.
- Lin, Soon, and Baliunas (2003) Lin, J., Soon, W., Baliunas, S.L.: 2003, New A Rev. 47, 53. doi:10.1016/S1387-6473(02)00271-3.
- Lin et al. (2002) Lin, R.P., Dennis, B.R., Hurdford, G.J., Smith, D.M., Zehnder, A., Harvey, P.R., et al.: 2002, Sol. Phys. 210, 3. doi:10.1023/A:1022428818870.
- Litvinenko and Somov (1995) Litvinenko, Y.E., Somov, B.V.: 1995, Sol. Phys. 158, 317. doi:10.1007/BF00795666.
- Liu et al. (2007) Liu, C., Lee, J., Yurchyshyn, V., Deng, N., Cho, K., Karlický, M., Wang, H.: 2007, ApJ 669, 1372. doi:10.1086/521644.
- Liu et al. (2005) Liu, Y., Su, J.T., Morimoto, T., Kurokawa, H., Shibata, K.: 2005, ApJ 628, 1056. doi:10.1086/431145.
- Martens and Young (1990) Martens, P.C.H., Young, A.: 1990, ApJS 73, 333. doi:10.1086/191469.
- Martin (1989) Martin, S.F.: 1989, Sol. Phys. 121, 215. doi:10.1007/BF00161697.
- Martin, Livi, and Wang (1985) Martin, S.F., Livi, S.H.B., Wang, J.: 1985, Australian Journal of Physics 38, 929.
- Mathew and Ambastha (2000) Mathew, S.K., Ambastha, A.: 2000, Sol. Phys. 197, 75.
- Maurya and Ambastha (2010) Maurya, R.A., Ambastha, A.: 2010, Sol. Phys. 262, 337. doi:10.1007/s11207-009-9488-5.
- Miklenic et al. (2007) Miklenic, C.H., Veronig, A.M., Vršnak, B., Hanslmeier, A.: 2007, A&A 461, 697. doi:10.1051/0004-6361:20065751.
- Moore and Labonte (1980) Moore, R.L., Labonte, B.J.: 1980, In: M. Dryer & E. Tandberg-Hanssen (ed.) Solar and Interplanetary Dynamics, IAU Symposium 91, 207.
- Moore and Sterling (2006) Moore, R.L., Sterling, A.C.: 2006, Washington DC American Geophysical Union Geophysical Monograph Series 165, 43.
- Moore et al. (2001) Moore, R.L., Sterling, A.C., Hudson, H.S., Lemen, J.R.: 2001, ApJ 552, 833. doi:10.1086/320559.
- Priest and Forbes (2002) Priest, E.R., Forbes, T.G.: 2002, A&A Rev. 10, 313. doi:10.1007/s001590100013.
- Qiu et al. (2002) Qiu, J., Lee, J., Gary, D.E., Wang, H.: 2002, ApJ 565, 1335. doi:10.1086/324706.
- Schou et al. (2011) Schou, W., Scherrer, P.H., Bush, R.I., Wachter, R., Couvidat, S., et al.: 2011, Sol. Phys.,in preparation.
- Sterling, Harra, and Moore (2007) Sterling, A.C., Harra, L.K., Moore, R.L.: 2007, ApJ 669, 1359. doi:10.1086/520829.
- Sturrock (1966) Sturrock, P.A.: 1966, Nature 211, 695. doi:10.1038/211695a0.
- Thompson et al. (2003) Thompson, W.T., Davila, J.M., Fisher, R.R., Orwig, L.E., et al.: 2003, In: S. L. Keil & S. V. Avakyan (ed.) Society of Photo-Optical Instrumentation Engineers (SPIE) Conference Series, SPIE Conference 4853, 1.
- Wang (2006) Wang, H.: 2006, ApJ 649, 490. doi:10.1086/506320.
- Wang and Liu (2010) Wang, H., Liu, C.: 2010, ApJ 716, L195. doi:10.1088/2041-8205/716/2/L195.
- Wang et al. (2003) Wang, H., Qiu, J., Jing, J., Zhang, H.: 2003, ApJ 593, 564. doi:10.1086/376360.
- Wang and Sheeley (1999) Wang, Y., Sheeley, N.R. Jr.: 1999, ApJ 510, L157. doi:10.1086/311815.
- Yurchyshyn et al. (2006) Yurchyshyn, V., Karlický, M., Hu, Q., Wang, H.: 2006, Sol. Phys. 235, 147. doi:10.1007/s11207-006-0025-5.
- Zhang, Zhang, and Zhang (2008) Zhang, Y., Zhang, M., Zhang, H.: 2008, Sol. Phys. 250, 75. doi:10.1007/s11207-008-9150-7.